I deleted my point and figure chart the first week I tried it, because it looked broken. There was no time axis, no candles, and whole days when nothing new appeared on the screen at all. I went back to candles, took three more chop losses in the same week, and only then understood what the blank days had been telling me: on those days, price had not actually moved enough to matter. A funded account does not pay you for activity, it pays you for surviving the days when nothing real is happening, and point and figure is the only chart I have found that refuses to invent action when there is none. This guide is the version I trade now, with the settings, the rules, and the sizing maths that fit inside a prop firm daily loss limit.
In this article
- What point and figure actually is
- Point and figure versus Renko: the difference that decides the trade
- Box size and reversal: the two settings that build the chart
- The six rules I trade by
- The worked trade: a double-top breakout on EURUSD
- Position sizing under a daily loss limit
- When the strategy fails
- The five-trade log and the filter test
- My daily routine for point and figure
- Frequently asked questions
Every number in this guide uses the same account as the rest of this series: a 100,000-dollar funded account, a 5,000-dollar firm daily loss limit, and a personal daily stop of 1,000 dollars. I risk 500 dollars per trade, 0.5 percent of the account. If two trades stop out, my day is over at minus 1,000 dollars, with 4,000 dollars of firm headroom untouched. That buffer is the point: the sizing has to survive the losing days, not just celebrate the winning ones.
What point and figure actually is
Point and figure is a charting method that plots price movement and ignores time completely. Rising prices are drawn as a column of Xs, falling prices as a column of Os, and a new mark appears only when price moves by a fixed amount called the box size. Nothing is plotted for a quiet day, a quiet week, or a quiet month. The chart advances only when price earns it, which is why a point and figure chart looks so different from a candlestick chart of the same pair: the noise is simply absent, because the chart never had a reason to draw it.
Two settings build the whole chart. The box size is the price increment each X or O stands for, and the reversal amount is how many boxes price must retrace before a new column starts in the opposite direction. The classic combination is a 3-box reversal: price must move three boxes against the current column before the chart admits the move is real. A general point and figure beginner guide describes the same construction, X columns for rising prices and O columns for falling prices, with each mark standing for one fixed box. That single rule is what keeps a funded trader out of the whipsaw trades that kill evaluation accounts, because a one-box flicker against your position never even appears on the chart.
The signals themselves are refreshingly mechanical. A column of Xs breaking above the top of the previous X column is a double-top breakout, a buy signal. A column of Os breaking below the bottom of the previous O column is a double-bottom breakdown, a sell signal. There are fancier patterns, triple tops and catapults and the rest, but I trade only the double top and double bottom, because a funded account rewards the signal you can execute the same way every time, not the pattern collection you can admire.
Point and figure versus Renko: the difference that decides the trade
Traders often lump point and figure together with Renko, because both charts ignore time. I traded Renko first, and the difference between the two cost me money before I understood it, so it is worth stating plainly. A Renko brick is printed whenever price moves one fixed brick size in either direction, and the direction flips the moment that single increment is covered. Point and figure demands more: price must reverse by three full boxes before a new column begins. That makes point and figure slower to turn, and that slowness is the feature, not a flaw.
On a choppy EURUSD afternoon, Renko flipped direction four times while my point and figure chart printed nothing at all, because no move reached the three-box reversal threshold. Each Renko flip looked like a signal; none of them was. If you already trade Renko, point and figure is not a replacement for it, it is the stricter filter you put in front of it: I take Renko signals only when the point and figure chart agrees on direction, and I take point and figure breakouts on their own, because their higher bar for a turn is exactly what a daily loss limit needs.
Box size and reversal: the two settings that build the chart
Box size is where most traders go wrong, because they copy a stock-market table into a forex account. A 10-pip box on EURUSD is not the same kind of filter as a 10-pip box on GBPJPY, because the pairs do not move the same distance on an average day. My rule is simple: the box should be roughly one tenth of the pair’s average daily range, so that a normal day prints about ten boxes and a real breakout prints a column that stands out. Anything smaller turns the chart back into noise; anything larger and you wait a week for a signal that a funded account’s daily clock cannot afford.
| Instrument | Box size I use | 3-box reversal distance | Why it fits |
|---|---|---|---|
| EURUSD | 10 pips | 30 pips | Average day near 100 pips, so a day prints about ten boxes |
| GBPUSD | 15 pips | 45 pips | Wider daily range than EURUSD, needs a bigger box to filter the same noise |
| USDJPY | 10 pips | 30 pips | Similar daily range to EURUSD, same box keeps the routine identical |
| XAUUSD | 5 dollars | 15 dollars | Gold moves in dollars, not pips; a 5-dollar box matches its daily rhythm |
I use the close for plotting, not the high-low range, because wicks are the market’s favourite way of printing a signal that never really happened. A close-based chart only counts a box when price actually settles there, which costs me the occasional fast breakout and saves me from far more fake ones. The reversal amount stays at three boxes on every instrument. I have tested one-box and two-box reversals, and both turned the chart into the same whipsaw machine I was trying to escape.
The six rules I trade by
Rule one: trade only double-top breakouts and double-bottom breakdowns, on the daily point and figure chart, in the direction of the weekly trend. A breakout against the weekly trend is a counter-trend trade wearing a breakout’s clothes, and funded accounts are where counter-trend trades go to breach daily limits. Rule two: the breakout must close beyond the previous column’s extreme, not just poke above it intraday; a wick above the line that closes back inside is not a breakout, it is a trap, and the close-based chart already filters most of them. Rule three: the stop goes below the low of the last O column for a long trade, or above the high of the last X column for a short trade, never at a round number I invented. Rule four: no trade within thirty minutes of red-folder news on the pair, because a news spike prints boxes that have nothing to do with the pattern. Rule five: one point and figure trade per pair per day, so a single chart cannot eat the whole personal daily stop. Rule six: if the horizontal-count target is less than twice the stop distance, I skip the trade, because a funded account cannot live on one-to-one payoffs once spreads and the occasional slippage are counted.
The session filter deserves a sentence of its own. Point and figure on a daily chart does not need a session the way an intraday strategy does, but I still place entries only during the London and New York overlap for forex pairs, when the breakout has the liquidity to follow through. A breakout printed overnight on thin volume is the one most likely to reverse at the London open, and I would rather miss it than defend it.
The worked trade: a double-top breakout on EURUSD
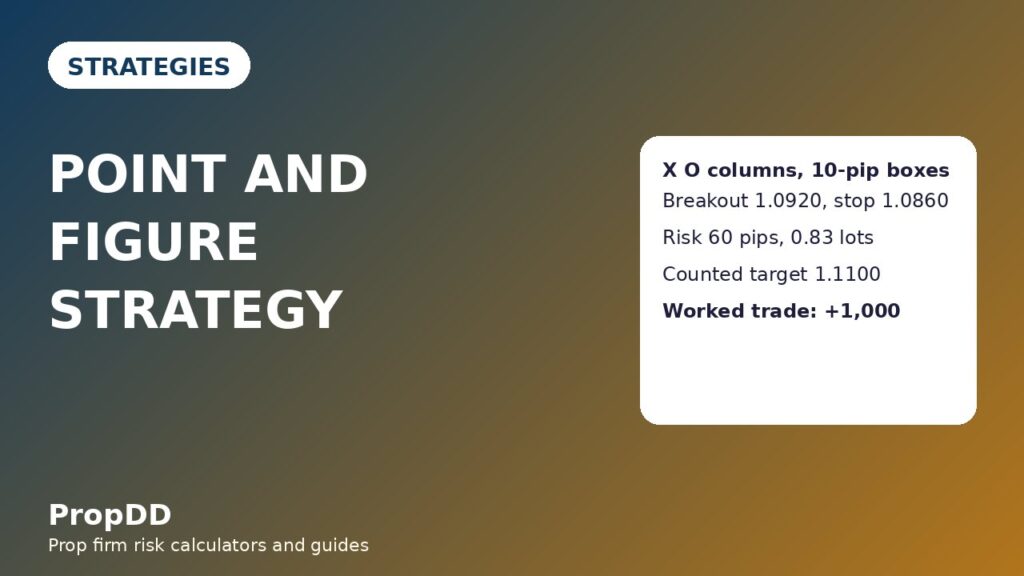
The trade I remember best is a EURUSD long from a daily point and figure chart that had spent eleven days building a base between 1.0820 and 1.0910. The X column finally closed above 1.0910, printing the double-top breakout, and I entered at 1.0920 on the next London open. The last O column’s low was 1.0860, so my stop went there, 60 pips below the entry. The base was six boxes wide, and the horizontal-count formula below projected 180 pips from the breakout, giving a full target of 1.1100. I took half off at 1.0980, one times the risk, and let the rest run to the counted target.
| Horizontal-count target formula | Worked numbers |
|---|---|
| Projected move = base width in boxes x box size x reversal amount | 6 boxes x 10 pips x 3 = 180 pips |
| Long target = breakout price + projected move | 1.0920 + 0.0180 = 1.1100 |
| Short target = breakdown price – projected move | Breakdown at 1.0820 – 0.0180 = 1.0640 |
| Trade leg | Price | Distance | Lots | Result |
|---|---|---|---|---|
| Entry, double-top breakout | 1.0920 | – | 0.83 | – |
| Stop, below last O column low | 1.0860 | 60 pips | – | Risk 500 dollars |
| First target, half off at 1R | 1.0980 | 60 pips | 0.42 | About +250 dollars |
| Counted target, rest off at 3R | 1.1100 | 180 pips | 0.42 | About +750 dollars |
| Total | – | – | – | About +1,000 dollars, 2R |
The trade took nine days to reach the counted target, which is the honest timescale for a daily point and figure setup. Traders who need same-day feedback will hate this chart, and they should, because it is not built for them. A funded account with a daily loss limit but no daily profit requirement is built for exactly this kind of patience: the stop was never threatened, the position never needed managing, and the only decision after entry was whether to hold the second half, which the counted target had already answered.
Position sizing under a daily loss limit
Position sizing on a point and figure trade starts from the stop distance the chart gives you, not from a lot size you feel comfortable with. The last O column’s low decides the stop, the stop distance decides the lots, and the 500-dollar risk cap decides everything else. I check the result against the max daily drawdown calculator before placing the trade, because a sizing error found on the calculator costs nothing, while the same error found on a live funded account costs the account.
| Stop distance | Lots at 500 dollars risk | Risk after rounding |
|---|---|---|
| 30 pips | 1.67 | 501 dollars |
| 40 pips | 1.25 | 500 dollars |
| 50 pips | 1.00 | 500 dollars |
| 60 pips | 0.83 | 498 dollars |
| 80 pips | 0.63 | 504 dollars |
The maths is lots = 500 divided by stop distance in pips times 10 dollars per pip per standard lot on EURUSD. When the stop distance is wider than 80 pips, the honest answer is usually to skip the trade or halve the risk, not to squeeze the lots down and pretend the payoff still works. A 120-pip stop at 500 dollars of risk pays 0.42 lots, and at that size the counted target has to run a very long way to justify tying up the account for two weeks. I also never stack a point and figure trade on top of a trend pullback trade on the same pair, because two strategies on one pair are one position with extra steps, and the personal daily stop counts the loss once, not per strategy.
When the strategy fails
Point and figure fails in exactly the market it is supposed to filter: the slow, grinding range where price oscillates inside a wide base for weeks, printing breakout after breakout that all reverse. The chart filters small noise beautifully and lets large noise straight through, because a 30-pip reversal in a 200-pip range looks like a genuine turn on every setting. My defence is the weekly trend filter and the one-trade-per-pair rule: two failed breakouts on the same pair in one week, and I stop trading that pair’s point and figure signals until the weekly chart prints a new column in the trend direction.
The second failure mode is the counted target itself. A horizontal count is a projection, not a promise, and in my log about half of all counted targets are never reached before the chart reverses. That is why half the position comes off at one times risk: the trade pays for its own risk even when the grand target fails, and the second half is a free look at the projection. Traders who hold the full position for the counted target either win big or give back a winning trade, and funded accounts punish the second outcome far harder than they reward the first.
The five-trade log and the filter test
I tested the six rules against my own recent history by splitting fourteen point and figure trades into two groups: the ones that passed every rule, and the ones I took before the rules existed, including counter-trend breakouts and news-window entries. The difference is the whole argument for trading this chart with rules instead of enthusiasm.
| Group | Trades | Wins | Losses | Winners total | Losers total | Net |
|---|---|---|---|---|---|---|
| Rule-filtered trades | 14 | 9 | 5 | +5,250 dollars | -2,500 dollars | +2,750 dollars |
| Unfiltered trades | 18 | 8 | 10 | +4,000 dollars | -5,000 dollars | -1,000 dollars |
The filtered group’s best single trade was 750 dollars, which is 27.3 percent of the group’s 2,750-dollar net profit, inside the 30 percent consistency ceiling most firms apply. The unfiltered group lost money despite winning nearly half its trades, because the losers were the counter-trend breakouts that ran straight through stops the chart had not yet admitted were wrong. The lesson I took from the comparison is not that point and figure is magic, it is that the filter rules are the strategy, and the X and O chart is just the cleanest place to apply them.
My daily routine for point and figure
My routine takes about fifteen minutes and happens once, at the London open. First I check the daily point and figure charts for EURUSD, GBPUSD and USDJPY, and note any new column printed overnight. Then I check the weekly trend for each pair and cross out any breakout against it. Then I check the news calendar for the day and cross out any pair with red-folder news inside thirty minutes of my planned entry. What survives that triple filter is the only trade I am allowed to take, and on most days nothing survives, which is a successful day for this strategy, not a wasted one. I log the surviving setups, the skipped ones, and the reason for each skip, because the log is what proved the filter test above, and it is what will prove the next adjustment too. For the wider discipline around that routine, the personal daily stop guide and the position sizing guide carry the rules this strategy sits inside.
Frequently asked questions
Is point and figure better than candlesticks for a funded account?
It is better at one specific job: keeping you out of trades that should never have been taken. Candlesticks show every flicker of price, which is useful for execution and terrible for patience. Point and figure hides the flicker by construction. I still use candles to place entries and read the session, but the decision to trade comes from the X and O chart.
What box size should a beginner start with?
Start with 10 pips on EURUSD and a 3-box reversal, on the daily chart, and do not change either setting for your first twenty signals. The temptation is to shrink the box when signals feel rare, but rare signals are the product working. Change the box only when you can show from your own log that the current setting misses breakouts you would have wanted, not because a quiet week bored you.
Does point and figure work on gold and indices?
Yes, with boxes measured in the instrument’s own units: 5 dollars on XAUUSD works in my routine, and index traders commonly use boxes scaled to the index’s daily range. The rules do not change, but the stop distances get wider, so the sizing grid matters more. A gold point and figure stop can easily exceed 80 pips of equivalent risk, and at that point halving the risk is usually wiser than taking the trade at full size.
How is the horizontal-count target actually calculated?
Count the boxes across the widest row of the base, multiply by the box size, multiply by the reversal amount, and add the result to the breakout price for a long trade, or subtract it for a short trade. A six-box base at 10 pips with a 3-box reversal projects 180 pips. Treat the result as a zone to take profit into, not a price the market owes you, and always bank half at one times risk first.
Why did my breakout reverse immediately?
The most common cause is trading against the weekly trend, which turns a genuine breakout into a counter-trend entry with the whole larger move against it. The second most common cause is a news spike printing boxes that vanish from meaning once the news passes. Both causes are filtered by rules one and four of this guide, which is why the rules exist.
Can I trade point and figure signals intraday?
You can, but the daily chart is where this strategy earns its keep on a funded account, because intraday point and figure charts print signals faster than the daily loss limit can absorb mistakes. If you must go intraday, use the same 3-box reversal, a box sized to about one tenth of the intraday session range, and the same one-trade-per-pair rule. Expect more signals, more losers, and a much stricter need for the weekly trend filter.
Trading on a funded account carries risk, and no chart pattern removes it. The rules in this guide are risk controls, not profit guarantees, and past results from my own log do not predict your results. Size every trade so that a normal losing day leaves the account intact, and stop for the day when your personal daily stop is hit.




1 comment
[…] my Renko strategy guide runs the same 0.5 percent risk rules on bricks instead of lines, and my Point and Figure guide covers the column version. The GoCharting Kagi chart guide explains the line construction with […]