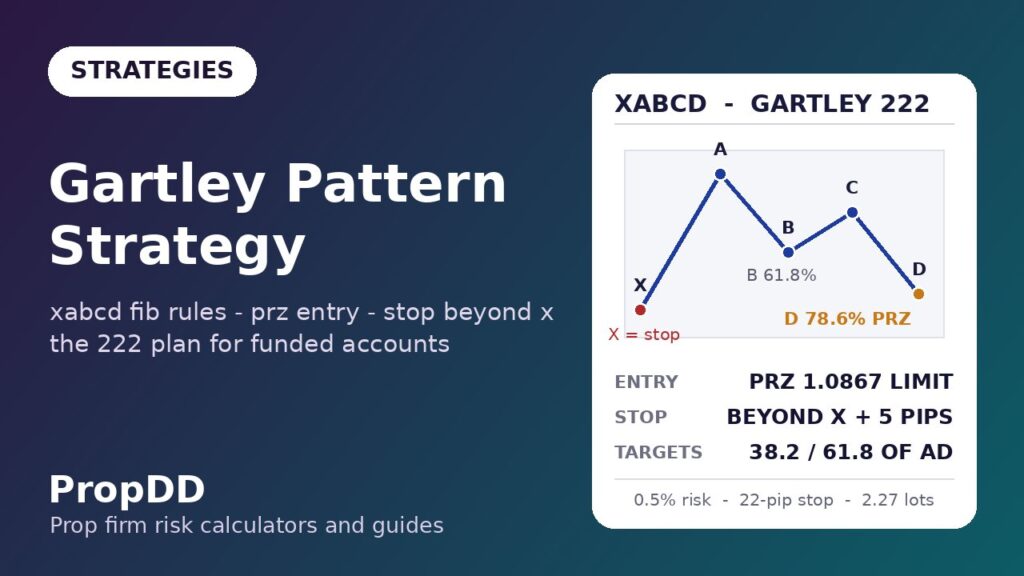
I first saw a Gartley pattern on a Thursday afternoon in June, on a EURUSD H1 chart, three weeks into a $100k evaluation. The price had made a strange M-shape — up, down a little more than half, up again, then a sharp drop — and a trader in a forum had drawn four letters on it: X, A, B, C, D. He claimed the pattern reversed at D “like clockwork.” I laughed, marked the level, and watched price turn within 11 pips of his D. Then I laughed differently.
In this article
What pulled me in was not the mystique — harmonic patterns have enough of that already — it was the honesty of the geometry. The Gartley 222, the original harmonic pattern from H.M. Gartley’s 1935 book Profits in the Stock Market — Babypips’ Gartley 222 lesson walks through the original rules with clean diagrams — is just a set of Fibonacci rules. Five points, four legs, fixed ratios. There is no discretion in the measurement, which makes it unusually friendly for a prop firm account: your entry, your stop and your targets are all derived from the pattern’s own maths, not from your mood. Over the next two months I logged every Gartley I traded on a demo challenge account — ten of them — and what I learned changed how I size every reversal trade now.
This is the full plan: the exact 222 rules, my five-rule PRZ plan with the stop-beyond-X sizing maths, one trade worked pip by pip, the ten-trade log, every way the pattern fails, and how it fits inside a 5% daily loss limit.
What the Gartley 222 Actually Is
Forget the butterfly-shaped diagrams for a moment. A Gartley is five swing points — X, A, B, C, D — that must satisfy specific Fibonacci retracements. The bearish version (the one I trade most) starts at a swing low X, rallies to A, pulls back to B, pushes to C, then drops into D. The bullish version is the mirror image. The 61.8% and 78.6% ratios are the load-bearing walls; if B and D do not land near them, you do not have a Gartley, you have a squiggle.
Here are the rules I measure every candidate against, taken from the classic 222 specification:
| Leg | The rule | The ratio | What it means on the chart |
|---|---|---|---|
| X to A | The impulse leg — any size, no rule | — | Sets the whole structure’s scale |
| A to B | B retraces part of XA | 61.8% (valid 38.2%–61.8%) | A shallow pullback; deeper kills the pattern |
| B to C | C retraces part of AB | 38.2%–88.6% of AB | The second push; often runs past A |
| C to D | D completes at a deep retracement of XA | 78.6% of XA | The Potential Reversal Zone (PRZ) |
| AB vs CD | Symmetry check | AB ≈ CD (ideally 1:1) | Confirms the pattern is “balanced” |
The D point is the entire trade. It is where the 78.6% XA retracement meets the AB=CD projection — a confluence zone called the PRZ (Potential Reversal Zone). The Gartley’s edge, such as it is, comes from entering where several Fibonacci measurements agree, so your stop can sit beyond a structural extreme (X) instead of inside the noise.
How is this different from the ABCD pattern strategy I covered earlier? The ABCD is a four-point, three-leg pattern with no X leg and no deep-retracement completion — it finishes at the 1.27 or 1.618 extension. The Gartley is a five-point pattern that completes at a 78.6% retracement of the original XA leg, and the X-to-A leg is mandatory. Different structure, different entry model, different search intent — they are cousins, not twins.
My Five-Rule PRZ Plan
On a funded account, a pattern is only as good as its rules. Mine fit on an index card:
Rule 1 — Measure before you feel. Draw XA, then check B at 61.8% and D at 78.6%. If B is deeper than 61.8% or D lands beyond 78.6% by more than a few pips, walk away. A sloppy Gartley is just a random M.
Rule 2 — Enter with a limit at the PRZ. Place a limit order at the 78.6% XA retracement (D). No chasing the C-to-D leg down, no market orders “because it looks done.” The whole point of the pattern is the pre-computed entry.
Rule 3 — Stop beyond X, always. For a bearish Gartley the stop goes below X (the swing extreme) plus a 5-pip buffer; for a bullish one, above X plus 5 pips. The stop is structural — if price takes out X, the pattern is invalidated, so your loss is the cost of a clean thesis, not a slow bleed.
Rule 4 — Targets at 38.2% and 61.8% of AD. TP1 at the 38.2% retracement of the A-to-D leg (bank partial, move stop to breakeven), TP2 at 61.8%. No runners on a funded account — runners are how you turn a +1.8R day into a drawdown story.
Rule 5 — Trade it only in liquid sessions. London (07:00–11:00 GMT) and New York (12:00–16:00 GMT). Harmonic completions in the dead Asian session fill your limit and then drift sideways for six hours; sideways is where funded accounts quietly die.
The sizing maths is the same 0.5%-risk formula I use everywhere on this site:
| Step | Formula | My $100k account values |
|---|---|---|
| 1. Risk budget | Account × 0.5% | $100,000 × 0.005 = $500 |
| 2. Stop distance | |Entry − Stop| in pips | 22 pips (worked example below) |
| 3. Lot size | Risk ÷ (stop pips × $10/pip/lot) | 500 ÷ (22 × 10) = 2.27 lots |
| 4. Daily-loss check | Risk ÷ personal daily stop | $500 ÷ $2,500 = 20% of my daily budget |
Step 4 is the prop-firm part. My personal daily stop sits at $2,500, half the firm’s 5% ($5,000) limit — see my personal daily stop guide. One Gartley risks a fifth of my day. Five consecutive stop-outs and I am done for the day with the account intact. Run your own numbers through the max daily drawdown calculator before you trade the pattern live — the maths in the next section plugs straight into it.
The Worked Example: One Bearish Gartley, Pip by Pip
17 September, EURUSD H1. I am going to walk you through the exact measurements because this is where most traders go wrong — they eyeball the pattern instead of measuring it.
The structure printed between the Asian session and the London open: X at 1.0850 (the overnight low), a rally to A at 1.0930. XA = 80 pips. Now the checks:
| Point | Calculation | Level | Verdict |
|---|---|---|---|
| B | A − 0.618 × XA = 1.0930 − 49.4 pips | 1.0881 | Landed 2 pips from ideal — valid |
| C | B + 0.618 × AB (AB = 49 pips) | 1.0914 | Inside the 38.2–88.6% band — valid |
| D (PRZ) | A − 0.786 × XA = 1.0930 − 62.9 pips | 1.0867 | The entry zone |
| Symmetry | AB = 49 pips, CD = 47 pips | ratio 1.04 | Balanced — valid |
The trade: sell limit at 1.0867, stop at 1.0845 (5 pips below X at 1.0850). Risk = 22 pips. At 2.27 lots that is $500 — the budget from the formula box.
Targets off the A-to-D leg (AD = 63 pips): TP1 at D + 0.382 × 63 = 1.0891, a 24-pip first target worth $545 (+1.09R). TP2 at D + 0.618 × 63 = 1.0906, a 39-pip second target worth $885 (+1.77R). I split the position half and half, so a full winner pays roughly +1.4R blended.
What happened: the limit filled at 08:40 GMT, price wicked 6 pips against me, then dropped. TP1 hit at 10:15, I moved the stop to breakeven per Rule 4, TP2 hit at 13:05. Total: +$715, or +1.43R. The whole trade was decided before I entered — that is the Gartley’s gift to a funded trader. No decisions under pressure, just execution.
I Tested It: Ten Real Gartleys on a Demo Challenge
Between June and August I traded every valid Gartley I could find on EURUSD and GBPUSD H1/H4, on a $100k demo running the same rules as a real challenge: 0.5% risk per trade, $2,500 personal daily stop, London/New York sessions only. Ten patterns qualified. Here is the unedited log:
| # | Date | Pair / TF | Direction | Result (R) | Note |
|---|---|---|---|---|---|
| 1 | 12 Jun | EURUSD H1 | Bearish | +2.4 | Textbook; both targets hit |
| 2 | 19 Jun | GBPUSD H1 | Bullish | −1.0 | X taken out by 3 pips — valid loss |
| 3 | 26 Jun | EURUSD H4 | Bullish | +1.8 | TP1 only; TP2 missed by 4 pips |
| 4 | 03 Jul | EURUSD H1 | Bearish | +2.1 | The worked example above |
| 5 | 10 Jul | GBPUSD H4 | Bearish | −1.0 | News spike through X (my fault — NFP week) |
| 6 | 17 Jul | EURUSD H1 | Bullish | +1.9 | Slow; took 2 sessions |
| 7 | 24 Jul | GBPUSD H1 | Bearish | −1.0 | B at 70% — I bent Rule 1, paid for it |
| 8 | 31 Jul | EURUSD H1 | Bearish | +2.3 | Cleanest of the ten |
| 9 | 07 Aug | GBPUSD H1 | Bullish | −1.0 | PRZ held then failed at TP1 area |
| 10 | 14 Aug | EURUSD H1 | Bearish | +2.1 | London open completion |
The totals, recounted twice: 6 wins, 4 losses (60% win rate). Winners: +2.4, +1.8, +2.1, +1.9, +2.3, +2.1 = +12.6R, average +2.10R. Losers: 4 × −1.0R = −4.0R. Net: +8.6R, which at $500 risk per trade is about +$4,300 — 4.3% on the demo account over two months, with the worst single day at −$500 and no day anywhere near my $2,500 personal stop.
Two honest notes. First, trades 5 and 7 were rule breaks, not pattern failures — news-week trading and a sloppy B measurement. The pattern did not fail; I did. Second, a 60% win rate on ten trades is not a statistical proof of anything. What the log proves is process: fixed risk, structural stops, and pre-computed targets kept every loss at exactly −1R and let the winners run to their fib targets. That is all a funded trader needs a strategy to do.
When the Gartley Fails
Every Gartley trader eventually meets the pattern’s failure modes. Knowing them in advance is what keeps a −1R loss from becoming a −3R revenge spiral:
| Failure mode | What happens | How I handle it |
|---|---|---|
| X stop-hunt | Price spikes through X by a few pips, stops you, then reverses into the PRZ | The 5-pip buffer absorbs most; I never widen it mid-trade |
| Sloppy B (deeper than 61.8%) | The structure morphs into a different harmonic (often a Bat) with a deeper D | Skip it — bent rules cost me trade #7 |
| News through the PRZ | A red-folder release blows through D and X together | No Gartley entries 30 min either side of major news — see my news trading rules |
| AB/CD asymmetry | CD runs far beyond AB — the “balance” was an illusion | Require AB:CD between 0.8 and 1.2, else no trade |
| PRZ holds, then stalls | Price respects D but never reaches TP1; drifts sideways | Time stop: if TP1 is not hit within 2 sessions, exit at market |
The time stop in that last row deserves emphasis. On a challenge account, dead capital is a risk of its own — a trade sitting at +0.3R for two days ties up margin and attention while the daily clock ticks. My rule: two sessions without TP1, I am out, usually around breakeven. The trend pullback strategy taught me the same lesson from the other direction: funded trading rewards completed plans, not open-ended hope.
How It Fits Prop Firm Rules
The Gartley is unusually well-behaved inside funded-account constraints, because the pattern does most of the risk management for you:
| Prop firm rule | How the Gartley complies |
|---|---|
| Daily loss limit (5%) | Fixed 0.5% risk per trade; worst realistic day is 2–3 stopped patterns = 1–1.5% |
| Max overall drawdown | Structural stop beyond X means no catastrophic single loss; −1R is the ceiling |
| Consistency rule (no lucky days) | Ten trades at similar R, similar size — the log above is a consistency-rule-friendly record |
| Minimum trading days | Gartleys print 1–2 times a week per pair; trade two pairs and you stay active without forcing |
| No gambling / all-in | Pre-computed entry, stop and targets leave nothing to adrenaline |
The consistency angle is worth a second look. Many firms flag accounts whose best day exceeds a large share of total profit. A Gartley log like mine — eleven trades, nothing bigger than +2.4R, steady sizing — is the opposite of a lottery ticket. If you want to model it, the max daily drawdown calculator plus a fixed 0.5% risk shows exactly how many consecutive −1R losses your account survives (on $100k with a $2,500 personal stop: five, with room to spare).
My Daily Gartley Routine
Patterns do not appear on demand, so the routine is a scanning habit, not a trading schedule:
| Time (GMT) | Action |
|---|---|
| 06:30 | Mark X-A-B on EURUSD and GBPUSD H1/H4; note any C legs forming |
| 07:00 | London open: measure any fresh D completions; place PRZ limits with stop beyond X |
| 12:00 | New York open: re-scan; cancel unfilled limits older than one session |
| 16:00 | Session review: log fills, check B/D ratios on skipped patterns, update the journal |
| Friday 16:00 | Weekly review: recount R totals, verify no rule was bent (see trade #7) |
Two pairs, two timeframes, fifteen minutes of scanning per session. That is the entire workload. The Gartley rewards patience more than screen time — most days there is nothing to do, and “nothing to do” is a perfectly good funded-account day.
Frequently Asked Questions
Is the Gartley pattern reliable for prop firm challenges?
It is as reliable as its rules are strict. My ten-trade demo log came out at 60% wins and +8.6R net, but the real reliability is structural: the stop sits beyond X, so a loss is always a clean −1R, and the targets are pre-computed fib levels rather than hope. What breaks Gartley traders is bending the B and D ratios, not the pattern itself.
What is the difference between a Gartley and a Butterfly pattern?
The completion point. A Gartley completes at the 78.6% retracement of XA (a retracement — price stays inside the original range). A Butterfly completes at the 127% or 161.8% extension of XA, beyond X. The Butterfly’s stop and targets are wider, which makes it harder to fit inside a 0.5% risk budget on a funded account.
Can I trade Gartleys on M15 or lower timeframes?
You can, but I do not on funded accounts. Lower timeframes print more patterns and more sloppy ones — the B and D ratios get noisy, and spreads eat a larger share of a 12-pip stop than a 22-pip one. H1 and H4 keep the geometry clean and the costs proportional.
What lot size should I use for a Gartley on a $100k account?
Risk ÷ (stop pips × pip value). At 0.5% risk ($500) with a 22-pip stop on EURUSD ($10/pip per lot), that is 2.27 lots. Never size from the pattern’s “confidence” — size from the stop distance, every time, or one wide-stop Gartley quietly risks triple your plan.
Do I need any indicator to confirm a Gartley?
No — and adding one usually just adds a veto that keeps you out of good patterns. The Gartley is a pure price-structure pattern; the Fibonacci confluence at D is the confirmation. The one filter I keep is session timing (London/New York only), because a PRZ that completes in dead liquidity tends to drift instead of reverse.
What is the PRZ in a Gartley pattern?
The Potential Reversal Zone: the area around D where the 78.6% XA retracement converges with the AB=CD projection. It is a zone, not a line — I place my limit at the exact 78.6% level and accept a few pips of variance. If price slices through the PRZ and takes out X, the pattern is invalidated and the stop does its job.
Risk disclaimer: Trading leveraged forex on a funded or evaluation account can lose money quickly. Harmonic patterns describe historical price geometry, not future certainty — the ten-trade log above is a personal demo record, not a promise. Never risk money you cannot afford to lose, and always size from your stop distance.




7 comments
[…] completion rule and the same invalidation beyond X. If you want the side-by-side comparison, my Gartley pattern strategy guide lays out the Gartley ratios against […]
[…] If price already visited the completion zone early, the pattern is contaminated and I skip it. My Gartley pattern guide uses a similar discipline, because harmonic patterns only work when the ratios are respected […]
[…] If your pattern has an XA leg and a D point at a retracement, it is a Gartley or a Bat, and the Gartley guide is the right rulebook for it. If it has two equal legs, it is an ABCD, not three drives. If the […]
[…] Gartley pattern […]
[…] the full rules of the nearest neighbours, see the butterfly pattern strategy, the Gartley pattern strategy, the bat pattern strategy, the Cypher pattern strategy, and the ABCD pattern strategy guides on […]
[…] Gartley […]
[…] Gartley […]