Most people who buy a prop firm challenge can name one loss limit. A few can name two. Almost nobody can tell you how the two interact, and that gap in understanding is where a surprising number of accounts quietly die. You can obey one rule perfectly and still break the other.
In this article
- Two rules, two different jobs
- Typical sizes (examples, not any firm's rule)
- What each one is measured from
- A bad week, day by day
- Which one do traders hit more often?
- When the overall limit trails
- Plan with the smaller of the two
- A simple two-floor card
- Cut size as the cushion shrinks
- Profit target versus overall limit
- What happens when you break each one
- Challenge phase versus funded phase
- The psychology of the slow bleed
- Common mistakes
- Two accounts, same trader, different outcomes
- Do the daily and overall limits ever reset together?
- A weekly check that takes two minutes
- If you're choosing between firms
- One habit that ties it together
- A final thought
- Frequently asked questions
- The short version
This article lays out the daily and overall drawdown side by side, shows how they behave over a bad week, explains what changes when the overall limit trails, and gives you a simple way to keep both floors in view. To get the daily figure for your own account right now, use the drawdown calculator; this guide covers the bigger picture around it.
Two rules, two different jobs
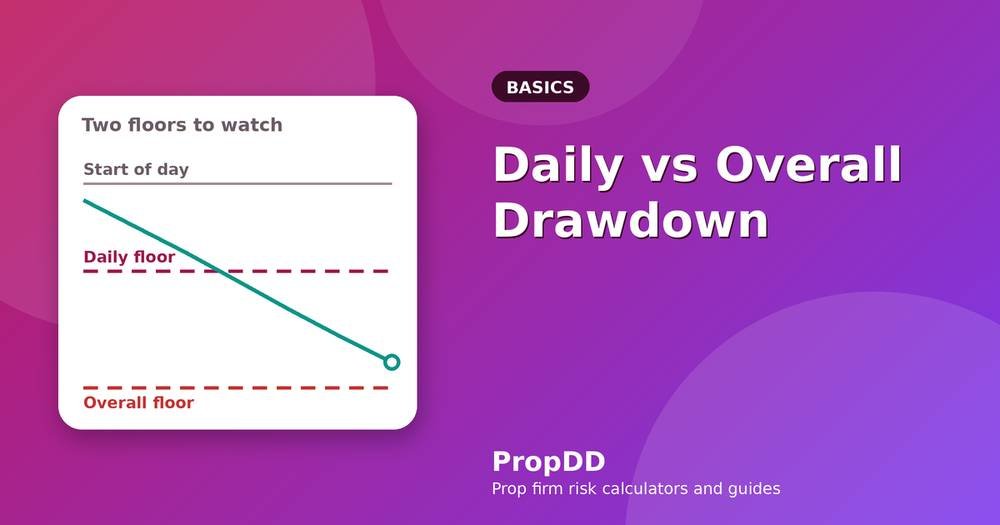
Think of driving. The daily limit is a speed limit: it governs how fast you can lose in a short window, and it resets every day. The overall limit is the edge of the road: it governs how far the account can fall in total, and it doesn’t reset. A trader can drive under the speed limit all week and still, mile by mile, drift off the edge.
The daily rule exists to stop one catastrophic day. The overall rule exists to stop a long, slow slide. Firms need both because they protect against different problems.
Typical sizes (examples, not any firm’s rule)
You’ll often see a daily limit somewhere around 3% to 5% and an overall limit around 6% to 10%, though firms vary widely, and some use dollar amounts. On a $100,000 account that might look like $5,000 per day and $10,000 in total. The numbers here are only for illustration, because every firm’s rulebook is different and rules change. Check yours.
What each one is measured from
The daily limit is measured from a start-of-day figure: your balance or equity at the firm’s reset time, or sometimes the initial account size. The overall limit is measured from one of three places: the initial balance (static), the highest balance reached (trailing on closed results) or the highest equity reached (trailing on live equity). We cover the difference in static versus trailing drawdown. For the daily side, the arithmetic is in how to calculate max daily loss.
A bad week, day by day
Take a $100,000 account with a 5% daily limit ($5,000) and a 10% static overall limit (floor at $90,000).
| Day | Result | Equity at close | Daily limit used | Room to overall floor |
|---|---|---|---|---|
| Mon | −$2,200 | $97,800 | 44% | $7,800 |
| Tue | −$2,500 | $95,300 | 50% | $5,300 |
| Wed | −$2,400 | $92,900 | 48% | $2,900 |
| Thu | −$2,000 | $90,900 | 40% | $900 |
Look at the daily column. Every day is under 50%, a perfectly “safe” daily record. Yet by Thursday evening the account is $900 from the overall floor and one ordinary loss ends it. Four calm-looking days did what no single day could. That’s the whole point of having two limits, and the reason to watch both.
Which one do traders hit more often?
The daily limit is smaller, so it’s the one that ends accounts in a sudden, painful way. The overall limit is the one that ends them slowly, usually after a run of mediocre weeks with no real recovery. In my experience of reading what traders say about their own failures, the slow ones are the ones that people find hardest to explain, because there’s no single moment to point at.
When the overall limit trails
Under a static overall limit, profit becomes a buffer: make $6,000 and your room to the floor grows by $6,000. Under a trailing limit, the floor rises with your peak, so profit doesn’t increase your room. A trader who is up $6,000 with a 10% trailing limit has the same $10,000 of room as on day one, but their daily limit might still be 5% of a bigger number. The two rules then pull in different directions, which is why it’s worth knowing which kind you have before you choose a firm.
Plan with the smaller of the two
On any given day, your real constraint is whichever is closer: the room left against the daily floor, or the room left against the overall floor. Early in a challenge, the daily one is usually tighter. After a few losing weeks, the overall one can become the binding limit, even if today looks clean. Write both numbers on the same card each morning, and trade to the smaller.
A simple two-floor card
Each morning, write: today’s start-of-day equity, the daily floor (start minus the daily limit), the overall floor, and the room to each. The smaller room is your working limit. At the end of the day, update the overall room. It takes a minute, and it makes the interaction visible. A tracking service such as Myfxbook can chart running drawdown if you prefer something automatic, and Investopedia has a short explainer on maximum drawdown.
Cut size as the cushion shrinks
Here’s a practical rule I find sensible: when your room to the overall floor falls below half of the original cushion, halve your risk per trade. When it falls below a quarter, halve it again, and consider whether you should be trading at all this week. This isn’t a theory, it’s just arithmetic about survival. The smaller your cushion relative to the size of normal losses, the likelier a normal run of bad luck ends the account. Our guide to how much to risk per trade shows how to pick the starting number.
Profit target versus overall limit
Look at the ratio between the profit target and the overall limit. An 8% target against a 10% limit gives you 1.25 units of room per unit of target, which is generous. A 10% target against a 6% trailing limit is a much tighter proposition, because you have to make more than you’re allowed to lose, and the limit trails your gains. Put the numbers side by side when you compare firms rather than looking at the headline percentage. For a full checklist of what to verify, see daily drawdown rules: what to check before you buy a challenge.
What happens when you break each one
Consequences differ by firm. Some close the account for either breach. Others treat a daily breach as a pause for the day and an overall breach as the end. A few let you buy a reset. The terms spell it out, so read the sentence on breach and copy it into your notes. The distinction changes how you think about risk: if a daily breach merely pauses trading, you’d still never want to rely on that.
Challenge phase versus funded phase
Some firms change the rules after you pass, perhaps a tighter daily limit or a different type of overall limit. Check both sections. If the funded phase is stricter, plan for that from the beginning, so that passing doesn’t mean switching to a style that doesn’t suit you. We look at what changes later in scaling plans and drawdown on funded accounts.
The psychology of the slow bleed
A sudden daily breach feels like a crash. A slow overall slide feels like fog. Each day you tell yourself it’s only a small loss, you’re within the daily limit, and you can recover next week. Then the cushion is gone. The defence is to look at the overall room every day, not just the daily one, and to make a rule that triggers on a weekly drawdown, for example, “if I’m down 3% in a week, I trade half size next week”. Rules like that convert fog into a clear decision.
Common mistakes
Tracking only the daily limit. Assuming the overall limit is far away because it’s a bigger number. Ignoring whether it trails. Taking more risk after a bad week to “catch up” before the cushion runs out. And forgetting that both rules might count floating losses, which is covered in floating losses and open trades.
Two accounts, same trader, different outcomes
To see why the type of overall limit matters, picture two imaginary accounts of $100,000, both run by the same trader with the same trades. Account A has a 10% static limit, floor $90,000. Account B has a 10% trailing limit following closed balance.
The trader makes $5,000 in two weeks, so both accounts sit at $105,000. On Account A the floor is still $90,000 and the cushion is $15,000. On Account B the floor moved up to $95,000 and the cushion is still $10,000. Then a rough fortnight takes $9,000 off: both are at $96,000. Account A has $6,000 of room left. Account B has $1,000. Same trading, very different survival odds, purely because of how the overall limit is defined.
It’s the sort of difference that doesn’t appear in a price comparison and has a big effect on whether you keep the account. If you have a choice, look hard at the type.
Do the daily and overall limits ever reset together?
Not usually. The daily limit resets at the firm’s reset time, as covered in the daily drawdown reset time guide. The overall limit doesn’t reset at all, except in the way a trailing floor moves. Some firms re-base the overall limit after a payout or a scaling step, so it’s worth checking what happens to your floor when your account size changes.
A weekly check that takes two minutes
On Friday evening, write down three things. Your equity. The distance to the overall floor. The largest share of the daily limit you used in any day this week. If the third number is above 60%, your risk per trade is too high. If the second has shrunk by more than a third in one week, reduce size for the next one. That’s the entire system, and it will catch the slow bleed before it becomes terminal.
Your trading journal is the natural home for these notes. The act of writing them down matters as much as the numbers themselves, because it forces a pause at exactly the point where a trader on a bad run most wants to keep going.
If you’re choosing between firms
Put the two limits for each firm on one line of a notebook: daily percentage and base, overall percentage and type, whether either counts floating loss, and the profit target. Then run an imaginary bad week through each, like the one above. The firm where the same bad week leaves you with the most room is the better fit for your style. It isn’t glamorous, but it’s the comparison that matters far more than the logo on the website or the size of the discount code.
One habit that ties it together
Every Friday, take a screenshot of your equity curve with the two floors drawn on it as horizontal lines. It takes a minute, and after a few weeks you have a visual record of how close you got and how often. Most traders are surprised by how often the line drifts toward one floor or the other without them noticing in the moment. Seeing it on one picture changes how seriously you take the unglamorous middle of a challenge.
A final thought
Drawdown rules are the frame your strategy has to live in. A great strategy in the wrong frame fails, and an average one in a roomy frame can survive long enough to get good. Knowing both limits, and how they push against each other, is the cheapest edge on offer.
Frequently asked questions
Can I breach the overall limit without breaching the daily one?
Yes, and it’s common. A string of moderate losing days can erode the overall cushion without ever touching a daily floor.
Do both limits count floating losses?
Often yes, but it depends on the firm. Check each rule separately in the terms.
Does profit increase my daily limit?
It can, if the daily limit is calculated on start-of-day equity. If it’s based on the initial size, it stays the same.
Which limit should I plan around?
Whichever leaves you less room today. Write both and trade to the smaller.
The short version
The daily limit stops a bad day; the overall limit stops a bad month. Keep two floors in front of you, trade to the smaller room and cut size as the overall cushion shrinks. For the rule that sits underneath all this, read the prop firm max daily drawdown explained, and for free background lessons, BabyPips is a good place to keep learning.