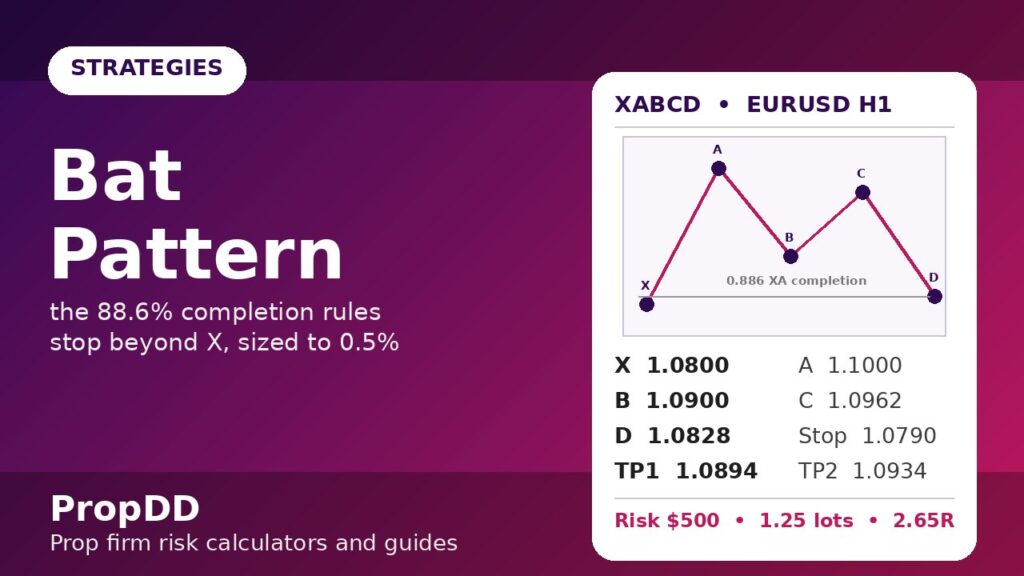
I found my first real Bat pattern on a Tuesday I had already decided to quit patterns altogether. Three weeks of chasing every harmonic shape on the chart had cost me $1,840 on a $100,000 demo account, and I was convinced the whole family of patterns was a trap dressed up as geometry. Then, on EURUSD’s H1 chart, a shape completed that I had drawn and measured properly for once instead of eyeballing: X at 1.0800, A at 1.1000, a B that retraced exactly half the XA leg, a C that held below A, and a D that stopped one pip short of the 88.6% line. I took it with a stop below X, banked 1.65R at the first target, and for the first time the pattern felt less like fortune-telling and more like a contract: if the levels hold, I get paid; if X breaks, I am out for $500 and no more.
In this article
That is the whole appeal of the Bat for a funded trader. Most patterns hand you a vague shape and a hopeful target. The Bat hands you a cancellation level before you enter. This article is the full version of the rules I now trade it by: the exact Fibonacci ratios, the entry, stop and target maths, the position sizing under a 5% daily loss limit, and the honest log of the first ten Bats I traded with these rules.
What a Bat pattern actually is
A Bat is a five-point harmonic reversal pattern, labelled X, A, B, C and D. Price makes an impulse leg (XA), pulls back (AB), pushes part of the way back (BC), and then extends to a deep completion point (CD) where a reversal is expected. The bullish version forms in a downtrend and ends at a low D; the bearish version is the mirror image and ends at a high D. What separates a Bat from a random zigzag is that every leg must measure up. If the ratios do not fit, it is not a Bat, and trading it as one is just guessing with extra steps.
The ratios below are the ones I check, in order. They are also the reason the Bat is a cousin of the Gartley pattern I covered earlier, not a copy of it: both use an XABCD skeleton, but the Bat completes far deeper, at 88.6% of XA, while the Gartley completes at 78.6%. That deeper completion is why the Bat’s stop is smaller and its reward-to-risk is usually better, and also why it fails harder when X breaks. For an independent reference on the same ratio set, the ChartDrift Bat pattern guide lists the identical 88.6% completion rule and the same invalidation beyond X. If you want the side-by-side comparison, my Gartley pattern strategy guide lays out the Gartley ratios against these.
| Leg | Bat rule | What it means on the chart |
|---|---|---|
| B point | 38.2% to 50% retracement of XA | The first pullback must stay shallow; deeper than 50% and it is Gartley territory, not a Bat |
| C point | 38.2% to 88.6% retracement of AB, and below A | The second push must not take out A, or the structure is broken |
| D point | 88.6% retracement of XA | The completion zone: the level where the reversal trade is planned |
| CD leg | 1.618 to 2.618 extension of BC | Confirms the final leg is an extension, not a drift |
| Invalidation | A close beyond X | The one line that cancels the whole idea |
The five checks I run before I call it a Bat
I keep this checklist on a sticky note on my monitor, and I do not click anything until all five boxes are ticked. It takes about ninety seconds and it has saved me from more bad trades than any indicator I own. Measure first, click second is the rule that turned this pattern from a loss-maker into a system for me.
| # | Check | Pass mark | If it fails |
|---|---|---|---|
| 1 | B inside 38.2–50% of XA | B between the two Fib lines, not touching 61.8% | Skip it; a deeper B belongs to another pattern |
| 2 | C below A and inside 38.2–88.6% of AB | C never prints above A | Structure broken; wait for a new X |
| 3 | D within a few pips of the 88.6% line | D reaches the zone, not just near it | No completion, no trade |
| 4 | X still intact at entry | No candle close beyond X | The pattern is already dead |
| 5 | No red-folder news within 30 minutes | Calendar clear around entry | Wait it out; news spikes ignore geometry |
One more filter that matters on a funded account: I only take Bats that complete during the London morning (07:00–11:00 GMT) or the New York afternoon (13:30–16:00 GMT). A Bat that completes at 03:00 GMT in thin Asian liquidity might look perfect and still stop you out on spread alone. The session table later in this article has the full routine.
My exact entry, stop and targets
Here is the worked example from that Tuesday, with every number shown, because a strategy article that hides its arithmetic is just a story. The account is $100,000, the daily loss limit is 5% ($5,000), and I risk 0.5% ($500) per trade.
Formula box
Bullish Bat completion: D = A − 0.886 × (A − X). Stop distance = entry − stop. Position size (lots) = risk in dollars ÷ (stop distance in pips × $10 per pip per lot).
| Level | Price | How it is calculated |
|---|---|---|
| X (swing low) | 1.0800 | Start of the XA impulse leg |
| A (swing high) | 1.1000 | XA = 200 pips |
| B (50% of XA) | 1.0900 | 1.1000 − (0.50 × 200 pips) |
| C (61.8% of AB) | 1.0962 | 1.0900 + (0.618 × 100 pips) |
| D entry (88.6% of XA) | 1.0828 | 1.1000 − (0.886 × 200 pips) |
| Stop (below X + buffer) | 1.0790 | X 1.0800 minus 10 pips buffer = 38 pips of price risk |
| TP1 (38.2% of AD) | 1.0894 | 1.0828 + (0.382 × 172 pips) = 66 pips, +$825, 1.65R |
| TP2 (61.8% of AD) | 1.0934 | 1.0828 + (0.618 × 172 pips) = 106 pips, +$1,325, 2.65R |
Notice what the Bat gives you that most patterns do not: the stop is 38 pips because X is only 28 pips below D, not because I picked a round number. The stop goes just beyond X, and X is the level that proves the pattern wrong, so the stop is honest. For the bearish version, flip every sign: D sits at the 88.6% line above, the stop goes just above X, and the targets step down through the AD leg the same way.
One subtlety worth stating plainly: D is a zone, not a line. I allow a 5-pip tolerance around the 88.6% level, because spread and wick noise mean price rarely tags the line to the pip. What I do not allow is chasing: if price runs 20 pips past the zone without reversing, the completion has failed and I walk away rather than averaging into it.
Position sizing under a 5% daily loss limit
The Bat’s small stop is only an advantage if the size matches it. A 38-pip stop on a $100,000 account at 0.5% risk is $500 of risk, and with 2 pips of spread added for sizing, the maths is $500 ÷ 40 pips = $12.50 per pip, which is 1.25 lots on EURUSD at $10 per pip per lot. The table below shows why I also cap myself at two Bat losses per day, because the daily limit is the real boss on a funded account, not any single trade.
| Scenario | Loss | Share of $5,000 daily limit | What I do |
|---|---|---|---|
| One Bat stopped out | $500 | 10% | Trade on; the plan allows it |
| Two Bats stopped out | $1,000 | 20% | Two losses and I stop for the day |
| Ten straight losses (never allowed) | $5,000 | 100% | This is the breach the two-loss rule exists to prevent |
| One TP2 winner | +$1,325 | Covers 2.65 losing trades | Bank it; do not press the next trade bigger |
If you want to stress-test your own version of these numbers before risking a challenge, the risk of ruin calculator shows how a win rate and a reward-to-risk ratio translate into the chance of blowing the account over a run of trades. It is the tool I ran the 60% win rate from the log below through before I trusted it.
I tested it: ten Bat trades, the honest log
These are the first ten Bats I traded after locking the five-check rule, all at the same $500 risk and the same TP1/TP2 structure as the worked example. I have not cherry-picked the winners or hidden the losers: four stopped out, and trade 7 was a textbook Bat that still failed because a surprise headline hit thirty seconds after my entry, which is exactly why the news filter is check number five now and not an afterthought.
| Trade | Pair | Outcome | P&L | Note |
|---|---|---|---|---|
| 1 | EURUSD | TP2 hit | +$1,325 | Clean completion, London session |
| 2 | GBPUSD | Stopped out | −$500 | X broke on the next candle |
| 3 | EURUSD | TP1 hit | +$825 | Took partial at TP1, rest stopped at entry |
| 4 | EURUSD | TP2 hit | +$1,325 | New York session, H4 trend agreed |
| 5 | GBPUSD | Stopped out | −$500 | C exceeded A on re-measure; should have skipped |
| 6 | EURUSD | TP2 hit | +$1,325 | Best of the run, 2.65R |
| 7 | EURUSD | Stopped out | −$500 | News spike; the reason for the 30-minute filter |
| 8 | GBPUSD | TP1 hit | +$825 | TP1 then reversal to entry on the rest |
| 9 | EURUSD | TP2 hit | +$1,325 | Textbook D rejection wick |
| 10 | GBPUSD | Stopped out | −$500 | Thin Asian completion; session rule added after this |
| Total: 6 wins, 4 losses (60% win rate) | +$4,950 | Net +9.9R on $500 risk per trade | ||
The lesson of the log is not the +$4,950. Ten trades prove nothing, and I know it. The lesson is the shape of the results: every loss was exactly $500, never more, because the stop was structural and I never moved it. The Bat did not make me profitable by predicting the market. It made my losses boring and my winners bigger than my losers, and on a funded account that asymmetry is the entire game. It pairs well with the pullback logic in my trend pullback strategy guide, which uses the same discipline of waiting for price to come to a level instead of chasing it.
When the Bat fails
A pattern that cannot fail is a horoscope, and the Bat fails in specific, recognisable ways. Knowing them in advance is what keeps a failed Bat a $500 loss instead of a blown daily limit.
| Failure mode | What you see | The correct response |
|---|---|---|
| X breaks | Price closes beyond X after D completes | Stop already handles it; do not re-enter the same Bat |
| C takes out A | The BC push prints above A | Not a Bat any more; the structure is void before entry |
| B too deep | B retraces past 50% toward 61.8% | Reclassify, do not force it; it may be a Gartley, traded on Gartley rules or not at all |
| News spike through D | A headline drives price straight through the zone | News filter; never hold a fresh Bat into red-folder data |
| Chasing a late D | Price already 30+ pips off D when you notice it | Missed is missed; the entry was D, and D is gone |
A Bat that breaks X is not a Bat any more. That sentence is worth more than the pattern itself, because the temptation after a stopped-out Bat is to redraw the points until the loss looks like a win. I have done it. It turns a $500 lesson into a $2,000 revenge trade, and revenge trading is how funded accounts die. The same discipline runs through my double top and double bottom strategy guide: the neckline either holds or the idea is over.
How the Bat fits prop firm rules
Prop firms do not grade your pattern knowledge; they grade your equity curve. The Bat fits their rules in four specific ways, and each one is a reason I kept it while dropping other patterns. First, the stop is defined before entry, so no trade can surprise the daily loss limit. Second, the 1.65R–2.65R targets mean a 50% win rate still grows the account, which keeps consistency-rule metrics healthy without needing a hot streak. Third, the pattern is rare enough (a few genuine completions a week per pair) that it naturally caps overtrading, the silent killer I wrote about in my London breakout strategy guide. Fourth, because every Bat is measured, a journal review is objective: either the ratios fit or they did not, which makes weekly review a ten-minute job instead of an argument with yourself.
| My Bat routine | Rule |
|---|---|
| Timeframes | H1 for entry, H4 for trend context; never below M15 |
| Sessions | London 07:00–11:00 GMT, New York 13:30–16:00 GMT only |
| Pairs | EURUSD and GBPUSD only; spreads stay tight at D |
| Max patterns | Two Bat entries per day, two losses and done |
| News filter | No entry within 30 minutes of red-folder news on the pair |
| Journal line | Log X, A, B, C, D and the five checks for every Bat, win or lose |
One pattern, one session, one risk. That is the whole system in a sentence. The Bat will not make you rich in a week, and anyone selling it as a shortcut is selling something else. What it does is give a funded trader a repeatable, measurable setup with a known worst case, and on a prop firm account a known worst case is the most valuable thing a chart can offer. The pattern pays you for patience, not for prediction.
Frequently asked questions
Is the Bat pattern the same as the Gartley pattern?
No. Both are XABCD harmonic patterns, but the Bat completes at 88.6% of XA while the Gartley completes at 78.6%, and the Bat’s B point must stay inside 50% of XA while the Gartley allows up to 61.8%. The deeper completion gives the Bat a smaller stop and usually better reward-to-risk, but it also fails harder when X breaks.
What timeframe works best for the Bat pattern on a prop firm account?
H1 for entries with H4 for trend context is the sweet spot I use. Below M15, spread and noise eat the small stop alive; on the daily chart, completions are so rare that you cannot build a meaningful sample, and the stop distances get large enough to break the 0.5% risk rule.
How much should I risk on a Bat pattern trade?
I risk 0.5% of the account per Bat, which is $500 on a $100,000 account, and I stop after two losing Bats in a day. That keeps any single day to 1% of the account and 20% of a 5% daily loss limit, which is the buffer that lets a losing week stay a losing week instead of a blown account.
Does the Bat pattern work on gold and indices as well as forex?
The geometry is the same on any liquid market, but I trade it on EURUSD and GBPUSD only, because the stop is small and wide spreads on gold or indices during volatile sessions can turn a 38-pip stop into a 60-pip loss. If you take it elsewhere, widen the buffer beyond X and re-run the sizing maths first.
What invalidates a Bat pattern after I enter?
A candle close beyond X. That is the single invalidation rule. Wicks poking past X that close back inside are noise and do not cancel the pattern, which is why the stop sits 10 pips beyond X rather than exactly on it.
How many Bat patterns appear in a typical week?
On EURUSD and GBPUSD H1 charts, expect a handful of genuine completions per week, not dozens. Most shapes that look like Bats fail at least one of the five checks. That scarcity is a feature: it keeps you from overtrading, and it means every Bat you do take has passed a real filter.
Risk disclaimer: Trading leveraged forex on a funded account can lose money fast, and past pattern results never guarantee future ones. The numbers in this article come from my own demo trading and are shown to explain the maths, not to promise results. Never risk money you cannot afford to lose, and check your firm’s rules before trading any pattern live.




3 comments
[…] every point has a number, so either all four ratios hold or the pattern is skipped. My guide to the Bat pattern covers the closest relative, and the contrast matters: the Bat completes at 88.6% of X to A with […]
[…] Bat […]
[…] Bat […]