I bought the breakout, and the market fined me 500 dollars for it. The chart was EURUSD on the hourly timeframe. Price had climbed from 1.0800 to 1.1000, pulled back to 1.0900, and then pushed to a fresh high at 1.1030. A higher high after a pullback is the oldest breakout trigger in the book, so I bought at 1.1035 with a 50-pip stop at 1.0985. Within a day price had slid all the way back to 1.0800, my stop was long gone, and then — this is the part that stayed with me — price turned and rallied all the way back to 1.1030 without me. I had bought the top of a pattern I did not know existed, and I had sold, via my stop, almost exactly at the bottom of it. The pattern was a shark. Its second high was never a breakout. It was the fin: a leg that deliberately extends beyond the first high, traps the breakout buyers, and then corrects so deeply that the real trade is the bounce off the bottom, not the break at the top.
In this article
- What the shark pattern actually is
- The five points, in order
- The three Fibonacci checks that confirm a shark
- How the shark differs from every other harmonic on this site
- My funded settings for the shark
- The worked trade, from C to both targets
- Sizing the shark under a 500-dollar daily cap
- When the shark fails
- My daily shark routine
- Frequently asked questions
The shark is the last harmonic in this series for a reason. It is the only one whose middle leg breaks its own boundary on purpose, the only one with five points instead of four legs ending in a D, and the only one whose completion point sits all the way back where the pattern started. Once you can spot it, a whole class of losing breakout trades disappears from your journal, because you stop buying fins.
What the shark pattern actually is
The shark is a harmonic reversal pattern first described by Scott Carney in 2011, built on the same Fibonacci tradition as the Gartley pattern. It has five points, labelled 0, X, A, B and C, and it completes at C — there is no D leg, which already separates it from every other harmonic covered on this site. It is also described as an updated 5-0 pattern, and that lineage matters: the shark is the setup that forms before a 5-0 completes, so a trader who knows the shark gets the earlier entry of the pair.
The shape is what gives it the name. Price makes an impulse, a pullback, a second impulse that pushes beyond the first extreme, and then a deep correction that looks like an open jaw. On a bullish shark the sequence rises, dips, rises higher, and then falls hard. On a bearish shark it mirrors exactly. The trap is structural: the B leg makes a new extreme, so breakout traders buy it, and the C leg then retraces so far that their stops are taken before the reversal they were positioned for actually begins.
For a funded trader the shark is attractive for one cold reason: the completion point is deep, so the distance from C back to the first target is large relative to a stop placed just beyond C. That is a payoff shape a daily loss limit loves, provided you wait for C instead of chasing B.
The five points, in order
Every shark starts at 0 and is drawn in strict order. Skipping a point, or labelling them after the fact to fit a trade you already want, is how fake sharks get traded. Here is the bullish sequence, with the EURUSD example that runs through this article.
| Point | EURUSD level | What happens there |
|---|---|---|
| 0 | 1.0800 | The pattern starts here, at a swing low |
| X | 1.1000 | First impulse up, 200 pips from 0 |
| A | 1.0900 | Pullback, 100 pips down from X |
| B | 1.1030 | Second impulse up, beyond X by 30 pips |
| C | 1.0800 | Deep correction, back to the 0 level |
Notice two things before any Fibonacci is drawn. First, B at 1.1030 is higher than X at 1.1000: the fin sticks out past the first high. Second, C at 1.0800 returns exactly to the 0 level. A correction that deep looks like a trend change to most traders, which is precisely why the bounce off C is so often left untraded. The bearish shark is the mirror: 0 at a swing high, X at a lower low, A a pullback up, B a new low beyond X, and C a deep rally back toward 0.
The three Fibonacci checks that confirm a shark
A shark is not a shape, it is three measurements, and all three must pass. I check them in this order, and if any one fails I delete the drawing and move on. The levels below are the ones Carney specified, and they are the same checks used in the worked example.
| Check | Fibonacci grid | Required range | This example | Pass |
|---|---|---|---|---|
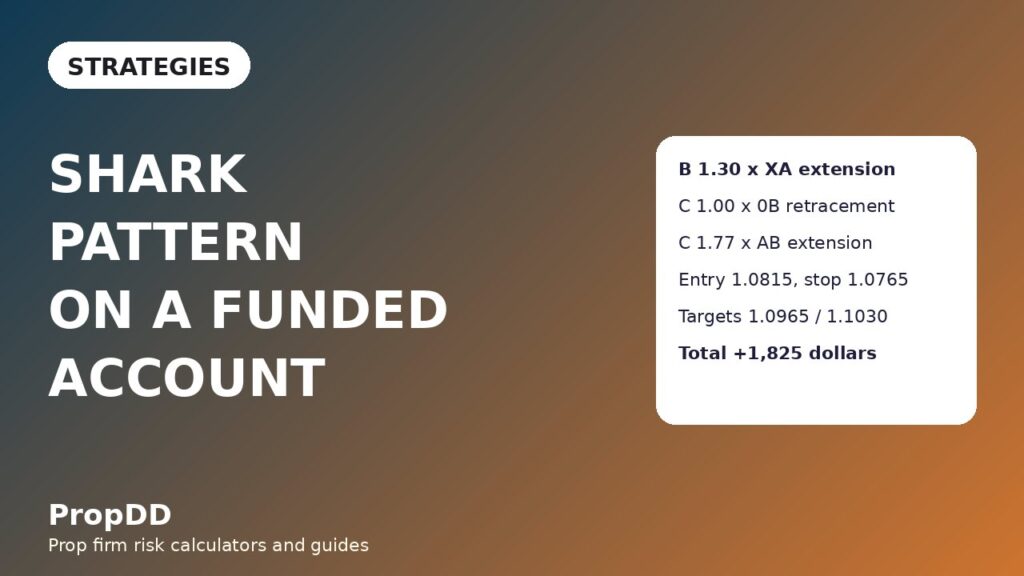
| 1. B extension | X to A | B at 1.13 to 1.618 of XA | XA is 100 pips, B sits 130 pips above A, so 1.30 | Yes |
| 2. C retracement | 0 to B | C at 0.886 to 1.13 of 0B | 0B is 230 pips, C sits 230 pips below B, so 1.00 | Yes |
| 3. C extension | A to B | C at 1.618 to 2.24 of AB | AB is 130 pips, C sits 230 pips below B, so 1.77 | Yes |
The first check is the one most traders skip, and it is the one that defines the pattern: B must extend 1.13 to 1.618 times the XA leg. If B merely reaches X, or stops inside it, you do not have a shark, you have a double top in the making. The second and third checks both measure C, and both must hold; C is the point you will actually trade, so it gets two confirmations while B gets one. In my example all three land comfortably inside their bands rather than on the edges, which is my personal preference: a shark that only passes on a boundary is a shark I trade at half size or not at all.
How the shark differs from every other harmonic on this site
This site now carries a full harmonic shelf, and the shark earns its place only because it is genuinely different from each neighbour. The table below is the differentiation I checked before writing, because a shark article that restates the crab or the butterfly would be a duplicate in everything but name.
| Pattern | Completion point | What makes it different from the shark |
|---|---|---|
| Gartley | D at 78.6 percent of XA, inside X | Its B leg stays inside X; the shark’s B deliberately breaks beyond X |
| Bat | D at 88.6 percent of XA, inside X | Deepest inside retracement of the family, but still no extension beyond X |
| Cypher | D at 78.6 percent of XC | Built on an XC structure with a small C; the shark has no D at all |
| Butterfly | D at 127.2 percent of XA | Extends beyond X like the shark, but completes at D with B at 78.6 percent |
| Crab | D at 161.8 percent of XA | The deepest extension of the family, with a 261.8 to 361.8 percent BC projection |
| ABCD | D, equal AB and CD legs | No extension leg and no five-point structure at all |
| Shark | C, no D leg | Five points only; B extends 1.13 to 1.618 of XA; C returns to near 0 |
The practical consequence is timing. Gartley, bat, cypher, butterfly and crab traders all wait for a D leg that the shark never produces. A shark trader who waits for D will watch the reversal happen without them, and a D-pattern trader who trades every shark as a butterfly will enter at the wrong ratios. Knowing which family member is on the chart decides the entry, the stop and both targets.
My funded settings for the shark
The shark is a higher-timeframe pattern. I trade it on H1 and H4 only, never below M15, because on small timeframes the B extension and the C correction both occur so often that the checks pass by accident. I take at most two sharks per day, and I never take a shark whose C leg is still forming: the entry comes on the bounce off C, confirmed by a close back in the direction of the reversal, never on the first touch of a Fibonacci level.
| Setting | My funded rule | Why it exists |
|---|---|---|
| Timeframe | H1 and H4 only | Below M15 the checks pass by accident and stops are noise |
| Session | London and New York overlap preferred | C bounces need real liquidity to hold |
| Entry | On the bounce off C, after a confirming close | Entering on first touch buys falling knives at C |
| Stop | Beyond C, never beyond B | C is the invalidation point; B is far too wide for a daily cap |
| Target 1 | 50 percent of the A to B distance | The standard shark first target, banks half the position |
| Target 2 | Point B | The full retracement of the C leg back to the fin |
| Daily cap | 500 dollars, one shark loss maximum per day | A shark stop is wide; two losses would eat the day |
Two rules in that table do most of the risk work. The stop goes beyond C, not beyond B, because C is the point the pattern must defend: if price trades through C, the shark is broken and there is no pattern left to hold for. And the daily cap is one shark loss, because a 50-pip shark stop at full size is already 10 percent of a 5,000-dollar daily limit, and a second loss on the same structure usually means I am forcing the pattern rather than reading it.
The worked trade, from C to both targets
Here is the same EURUSD shark traded properly, using the points from the table above. The entry waits for the bounce: price touches C at 1.0800, closes back above it, and I buy at 1.0815. The stop goes 35 pips below C at 1.0765, which is 50 pips below the entry. The sizing formula is the one this series always uses, and I run it through the max daily drawdown calculator before every trade so the arithmetic is never done in my head under pressure.
| Step | Level | Maths |
|---|---|---|
| Entry (buy, on C bounce) | 1.0815 | 15 pips above C at 1.0800 |
| Stop loss | 1.0765 | 50 pips below entry, 35 pips below C |
| Position size | 1.00 lot | 500 divided by (50 times 10) = 1.00 lot |
| Risk | 500 dollars | 1.00 lot times 50 pips times 10 dollars = 500 dollars |
| Target 1 (50 percent of A to B) | 1.0965 | Half of A 1.0900 to B 1.1030; 150 pips from entry |
| Target 1 banked | +750 dollars | 0.50 lots times 150 pips times 10 dollars |
| Target 2 (point B) | 1.1030 | 215 pips from entry |
| Target 2 banked | +1,075 dollars | 0.50 lots times 215 pips times 10 dollars |
| Total if both targets hit | +1,825 dollars | 750 plus 1,075 = 1,825 dollars, or 3.65R on 500 dollars risk |
That 3.65R payoff is the shark’s real edge and its real danger in equal measure. It is large because C sits so deep: the market has to travel 215 pips just to return to B. But a payoff that large also tempts traders to widen stops, add to losers, or hold through target 1 hoping for target 2 on every trade. My rule is mechanical: half off at target 1, always, and the rest runs to B or to breakeven, whichever comes first. The half-banked rule is what keeps a 3.65R pattern from turning into a breakeven-or-bust habit.
Sizing the shark under a 500-dollar daily cap
Shark stops are wider than pullback stops because C sits far from the entry, so the sizing grid matters more here than on most patterns in this series. The formula never changes: lots equal 500 divided by stop distance in pips times 10 dollars per pip per lot, rounded down. I check every row against the consistency rule calculator as well, because a single 1,825-dollar shark winner can dominate a payout window if the rest of the week is quiet.
| Stop distance | Size at 500 dollars risk | Actual risk after rounding down |
|---|---|---|
| 40 pips | 1.25 lots | 500 dollars |
| 50 pips | 1.00 lot | 500 dollars |
| 60 pips | 0.83 lots | 498 dollars |
| 80 pips | 0.62 lots | 496 dollars |
| 100 pips | 0.50 lots | 500 dollars |
| 120 pips | 0.41 lots | 492 dollars |
The row I actually trade most is the 50-pip row, because a stop 35 pips beyond C covers the usual overshoot without paying for the whole C leg twice. Stops wider than 100 pips are a skip for me on a funded account: the size shrinks so far that even a full-target winner barely moves the payout maths, and a wide stop usually means I mislabelled C in the first place.
When the shark fails
Sharks fail in four repeatable ways, and three of them are my fault, not the market’s. The first is buying B: every breakout buy at a fresh extreme beyond X is a shark entry in disguise, and it loses exactly the way my story trade lost. The second is entering C before it completes, catching a correction that still has one more leg down to a lower C. The third is accepting a B extension outside 1.13 to 1.618 because the shape looks right; a B at 1.05 or 1.80 is not a shark with loose ratios, it is a different structure wearing a shark’s outline. The fourth is genuine: price bounces off C, takes target 1, and then falls back through C, stopping the runner at breakeven. That outcome is not a failure of the pattern, it is the pattern paying half its value, and it is why target 1 is never skipped.
The failure I watch most carefully is the overlap with double tops and bottoms. A bullish shark’s B leg looks like the second top of a double top, and a trader who only checks the two highs will short it as a double top, place a stop above B, and get stopped when the C leg extends further than a double-top neckline would allow. The Fibonacci checks are the separator: a double top has no 1.13 to 1.618 B rule and no 1.77 C extension, so when both checks pass, I trade the shark rules, not the double-top rules.
My daily shark routine
Sharks are rare enough that scanning for them takes ten minutes, and the routine below keeps the scan honest. I run it once in the London morning and once before New York, and I do not add a third scan, because a third scan is usually just an excuse to find a shark that is not there.
| Time | Action | Rule enforced |
|---|---|---|
| London open | Scan H1 and H4 for a completed 0-X-A-B sequence | No B, no shark: do not project C early |
| Mid-morning | Run all three Fibonacci checks on any candidate | Any failed check deletes the drawing |
| Before New York | Watch C candidates only; wait for the bounce close | No entry on first touch of a level |
| On entry | Size from the grid, set stop beyond C, set both targets | Half off at target 1, no exceptions |
| End of day | Log the shark, its checks, and whether B trapped anyone | One shark loss per day, then stop |
The log line matters more than it looks. Sharks that trap breakout buyers leave a signature in the journal: a fast B extension, a deep C, and a bounce that recovers B within a day or two. After a few logged examples I started recognising the fin while B was still forming, which is the only point in the pattern where recognising it actually saves money, because it stops the breakout buy before it happens.
Frequently asked questions
Is the shark pattern the same as a 5-0 pattern?
No, but they are related. The shark is the earlier structure: it completes at C, while the 5-0 completes later at its own D point after a 50 percent retracement of the B to C leg. Traders who know both get two entries from one formation, but the shark entry at C comes first and carries its own stop beyond C, so the two trades must be sized separately and never averaged together.
Why does the shark pattern have five points instead of four legs ending in D?
Because Carney defined it that way in 2011: the pattern is 0, X, A, B and C, and C is the completion point. The other harmonics on this site end in D because their final leg is a retracement back inside the pattern. The shark’s final leg is an extension to C, so there is nothing left to label D, and waiting for one means missing the trade.
Can I trade the shark on M15 or lower timeframes?
I do not, and I would not on a funded account. Below M15 the B extension and the deep C correction occur constantly by noise alone, so the three Fibonacci checks pass by accident. The pattern needs H1 or H4 structure to mean anything, and the stop distances on small timeframes make the sizing maths pointless under a daily loss limit.
What happens if B extends beyond 1.618 of XA?
Then it is not a shark. A B extension above 1.618 breaks the first check, and trading it as a shark anyway is how traders buy the top of a genuine trend extension. Delete the drawing and look for a different structure: a B that far beyond X is usually a trend leg, not a fin.
Should the stop go beyond B instead of beyond C?
No. C is the invalidation point of the shark: if price trades through C, the pattern has failed and there is no reason to stay in the trade. A stop beyond B would be hundreds of pips wide on most sharks, which breaks the daily loss limit at any sensible size and turns one failed pattern into a day-ending loss.
How is the shark different from simply buying a dip?
A dip buy has no entry rule beyond price falling, while a shark entry requires all three Fibonacci checks, a completed C, and a bounce confirmation close. That discipline is the whole edge: most dips that look buyable are just the first half of a deeper C leg, and the checks are what keep you out of them until C is actually complete.
Risk disclaimer: this article describes my own funded-account trading for education only and is not financial advice. Harmonic patterns fail, stops are hit, and past results do not guarantee future outcomes. Never risk more than your prop firm’s daily loss limit allows on a single pattern.


