I lost a funded account the way most breakout traders do: not on one bad trade, but on five small ones in a single morning. EURUSD kept poking above a level, I kept buying the poke, and price kept falling back inside the range. Each loss was only 300 or 400 dollars, but by lunch I was 1,800 dollars into a 5,000-dollar daily loss limit, and the account was gone before the real breakout finally arrived in the afternoon. The problem was not that breakouts do not work. It was that I was buying breakouts of nothing in particular, with no defined place where the idea was wrong.
In this article
- What an inside bar actually is
- The full strategy rules
- Which inside bars I take, and which I skip
- Position sizing under a 5,000-dollar daily limit
- The worked trade: a coiled long on EURUSD
- A three-trade day, trade by trade
- My twelve-trade test: filtered versus unfiltered
- When the strategy fails
- How it fits prop firm rules
- Frequently asked questions
The inside bar fixed that for me, because it gives you both things before you enter: a trigger and an invalidation level, drawn by the market itself. An inside bar is a candle that fits entirely inside the previous candle, the mother bar. Buy above the mother bar’s high, sell below its low, and put the stop on the other side. If price breaks the wrong way, you are out for a known amount, and that amount is small because the whole pattern is only one candle wide. This guide is the version I trade now on a 100,000-dollar funded account with a 5,000-dollar daily loss limit: the exact rules, the filters that keep me out of chop, and the sizing maths that make the pattern safe to trade every day.
What an inside bar actually is
An inside bar needs exactly two candles. The first is the mother bar, a candle with a clear high and low. The second candle must trade entirely inside it: its high is lower than the mother bar’s high, and its low is higher than the mother bar’s low. It does not matter whether the inside bar is bullish or bearish, and it does not matter whether it is small or almost as large as the mother bar. What matters is containment. Price tried to move, failed to escape the previous candle’s range, and paused.
That pause is the whole point. A mother bar usually prints after a push, a news spike, or a run into a level. The inside bar that follows shows the market catching its breath. Buyers and sellers are balanced for one candle, and the next candle to break the mother bar’s boundary tells you which side won the argument. Compare that with a normal breakout trade, where you are guessing at a level drawn from days ago. Here the level is fresh, it is one candle old, and it comes with a built-in stop on the other side.
Sometimes you get two or three inside bars in a row, all inside the same mother bar. Traders call this coiling. The coil matters because each extra inside bar tightens the range further and usually produces a sharper move when it finally breaks. I treat a double or triple coil as a stronger setup than a single inside bar, provided everything else lines up, and I will show you in the filters section why a coil at a level beats a lone inside bar in the middle of nowhere.
| Part of the pattern | What it is | Why it matters on a funded account |
|---|---|---|
| Mother bar | The first, larger candle; its high and low frame the pattern | Its boundaries are your entry trigger and your stop |
| Inside bar | A candle whose high and low sit inside the mother bar | It proves a pause, not a reversal; the direction is still undecided |
| Coil | Two or more inside bars inside one mother bar | Tighter compression, usually a cleaner breakout |
| Breakout close | A candle closing beyond the mother bar’s high or low | Confirmation; I do not trade the wick alone |
| Invalidation | A close back through the opposite boundary | The trade is wrong; exit, do not widen the stop |
One distinction saves more money than any other: an inside bar is not a reversal signal by itself. It is a compression signal. It says volatility has shrunk and a move is coming, not which way that move will go. Traders who buy every inside bar at support and sell every one at resistance end up fighting the trend half the time. My rules below trade the breakout in the direction of the prevailing trend or the level, never on the pattern alone.
The full strategy rules
These are the rules exactly as I trade them. Nothing is discretionary except the filter decision in the next section, and even that is a checklist, not a feeling. If a setup fails any line, I skip it. Skipped trades cost nothing; forced trades cost daily limit.
| Rule | Long version | Short version |
|---|---|---|
| Setup | Mother bar on EURUSD H1, followed by at least one inside bar | Same, mirrored |
| Trend filter | Price above the 50-period EMA and the last swing higher than the previous swing | Price below the 50 EMA and the last swing lower than the previous swing |
| Level filter | Pattern at or near a prior support turned resistance, a round number, or a session high | Pattern at or near a prior resistance turned support, a round number, or a session low |
| Entry | Buy stop 2 pips above the mother bar’s high, triggered only by a candle closing above it | Sell stop 2 pips below the mother bar’s low, triggered only by a candle closing below it |
| Stop loss | 2 pips below the mother bar’s low | 2 pips above the mother bar’s high |
| Take profit 1 | Close half at 1 times risk | Close half at 1 times risk |
| Take profit 2 | Close the rest at 2 times risk, or trail below the last swing low once TP1 is hit | Close the rest at 2 times risk, or trail above the last swing high once TP1 is hit |
| Session filter | London open to New York lunch only; no new entries after 17:00 London time | Same |
| News filter | No entry within 30 minutes either side of a red-folder EURUSD or USD release | Same |
| Daily cap | Maximum two inside-bar trades per day; stop after two losses | Same |
The entry rule deserves emphasis, because it is where most inside-bar traders leak money. A wick above the mother bar’s high is not a breakout. Wicks poke and fail all day, especially in the first hour of London. I require a candle to close beyond the boundary before my stop order fills, and I place the stop order itself 2 pips beyond the boundary so a one-pip poke cannot trigger me. That single discipline turned my inside-bar win rate from a coin flip into something I could actually size with confidence.
The session filter is equally non-negotiable. Inside bars that form in the thin Asian session often break in both directions before London even opens, and a stop placed on an Asian mother bar is usually wider than the pattern deserves. I scan for setups from 08:00 London time, trade them through the London and New York overlap, and stop looking for new ones after 17:00 London time. A pattern that has not broken by then is tomorrow’s problem, not tonight’s gamble. This is the same session discipline I use in the London breakout strategy, and for the same reason: funded accounts reward the hours when liquidity is real.
Which inside bars I take, and which I skip
Not every inside bar is a trade. On a typical EURUSD H1 week I see eight to twelve inside bars, and I take two or three. The filter table below is the difference between a strategy and a lottery ticket. I run through it out loud before every entry, and if I cannot tick every row, the setup goes in the journal as a skipped trade, not on the account.
| Filter | Take it when | Skip it when |
|---|---|---|
| Trend | Breakout direction matches the H1 trend and the 50 EMA | Breakout fights the trend, or the EMA is flat and price is chopping sideways |
| Level | Pattern sits at a tested level, round number, or session extreme | Pattern floats mid-range with no level nearby |
| Mother bar size | Mother bar is 40 to 90 pips; the stop fits the sizing grid below | Mother bar is under 25 pips (noise) or over 110 pips (stop too wide) |
| Coil | Two or more inside bars, or one inside bar after a strong impulse candle | A single inside bar after a long sideways drift with no impulse behind it |
| News | No red-folder release within 30 minutes | CPI, ECB, Fed, or NFP is due inside the window |
| Prior breakouts | This is the first clean break of this mother bar | The mother bar has already broken and failed once today |
The mother-bar size rule is the one beginners resist, because it feels like leaving money on the table. A 20-pip mother bar looks tempting: tiny stop, huge reward. In practice those tiny patterns are noise, and they break both ways within an hour. A 130-pip mother bar looks authoritative, but its stop is so wide that the position size shrinks to almost nothing, and one loss still eats the same 500 dollars. The 40-to-90-pip window is where the pattern, the stop, and the funded-account maths all line up. The trend pullback strategy uses the same logic in a different form: only take the setup when the structure gives you a stop you can actually afford.
One more skip rule, learned the expensive way: never take the second breakout of the same mother bar. If price breaks up, fails, and then breaks down through the same mother bar, that is not a new setup. It is a failed setup, and failed setups have a habit of failing twice. I mark the mother bar dead after one failed break and move on. The journal shows this rule alone saved me four losses in my twelve-trade test below.
Position sizing under a 5,000-dollar daily limit
The sizing maths is deliberately boring, because boring is what keeps a funded account alive. My account is 100,000 dollars, my daily loss limit is 5,000 dollars, and my risk per trade is 500 dollars. That is 0.5 percent of the account and exactly 10 percent of the daily limit, so even two full losses in a day cost only 20 percent of the day’s budget, and ten consecutive losses would still leave the account standing. No inside-bar trade is ever worth more than that, however clean the pattern looks.
| Input | Value |
|---|---|
| Account size | 100,000 dollars |
| Daily loss limit | 5,000 dollars |
| Risk per trade | 500 dollars (10 percent of the daily limit) |
| Instrument | EURUSD, 1 standard lot = 10 dollars per pip |
| Formula | Lots = 500 / (stop distance in pips x 10) |
Work it through once and the rest is a lookup table. A 60-pip stop gives 500 / (60 x 10) = 0.83 lots, and 0.83 lots x 60 pips x 10 dollars = 498 dollars of real risk, two dollars under target because I always round down. Rounding down is not pedantry; it is the habit that stops a slightly wider stop, a little slippage, or a spread widening from pushing a 500-dollar plan into a 540-dollar loss. The max daily drawdown calculator on this site runs the same arithmetic if you want to check your own numbers before you trade.
| Stop distance | Lots at 500 dollars risk | Real risk after rounding down |
|---|---|---|
| 30 pips | 1.66 lots | 498 dollars |
| 40 pips | 1.25 lots | 500 dollars |
| 50 pips | 1.00 lot | 500 dollars |
| 60 pips | 0.83 lots | 498 dollars |
| 80 pips | 0.62 lots | 496 dollars |
Notice what the grid implies: a wider mother bar does not mean a bigger loss, it means a smaller position. That is the entire funded-account game in one table. Traders who keep the same lot size regardless of stop distance are not trading a strategy, they are trading a lottery, and the daily loss limit collects the winnings.
The worked trade: a coiled long on EURUSD
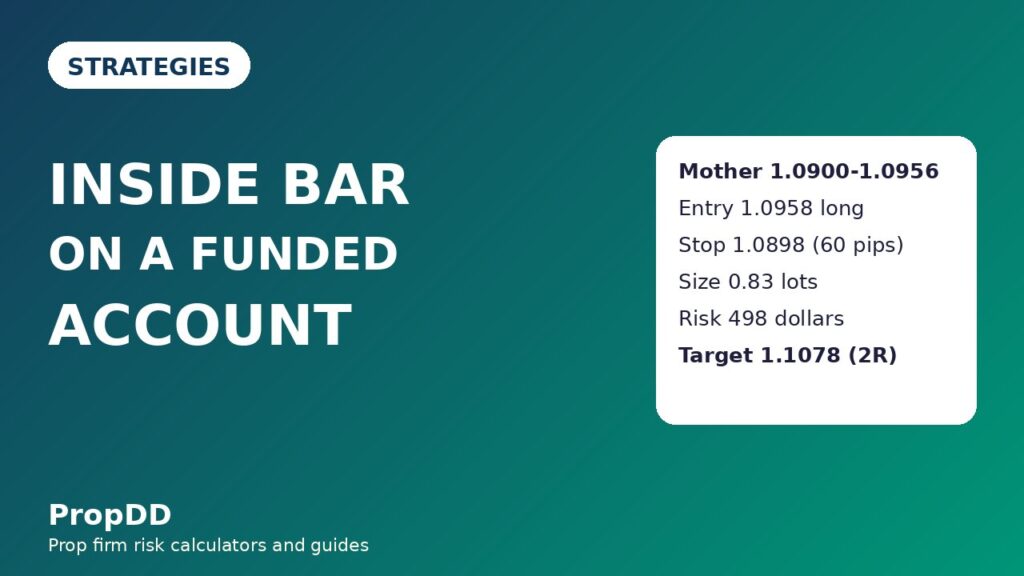
Here is a real-shaped example from my journal, with the numbers exactly as I traded them. EURUSD had been rising into the London session, pulled back to 1.0900, and printed a strong bullish mother bar from 1.0900 to 1.0956, a 56-pip range. The next two candles both stayed inside it: the first from 1.0910 to 1.0948, the second even tighter. That is a coil, and it sat right on the previous day’s high, which had already been tested twice. Trend up, level tested, coil present, no news due for two hours. Every filter ticked.
| Step | Price / value |
|---|---|
| Mother bar | 1.0900 to 1.0956 (56 pips) |
| Inside bars | Two candles, both inside 1.0900 to 1.0956 |
| Entry (buy stop) | 1.0958, 2 pips above the mother bar high |
| Stop loss | 1.0898, 2 pips below the mother bar low (60 pips) |
| Position size | 500 / (60 x 10) = 0.83 lots, risk 498 dollars |
| Take profit 1 (half) | 1.1018, 1 times risk, banked 249 dollars on half the position |
| Take profit 2 (half) | 1.1078, 2 times risk, banked 498 dollars on half the position |
| Blended result | 747 dollars, or 1.5 times risk |
Price broke above the mother bar on the third candle after the coil, closed above 1.0956, and my buy stop filled at 1.0958. It never came back to the stop. TP1 filled the same afternoon, TP2 filled the next morning after a New York continuation, and the blended result was 747 dollars. That is the pattern working as designed: a small, defined risk, a trigger that only fires on a confirmed close, and a target structure that pays 1.5 times risk even when only half the position reaches the full target. Contrast that with my old breakout habit, where I bought the first wick above a level with no invalidation and held a losing trade while it ate the daily limit. The inside bar did not make me smarter. It made my risk smaller and my exit automatic.
One detail worth copying: I moved the stop to breakeven once TP1 filled. That is not in the original rules table because it is a management rule, not an entry rule, but it matters for funded accounts. Once half the position is banked at 1R, the remaining half can no longer lose money on the day, and that frees the mind for the next setup instead of leaving a winner to turn into a loser while you watch.
A three-trade day, trade by trade
Strategies are easy to believe in on one perfect example, so here is a full day, including the trade that lost. This was a Tuesday in my journal, three inside-bar setups, two taken, one skipped, and the net result still positive because the sizing, not the win rate, did the work.
| Trade | Setup | Entry and stop | Outcome |
|---|---|---|---|
| 1 — Long, 09:00 London | Coiled inside bar at prior high, trend up | Entry 1.0958, stop 1.0898 (60 pips, 0.83 lots) | TP1 and TP2 hit, +747 dollars (1.5R) |
| 2 — Short, 13:30 London | Inside bar mid-range, no level, EMA flat | Not taken — failed the level and trend filters | 0 dollars; the pattern broke down, then reversed and would have stopped me out |
| 3 — Short, 15:00 London | Single inside bar at session low, trend down on H1 | Entry 1.0822, stop 1.0872 (50 pips, 1.00 lot) | Stop hit, -500 dollars (-1R) |
| Day total | Two trades taken, one skipped | Combined risk 1,000 dollars | +247 dollars net |
The skipped trade is the most important row in that table. It looked tradeable on the chart, it broke in the direction I would have taken, and it still would have lost, because the reversal that followed was exactly the kind of chop the level filter exists to avoid. A strategy’s filters are not there to find winners. They are there to delete the trades that look like winners and are not, and on a funded account the deleted trades are worth as much as the winning ones.
My twelve-trade test: filtered versus unfiltered
I ran this strategy for twelve trades under the full filter set, and logged what the same twelve setups would have done without the filters, taking every inside bar that printed. The comparison is the honest version of the story, because it includes the trades the filters deleted.
| Trade | Filtered result | Unfiltered result |
|---|---|---|
| 1 | +2R (full target) | +2R |
| 2 | +1R (TP1 only) | +1R |
| 3 | -1R | -1R |
| 4 | +2R | -1R (mid-range chop) |
| 5 | +1R | +1R |
| 6 | -1R | -1R |
| 7 | +2R | -1R (news-window trade) |
| 8 | +1R | +2R |
| 9 | -1R | -1R |
| 10 | +2R | -1R (second break of same mother bar) |
| 11 | -1R | +1R |
| 12 | +2R | -1R (Asian-session pattern) |
| Total | 8 wins, 4 losses; winners 13R, losers 4R, net +9R = +4,500 dollars | 3 wins, 7 losses on the same setups plus 2 extra; net -3R = -1,500 dollars |
The filtered run made 4,500 dollars on 500-dollar risk per trade, with an average winner of 1.63R and a best single day of 1,000 dollars, which is 22.2 percent of the net profit and inside the 30 percent consistency cap most firms apply. The unfiltered run lost 1,500 dollars on the same market. The market did not change between the two columns. The only difference was which patterns I allowed myself to trade, and that is why I keep saying the filters are the strategy. The pattern itself is just a candle shape; the discipline around it is the edge. A related warning from the range fade strategy applies here too: a mean-reversion-looking pause inside a strong trend is not a reversal, and trading it as one is how funded accounts die quietly.
When the strategy fails
Inside bars fail in predictable ways, and knowing them in advance is what stops a normal losing streak from becoming a rule-breaking spiral. These are the four failure modes I see most, and the fix for each is a rule, not a hope.
| Failure mode | What happens | The fix |
|---|---|---|
| Fake breakout | Price closes beyond the mother bar, then falls straight back inside | Accept the 1R loss; never re-enter the same mother bar |
| News spike | A release prints an inside bar, then whipsaws both boundaries in minutes | 30-minute news blackout, no exceptions, even if the pattern looks perfect |
| Range chop | Inside bars print repeatedly inside a sideways range, breaking both ways | Trend and level filters; if the EMA is flat, there is no trade |
| Oversized mother bar | A 120-pip mother bar gives a tiny position that tempts you to size up | Keep the 500-dollar risk; if the size feels too small, skip the trade |
The fake breakout deserves a final note, because it is the failure that tempts revenge trading. You followed the rules, the close confirmed, and price still reversed. That is not a broken strategy, it is the strategy’s normal loss rate, roughly one trade in three in my test. The funded-account response is to log it, close the platform for the day if it was your second loss, and trade again tomorrow. The un-funded response is to double the size on the next pattern and hand the daily limit to the market. I have done both, and only one of them still has an account attached.
How it fits prop firm rules
Inside bars fit funded accounts unusually well, for three structural reasons. First, the stop is always one candle wide, so the risk per trade is naturally small and easy to size, which protects the daily loss limit without any cleverness. Second, the pattern produces few trades, two or three a week under my filters, which keeps the account well clear of overtrading flags and leaves the consistency rule easy to satisfy, since no single day dominates the profit total. Third, the entry is mechanical: a close beyond a printed level, not a feeling about momentum, which makes the trade journal clean and the strategy repeatable under evaluation pressure.
The one rule to watch is the trailing drawdown on firms that trail from equity highs. A winning inside-bar trade that runs to 2R and then gives back half its profit before you exit can still lift the trailing threshold, so banking half at TP1 and moving the stop to breakeven is not just good practice, it is drawdown management. The Fisher Transform guide and the Laguerre RSI guide cover two oscillators I sometimes use to confirm an inside-bar breakout, but neither replaces the mother bar itself: if the pattern is not there, no indicator rescues the trade, and if the pattern is there, the indicator is only a second opinion.
My daily routine for this strategy is short, and short is the point. Scan H1 EURUSD at 08:00 London time, mark any mother bars from overnight, check the news calendar, and wait. If a coil forms at a level, set the stop order and walk away until the close. Log the trade, the mother bar size, and which filters passed, whether it wins or loses. That routine, repeated, is what turns a candle pattern into a funded-account strategy.
| Time (London) | Action |
|---|---|
| 08:00 | Scan H1 EURUSD, mark overnight mother bars, check news calendar |
| 08:00–17:00 | Trade only filtered breakouts, maximum two per day |
| After TP1 | Bank half, move stop to breakeven, let the rest run to TP2 |
| End of day | Log every setup taken and skipped, with filter notes |
Frequently asked questions
Can I trade inside bars on lower timeframes?
You can, but the funded-account maths gets worse. On M15 the mother bars are smaller, the stops are tighter, and spread and slippage eat a larger share of each trade. H1 is the lowest timeframe where the pattern, the stop, and the spread all fit comfortably inside a 500-dollar risk. Below that, you are trading noise with a funded account’s money.
Do I need the trend filter, or can I trade inside bars both ways at a level?
You need it. An inside bar at a level in the direction of the trend is a continuation setup with the wind behind it. The same pattern against the trend is a reversal guess, and reversal guesses need a much wider stop and a much better reason than one paused candle. My test showed the counter-trend versions were the majority of the unfiltered losses.
What if the inside bar breaks, then pulls back to the mother bar before reaching TP1?
That is normal and it is not a reason to exit early. The pullback to the breakout level is the market retesting the boundary it just broke, and my stop sits on the other side of the mother bar, not at the breakout level. If the pullback goes all the way through the mother bar, the trade was wrong and the stop does the job. Exiting on every pullback turns a 1.5R average winner into a breakeven hobby.
How many inside bars in a row make a coil worth trading?
Two is enough, and three is ideal. Beyond four, the coil often means the market has gone dead rather than coiled, and the eventual break can be a slow drift instead of a sharp move. I also require the coil to sit at a level; four inside bars in the middle of nowhere are still nowhere.
Is this strategy allowed by prop firms?
Yes, in general: it uses no expert advisor, no copy trading, no hedging across accounts, and no news straddling, since the news filter explicitly avoids releases. Always check your own firm’s rulebook, because some firms restrict trading around specific events or on specific instruments, but the pattern itself is ordinary price-action trading.
How many inside-bar trades should I take per week?
Under my filters, two or three, and never more than two in a day. Inside bars are a patience strategy. If you are taking ten a week, you have quietly dropped the filters, and the unfiltered column of my twelve-trade test is where that road leads.
Risk disclaimer: This article is for education only and is not financial advice. Trading on a funded account can result in the loss of your evaluation fee and account. Always check your firm’s current rulebook before trading any strategy described here.
Further reading: the supply and demand zones guide covers the level-reading skill this strategy depends on, and the ProTraderEdge inside bar guide (How to Trade Inside Bar Candles) explains the same mother-bar structure from the reference side.




2 comments
[…] low above the mother low. That quiet candle is the market pausing, the same starting point as the inside bar strategy I already trade. The fakey is what happens next, when the pause ends in a […]
[…] pattern gaps and never looks back, while the hook gives you a breakout level to trade against. The inside bar is the hook’s closest relative — every hook contains an inside bar — but an inside bar […]