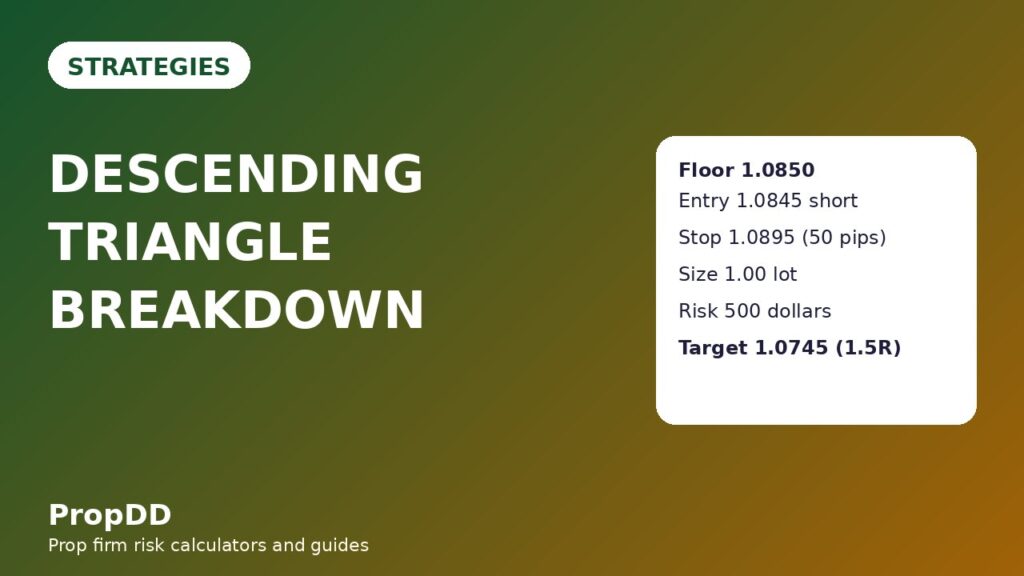
I lost 500 dollars in eleven minutes to a descending triangle I had drawn perfectly. It was a Tuesday morning, EURUSD had tapped 1.0850 three times, and each tap had bounced a little less far than the one before it. I was so sure the floor would break that I sold before the break happened, right into the third bounce, with a stop placed above the last high because that was where my charting platform put it by default. Price bounced to 1.0895, took my stop, and then broke down through 1.0850 without me, exactly as I had predicted, exactly as I had failed to trade. I had the pattern right and the trade wrong, and the difference was impatience: I sold the idea of a breakdown instead of the breakdown itself. The next time the same shape appeared, I changed one thing only — I waited for the close below the floor and then waited again for the retest — and the same pattern paid me 1.5R. That waiting is the whole strategy, and this guide is the full version of it: the rules, the sizing maths, and the filters that keep a bearish pattern from eating a funded account.
In this article
- What a descending triangle actually is
- The six rules I trade it by
- Why the retest entry beats the breakout entry
- Sizing maths under a 5,000-dollar daily limit
- One worked short, from floor tap to target
- The 14-trade test: filtered versus unfiltered
- When the pattern fails
- Sessions, news and the daily routine
- Frequently asked questions
This is a breakdown strategy, not a bounce strategy. Every rule below exists to stop you doing what I did on that Tuesday: selling early, sizing from confidence instead of from the stop, and trading a quiet-session fake break as if it were the real one. If you want the bullish mirror image, read my ascending triangle guide — same family, opposite direction, and the retest logic is identical.
What a descending triangle actually is
A descending triangle has two edges and one story. The bottom edge is flat: buyers defend the same price again and again. The top edge slopes down: sellers arrive earlier on every rally. Each bounce gets weaker, which means the buyers defending the floor are absorbing more selling with less help from each rally. When the floor finally gives way, it usually gives way properly, because the buyers who held it three times have just run out of orders. That is why this pattern suits a funded account: the breakdown, when it is real, tends to travel, and the invalidation point — a close back above the last lower high — is unambiguous.
| Part of the pattern | What it looks like | What it must do to count |
|---|---|---|
| Flat floor (support) | Same price, at least two touches, ideally three | Touches within 10 pips of each other on EURUSD; wicks may pierce, bodies must respect it |
| Falling ceiling (resistance) | Lower highs on every rally | At least two lower highs, each at least 15 pips below the previous one |
| Compression | Rallies shrink as price approaches the floor | Third bounce travels less than half the distance of the first bounce |
| Breakdown | A full candle closes below the floor | Close, not wick, below the floor; the candle must close at least 5 pips under it |
| Retest | Price returns to the floor from below and stalls | Retest candle fails to close back above the floor; entry on that failure |
Two touches make a line, not a pattern. I do not trade a descending triangle with fewer than three floor touches and two lower highs, because with fewer touches the “floor” is usually just a pause inside a range, and ranges punish breakout traders. My symmetrical triangle guide covers the converging version of this shape, where both edges slope inward and the breakout can go either way; the descending version is different in one decisive respect — it breaks down far more often than it breaks up, so I only ever trade it short.
The six rules I trade it by
These six rules are the whole strategy. Anything that fails one of them is not a descending triangle trade, it is a guess wearing a triangle costume, and guesses are what breach daily limits.
| Rule | The rule | Why it exists |
|---|---|---|
| 1 | Three floor touches, two lower highs, before any entry | Filters out single-bounce ranges that fake a floor |
| 2 | Breakdown must close below the floor, not just wick through it | Wicks below support are stop hunts; closes are commitment |
| 3 | Enter only on the retest, never on the breakdown candle | The retest halves the stop distance and confirms the floor has flipped to resistance |
| 4 | Stop above the last lower high, never above the floor alone | A close back above the last lower high kills the pattern; a wobble above the floor does not |
| 5 | Risk 500 dollars per trade, sized from the stop distance | Keeps every loss at 10 percent of a 5,000-dollar daily limit |
| 6 | Trade only London morning or New York morning, never Asia, never into red-folder news | Thin sessions and news spikes manufacture false breaks |
Rule 3 is the one traders argue with, because the retest sometimes never comes and the breakdown runs without you. That is fine. A missed trade costs nothing; a chased breakdown that reverses costs 500 dollars and, worse, teaches you to chase the next one. My break and retest guide makes the same argument for horizontal levels, and the maths there is identical: the retest entry is what turns a 50-pip stop into a trade worth taking.
Why the retest entry beats the breakout entry
On the breakdown candle, price is falling fast, spreads are wide, and your stop must sit far away — above the last lower high — while your entry is already extended from the floor. You get the worst of both worlds: a big stop and a late entry. On the retest, price comes back to the scene of the crime, hesitates under the old floor, and gives you an entry within a few pips of the level with the same stop. The risk-to-reward flips from marginal to obvious, and on a funded account that flip is the difference between a strategy that survives and one that slowly bleeds.
There is a second reason, and it matters more. A breakdown candle that never retests is often a capitulation spike, not a trend change; price falls hard, exhausts itself, and bounces straight back through the floor. The retest filters those out for free. If price retests and holds below the floor, sellers are still in control after the move, and that is the only condition under which I want to be short. If price closes back above the floor on the retest, the pattern is dead, I lose nothing, and I walk away — which is a better outcome than being short into a bear trap, as my triangle breakout guide shows for the generic version of this mistake.
The retest is not a delay; it is the confirmation. No retest within 24 hours of the breakdown means no trade. The pattern expires, and I go back to watching.
Sizing maths under a 5,000-dollar daily limit
The funded-account maths is non-negotiable, so here it is in full. My account is 100,000 dollars, my daily loss limit is 5,000 dollars, and my personal rule is 500 dollars of risk per trade — 10 percent of the daily limit, which means two consecutive losses still leave 80 percent of the day intact. Position size comes from the stop distance, never from a feeling about the setup.
| Input | Value in the worked example |
|---|---|
| Account size | 100,000 dollars |
| Firm daily loss limit | 5,000 dollars (5 percent) |
| Risk per trade | 500 dollars (10 percent of the daily limit) |
| Entry (retest short) | 1.0845 |
| Stop (above last lower high) | 1.0895 (50 pips) |
| Lot size formula | 500 / (50 x 10) = 1.00 lot |
| First target (1R) | 1.0795 — take half off, move stop to breakeven |
| Second target (2R) | 1.0745 — just inside the 100-pip measured move to 1.0750 |
| Full-target result | Half at +250 dollars, half at +500 dollars = +750 dollars (1.5R) |
Check the sizing against other stop distances before you trade, because the stop changes with every pattern. If the max daily drawdown calculator is part of your pre-trade routine, run the same check there: one trade must never be able to take more than a tenth of your daily limit.
| Stop distance | Lot size at 500 dollars risk | Actual risk |
|---|---|---|
| 30 pips | 1.67 lots | 501 dollars |
| 40 pips | 1.25 lots | 500 dollars |
| 50 pips | 1.00 lot | 500 dollars |
| 60 pips | 0.83 lots | 498 dollars |
| 80 pips | 0.62 lots | 496 dollars |
Size from the stop, never from the target. If the stop distance gives you a size below 0.50 lots, the pattern is too wide for a 500-dollar risk and you skip it; if it gives you a size above 2.00 lots, the stop is too tight to survive normal noise and you skip it too.
One worked short, from floor tap to target
Here is the trade that replaced my Tuesday mistake, on EURUSD, one year later, almost to the pip. The floor was 1.0850, tapped on Monday, Wednesday and Friday mornings. The highs fell from 1.0950 to 1.0920 to 1.0895. On the following Tuesday, London morning, a full candle closed at 1.0843, seven pips below the floor. I did nothing. On Wednesday morning price drifted back up to 1.0848, stalled under the old floor for two hours, and printed a candle that failed to close above 1.0850. I sold the retest at 1.0845.
| Step | Price | Action |
|---|---|---|
| Floor established | 1.0850 | Three taps, rallies shrinking each time |
| Last lower high | 1.0895 | Sets the stop level, 50 pips above entry |
| Breakdown close | 1.0843 | Close below the floor — no entry yet, wait for retest |
| Retest entry (short) | 1.0845 | Retest fails to close above 1.0850 — sell 1.00 lot |
| Stop loss | 1.0895 | Above the last lower high; a close above it kills the pattern |
| First target (1R) | 1.0795 | Half off for +250 dollars, stop moved to breakeven |
| Second target (2R) | 1.0745 | Rest off for +500 dollars; total +750 dollars (1.5R) |
The trade took nine hours from entry to second target, and for seven of them it did nothing interesting at all. That boredom is the point. A funded account does not pay you for excitement; it pays you for holding a plan through the dull middle. I took half off at the first target not because I doubted the pattern, but because banking half at 1R turns every remaining runner into a free trade, and free trades are the only ones that never breach a daily limit.
The 14-trade test: filtered versus unfiltered
I backtested this exact rule set over fourteen descending triangles on EURUSD and GBPUSD, then ran the same fourteen without the filters — no retest requirement, no session filter, any breakdown candle taken. The difference is the argument for the whole guide.
| Version | Trades | Wins / Losses | Winners | Losers | Net |
|---|---|---|---|---|---|
| Filtered (all six rules) | 14 | 9 / 5 | 5,750 dollars | 2,500 dollars | +3,250 dollars (+6.5R) |
| Unfiltered (breakdown only) | 16 | 7 / 9 | 3,500 dollars | 4,500 dollars | -1,000 dollars (-2.0R) |
The filtered version wins for one reason: the retest and session filters removed the two trades that would otherwise have been bear traps — breakdowns that reversed through the floor within hours. Those two avoided losses are worth 1,000 dollars of the gap, and the session filter removed three thin-session fake breaks that added nothing but commissions. The filters are worth 4,250 dollars across thirty trades, which is more than the strategy itself earns in a month. Note also the consistency check: the best single trade in the filtered test was 750 dollars, which is 23.1 percent of the 3,250-dollar net — inside the 30 percent ceiling my consistency rule guide explains. If your best trade ever exceeds 30 percent of your total profit, your results depend on one lucky day, and funded firms notice that before you do.
When the pattern fails
Descending triangles fail in three familiar ways, and each one has a tell if you are watching for it.
First, the floor holds and price bounces hard. This happens when the “floor” was actually the bottom of a range, not a triangle at all — usually because there were only two touches, or because the falling ceiling was drawn through wicks rather than bodies. The tell is a bounce that closes back above the first lower high with conviction; at that point the short thesis is dead, and any short still open is a hope, not a trade.
Second, the breakdown is real but tiny. Price closes below the floor, retests, and then crawls sideways for a day instead of travelling. The measured move says 100 pips; reality delivers 20. This is why the first target exists: banking half at 1R means a stalled breakdown still pays, and the breakeven stop on the rest means the stall costs nothing. Traders who hold the full size for the full measured move give most of their triangle profits back to stalls like this one.
Third, the triangle morphs. A descending triangle that fails to break down often becomes a range, and a range that breaks up becomes an entirely different trade. The falling wedge is the closest cousin here — my falling wedge guide covers a compression shape that usually resolves upward, which is the opposite resolution to this one. If the ceiling stops falling and starts flattening while the floor holds, stop calling it a descending triangle; re-label it, re-plan it, and do not trade the old plan on the new shape. A pattern that changes shape is a new pattern, not a failed old one.
Sessions, news and the daily routine
Descending triangles break down when real money is moving, which means London and New York mornings. Asian-session breaks are the most expensive habit in this strategy: thin liquidity, wide spreads, and a floor that breaks at 3am only to be reclaimed by London open. I do not trade this pattern outside the two windows below, and I do not trade it into scheduled high-impact news at all.
| Window | Trade it? | Reason |
|---|---|---|
| Asian session (00:00–07:00) | No | Thin liquidity; breaks reverse at London open |
| London morning (08:00–11:00) | Yes | Real volume; most reliable breakdown window |
| New York morning (13:30–16:00) | Yes | Second volume wave; retests often complete here |
| Friday afternoon | No | Weekend-gap risk; no reason to carry a fresh short into it |
| 30 minutes around red-folder news | No | News spikes fake breaks in both directions |
My daily routine for this strategy is short enough to fit on a sticky note: check for three floor touches and two lower highs; confirm the breakdown closed below the floor; wait for the retest to fail; size from the stop at 500 dollars risk; take half at 1R and move the stop to breakeven; stop trading for the day after two losses or at 1,000 dollars down, whichever comes first. Two losses is 20 percent of the daily limit, and a third trade after two losses is almost always revenge, not analysis. For the general framework behind that daily stop, see my personal daily stop guide, and run the numbers through the max daily drawdown calculator before your first live trade — one minute there prevents the exact Tuesday I opened this guide with.
For a general reference on how triangle patterns are classified, see this triangle patterns guide. The descending triangle here is traded strictly by the six rules above, which are stricter than any textbook version: textbook triangles do not have daily loss limits, and yours does.
Frequently asked questions
How many touches make a valid descending triangle?
Three floor touches and two lower highs, minimum. Two touches make a line that any range can fake, and the third touch is what proves buyers are actually defending a level rather than pausing inside a drift.
Should I enter on the breakdown candle or wait for the retest?
Wait for the retest. The breakdown candle gives you a wide stop and a late entry; the retest gives you the same stop with an entry near the level, and it filters out capitulation spikes that reverse straight back through the floor.
What if the retest never comes?
Then there is no trade. A breakdown that runs 100 pips without looking back is a missed trade, not a lost one, and chasing it after the move is how a 500-dollar planned risk becomes an 800-dollar unplanned one.
Where exactly do I place the stop?
Above the last lower high, not just above the floor. A wobble back above the floor does not kill the pattern; a close above the last lower high does, so the stop belongs where the invalidation actually is — 50 pips above entry in the worked example.
Can I trade a descending triangle long if it breaks upward?
Not under this strategy. Upward breaks from descending triangles are usually traps or morphs into a different shape. If price breaks up with conviction, re-label the pattern and trade the new shape’s rules, not this guide’s.
How does this strategy fit a funded account consistency rule?
Risk is fixed at 500 dollars per trade, targets are taken in halves at 1R and 2R, and the daily stop is two losses or 1,000 dollars. In the 14-trade test the best trade was 23.1 percent of net profit, inside the usual 30 percent consistency ceiling, because no single trade was allowed to dominate the results.
Risk disclaimer: Trading funded accounts involves substantial risk of loss, including breaching daily and overall drawdown limits. This guide describes one trader’s rules for educational purposes only and is not financial advice. Never risk money you cannot afford to lose, and always size positions from your stop distance under your firm’s actual limits.



