I lost 57 dollars of headroom on a trade that looked perfectly sized, and the loss itself was not the problem. I was trading USDCAD the way I had just traded CADJPY, and I carried the size across without recalculating. On CADJPY a 50-pip stop at 1.55 lots risks 500 dollars, because the pip there is worth 6.45 dollars. On USDCAD the pip is worth 7.19 dollars, so the same 1.55 lots on the same 50-pip stop risks 557 dollars, not 500. Fifty-seven dollars over the cap does not sound like a disaster, but it was the first trade of the day, it came with a second stopped-out trade at the same size, and by lunchtime I had lost 1,114 dollars against a plan that allowed 1,000. That is the whole lesson of this pair: USDCAD is the dollar pair itself, so its pip is earned in Canadian dollars and converted back to dollars by dividing by the pair’s own rate, and a trader who borrows a size from any other pair is trading a number they never calculated. In this guide I set out the pair’s contract facts, the pip-value maths at different USDCAD rates, a worked New York-session trade sized under a 5,000-dollar daily loss limit, a sizing grid for every stop distance I use, the session and news plan, the filter test that shows what happens when you trade this pair around the clock, and the daily routine that keeps it inside funded-account rules. Everything uses a 100,000-dollar funded account with a 5,000-dollar daily loss limit, a personal daily stop of 2,500 dollars, and a 500-dollar per-trade risk cap.
In this article
- What USDCAD actually is, and why oil moves it
- The 7.19-dollar pip, worked from first principles
- The worked trade: buying the New York breakout
- The sizing grid for every stop I use
- The New York session plan, and the news I skip
- What I tested: filtered vs unfiltered
- When USDCAD fails
- My daily USDCAD routine
- Frequently asked questions
USDCAD sits apart from the other pairs I have covered in this series, and the differences are worth stating before the maths. The CADJPY guide covers the same Canadian dollar, but through the yen: its pip is worth a fixed number of yen and the conversion divides by USDJPY, and it trades best in the Tokyo session on Bank of Canada headlines. USDCAD removes the middleman. The dollar is the base currency, the Canadian dollar is the quote currency, and the conversion divides by the USDCAD rate itself, so a stronger US dollar makes every pip cheaper, not more expensive. The EURGBP guide converts its pip by multiplying by GBPUSD, the opposite direction. The EURCHF guide divides like USDCAD does, but by USDCHF, a different pair’s rate. USDCAD is the only pair in the series where the conversion rate and the traded pair are the same number, which makes its pip value move every time the pair itself moves. The general rule behind all of this, that a pip is first earned in the quote currency and only then converted into your account currency, is set out in Pepperstone’s guide to trading USD/CAD.
What USDCAD actually is, and why oil moves it
USDCAD is the US dollar against the Canadian dollar, quoted as how many Canadian dollars one US dollar buys. At 1.3900, one US dollar buys 1.39 Canadian dollars. Its drivers are the cleanest policy story in the majors: the gap between the Federal Reserve and the Bank of Canada, US and Canadian employment and inflation data, risk sentiment, and the price of crude oil, because Canada is a major oil exporter and higher oil prices support the Canadian dollar. When oil rallies, USDCAD tends to fall as the Loonie strengthens; when oil drops, USDCAD tends to rise. That oil link is a gift and a trap. It is a gift because a USDCAD setup confirmed by an oil move in the same direction has a second, independent reason behind it. It is a trap because a trader who watches only the USDCAD chart can be stopped out by an oil inventory report they never checked, on a Wednesday afternoon, in a pair that had done nothing all morning.
| Contract fact | USDCAD detail |
|---|---|
| Pair structure | US dollar base, Canadian dollar quote; the dollar pair itself |
| One pip | 0.0001, the fourth decimal place |
| One standard lot | 100,000 US dollars |
| Pip value per lot | 10 Canadian dollars, converted to dollars by dividing by the USDCAD rate |
| Typical character | Trending on policy gaps, sharpest in the New York session |
| Main drivers | Fed vs Bank of Canada rate gap, US and Canadian data, WTI oil, risk sentiment |
The 7.19-dollar pip, worked from first principles
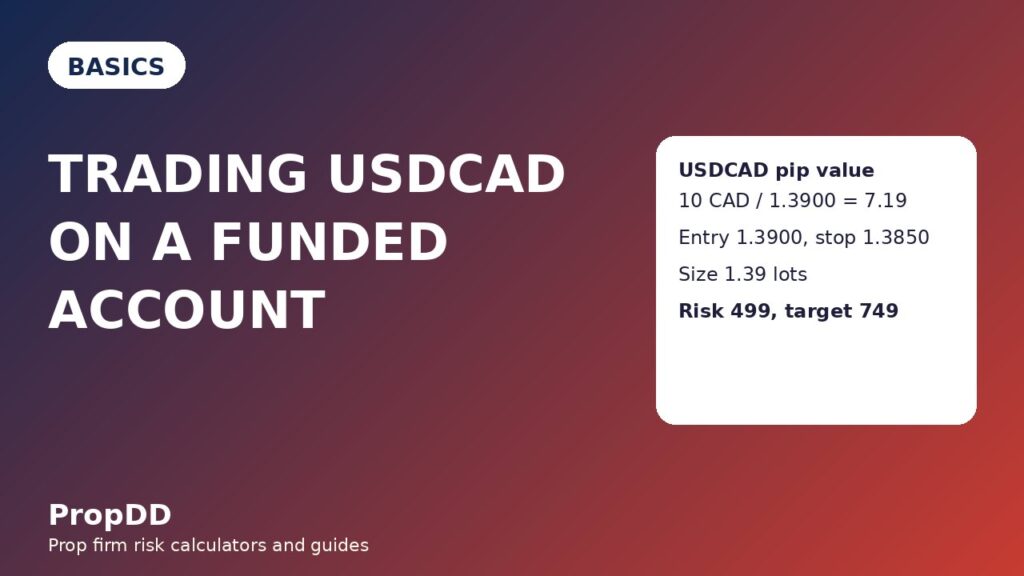
The formula is short, and every mistake on this pair comes from skipping one of its steps. One pip on one standard lot is 0.0001 times 100,000 US dollars, which is 10 Canadian dollars. Ten Canadian dollars converted to dollars at a USDCAD rate of 1.3900 is 10 divided by 1.3900, which is 7.19 dollars. That is the pip value I use for the whole guide, and the formula box below it is the version I keep taped to my monitor: size equals risk divided by stop distance times pip value. At a USDCAD rate of 1.3500 the pip rises to 7.41 dollars, and at 1.4300 it falls to 6.99 dollars, so the same 50-pip stop on one lot costs 370.50 dollars, 359.50 dollars, or 349.50 dollars depending on the week. Note the direction carefully, because it is the opposite of EURGBP: a stronger US dollar, a higher USDCAD rate, makes each pip cheaper in dollars, not more expensive. And note the trap in the other direction: a trader who sizes USDCAD like EURUSD, one lot and a 50-pip stop for 500 dollars, is actually risking only 359.50 dollars, so they feel safe while their winners also pay less than planned, and the temptation is to add size mid-trade to make up the difference, which is how an undersized trade becomes an oversized one. I recalculate the pip value every morning from the live USDCAD rate before I size anything, because a pip value carried over from last month is a position size built on stale maths.
| USDCAD rate | Pip value per lot | One lot, 50-pip stop costs |
|---|---|---|
| 1.3500 | 10 / 1.3500 = 7.41 dollars | 50 x 7.41 = 370.50 dollars |
| 1.3900 | 10 / 1.3900 = 7.19 dollars | 50 x 7.19 = 359.50 dollars |
| 1.4300 | 10 / 1.4300 = 6.99 dollars | 50 x 6.99 = 349.50 dollars |
Formula box: pip value in dollars = 10 Canadian dollars / USDCAD rate. Position size in lots = risk in dollars / (stop distance in pips x pip value in dollars). At USDCAD 1.3900: size = 500 / (stop pips x 7.19).
The worked trade: buying the New York breakout
Here is a real-structure trade with the maths shown end to end. USDCAD has ranged between support at 1.3850 and resistance at 1.3900 for two weeks, oil has slipped for three sessions, and the pair breaks above resistance in the New York morning and pulls back to retest it. I buy at 1.3900, once the retest holds, rather than chasing the breakout candle itself. My stop goes below support at 1.3850, which is 50 pips. Size equals 500 divided by 50 times 7.19, which is 1.39 lots. Risk is 1.39 lots times 50 pips times 7.19 dollars, which is 499.71 dollars, inside the cap. First target is 1.3950, 50 pips above entry: I close half there for 249.85 dollars and move the stop to breakeven. Second target is 1.4000, 100 pips above entry: the rest closes for 499.71 dollars. Total profit is 749.56 dollars, which is 1.5R on 499.71 dollars of risk. If the retest fails instead, the loss is 499.71 dollars and the day still has room, because my personal daily stop is 2,500 dollars, five such losses, and the firm’s daily limit is 5,000 dollars. The trade works because the stop sits where the breakout story is proven wrong, below support, and the targets sit where the pair has room to run, not at round numbers I invented.
| Worked trade step | Number |
|---|---|
| Setup | Two-week range, support 1.3850, resistance 1.3900, oil slipping, New York retest holding |
| Entry | 1.3900 long (retest of broken resistance holds) |
| Stop | 1.3850, 50 pips below entry |
| Pip value | 10 / 1.3900 = 7.19 dollars per lot |
| Size | 500 / (50 x 7.19) = 1.39 lots |
| Risk | 1.39 x 50 x 7.19 = 499.71 dollars |
| Target 1 (half) | 1.3950, +249.85 dollars, stop to breakeven |
| Target 2 (rest) | 1.4000, +499.71 dollars |
| Total | +749.56 dollars = 1.5R |
The sizing grid for every stop I use
Breakouts and range levels give different stop distances depending on where the level sits, so I keep one grid and read the size off it instead of recalculating under pressure. Every row below uses the same 500-dollar cap and the same 7.19-dollar pip, and every size is rounded down, never up, because rounding up is how a 499-dollar risk becomes a 501-dollar risk. A tight 25-pip stop allows 2.78 lots, while a wide 80-pip stop allows only 0.86 lots, and both risk the same 500 dollars. Compare that with the CADJPY grid in the CADJPY guide: the same 500-dollar cap buys more USDCAD size at every stop distance, because the USDCAD pip is larger, and borrowing a CADJPY size onto USDCAD is exactly the 557-dollar mistake that opened this article.
| Stop distance | Size at 7.19-dollar pip | Risk |
|---|---|---|
| 25 pips | 500 / (25 x 7.19) = 2.78 lots | 2.78 x 25 x 7.19 = 499.71 dollars |
| 30 pips | 500 / (30 x 7.19) = 2.31 lots | 2.31 x 30 x 7.19 = 498.27 dollars |
| 40 pips | 500 / (40 x 7.19) = 1.73 lots | 1.73 x 40 x 7.19 = 497.55 dollars |
| 50 pips | 500 / (50 x 7.19) = 1.39 lots | 1.39 x 50 x 7.19 = 499.71 dollars |
| 60 pips | 500 / (60 x 7.19) = 1.15 lots | 1.15 x 60 x 7.19 = 496.11 dollars |
| 80 pips | 500 / (80 x 7.19) = 0.86 lots | 0.86 x 80 x 7.19 = 494.67 dollars |
The New York session plan, and the news I skip
USDCAD belongs to New York. The pair moves when US data lands, when the Bank of Canada speaks, and when oil inventories print, which means the New York morning, roughly 13:30 to 17:00 London time, when US and Canadian releases overlap with the deepest liquidity of the day. The London morning alone is second choice: the pair trades, but the real moves wait for New York, and a London breakout without New York confirmation reverses more often than it runs. The Asian session is excluded entirely, because neither economy is awake, oil is quiet, and the pair drifts sideways in a way that fills neither targets nor stops cleanly. I also skip 30 minutes either side of high-impact US and Canadian releases, Bank of Canada and Federal Reserve announcements, and the Wednesday oil inventory report, because all four can move this pair 50 pips in minutes, which is a full stop distance.
| Session window | USDCAD plan |
|---|---|
| New York morning, 13:30-17:00 London time | Primary window: data, liquidity and follow-through |
| London morning | Second choice: tradable, but real moves usually wait for New York |
| Asian session | Excluded: neither economy awake, oil quiet, drift only |
| 30 minutes around high-impact news | Excluded: US and Canadian data, Fed and Bank of Canada, Wednesday oil inventories |
| Friday afternoon | Excluded for new positions: weekend gap risk over oil and policy headlines |
What I tested: filtered vs unfiltered
I ran the same breakout idea two ways over 27 trades in my journal, and the gap is the whole argument for the session and oil filters. The filtered version only traded marked levels, only in the New York morning, skipped every news and oil-inventory window, required oil to agree with the direction, and stopped after two losses. The unfiltered version traded every breakout in any session, including Asian drift breakouts and news spikes, with no oil check. The filtered version made 3,250 dollars across 12 trades, eight winners and four losers, with the best day at 750 dollars, which is 23.1 percent of the net profit and inside the 30 percent consistency ceiling. The unfiltered version lost 750 dollars across 15 trades, six winners and nine losers, because most Asian breakouts reverse before New York and most news spikes stop out both directions. The filter was worth 4,000 dollars across the 27 trades. A policy-and-oil pair rewards patience more than activity, and the fastest way to lose a funded account on it is to trade it like a quiet range pair.
| Test version | Trades | Win / loss | Winners minus losers | Net |
|---|---|---|---|---|
| Filtered (levels + New York hours + news and oil filters) | 12 | 8 / 4 | 8 x 1.5R – 4 x 1R | +3,250 dollars = +6.5R |
| Unfiltered (every breakout, any session, no oil check) | 15 | 6 / 9 | 6 x 1R – 9 x 1R | -750 dollars = -1.5R |
When USDCAD fails
The pair fails in four recognisable ways, and naming them is what keeps the losses at one unit each. First, the oil reversal: crude spikes on an inventory surprise and USDCAD reverses against a clean technical breakout, stopping out a trade that was right on the chart. The stop beyond the level is sized for exactly this case, and the two-loss rule stops it becoming a day-ruining sequence. Second, the borrowed size: carrying a CADJPY or EURUSD size onto USDCAD without recalculating, so a planned 500-dollar risk becomes 557 dollars, or an undersized trade tempts a mid-trade add that doubles exposure. Third, the stale pip value: sizing from last month’s USDCAD rate after the pair has moved three figures, so every trade risks a different amount than planned and the fifth trade of the week quietly breaches the spirit of the cap. Fourth, the policy-gap flip: a Bank of Canada surprise against a Federal Reserve hold turns a trending pair into a ranging one overnight, and every breakout of the old range stops out in sequence. Every failure mode here costs one unit when the rules hold, and several units when they do not. That asymmetry is the real edge on a policy pair: the pair does not need to be quiet, it needs the trader to respect the stop and the pip maths. If you trade only one pair while learning funded rules, the one-pair challenge guide explains why a well-understood major like this one beats a basket of pairs you size from habit.
My daily USDCAD routine
The routine is deliberately short, because a policy pair rewards the same few actions repeated cleanly. I check the live USDCAD rate and rebuild the pip value before the New York session, then mark the range floor and ceiling from the daily and four-hour charts, check the oil direction and the day’s US and Canadian calendar, and cross off every level that has held fewer than twice. I wait for price to reach a level and print a confirmation, size from the grid, and place the stop beyond the level before I think about targets. I take at most two trades, I stop at two losses or at the personal daily stop, and I never add to a trade to make up for an undersized first entry. A breakout trade that needs its size fixed mid-trade was a trade sized from habit, and habit is not a level. Kept inside these rules, USDCAD fits funded-account constraints cleanly: each trade risks about a tenth of the daily limit, the best day stays inside the consistency ceiling, and no single oil or policy surprise can end a challenge. Before each session I also run the numbers through the max daily drawdown calculator so the day’s remaining room is a number, not a feeling.
| Routine step | Action |
|---|---|
| 1. Reprice the pip | Live USDCAD rate, pip value = 10 / USDCAD, rebuild the sizing grid |
| 2. Mark the levels | Floor and ceiling held at least twice, daily and four-hour charts, before New York |
| 3. Check oil and calendar | WTI direction agrees, no US or Canadian release or inventory report within 30 minutes |
| 4. Size from the grid | Stop beyond the level, 500-dollar cap, size rounded down, never borrowed from another pair |
| 5. Manage by the rules | Half at 1R, stop to breakeven, rest at 2R, max two trades a day |
| 6. Stop rules | Two losses or 2,500-dollar personal daily stop, then done; no Friday-afternoon entries |
Frequently asked questions
What is one pip on USDCAD worth in dollars?
Ten Canadian dollars per standard lot, converted at the USDCAD rate. At USDCAD 1.3900 that is 7.19 dollars per pip per lot, at 1.3500 it is 7.41 dollars, and at 1.4300 it is 6.99 dollars. Always recalculate from the live USDCAD rate before sizing.
Why is USDCAD different from CADJPY for position sizing?
CADJPY pays out in yen and converts through USDJPY, while USDCAD pays out in Canadian dollars and converts through its own rate. The same 1.55 lots on a 50-pip stop risks 500 dollars on CADJPY but 557 dollars on USDCAD, so a size borrowed from one pair does not fit the other.
What is the best session for trading USDCAD on a funded account?
The New York morning, roughly 13:30 to 17:00 London time, when US and Canadian data land and liquidity is deepest. The London morning is second choice, and the Asian session should be skipped because neither economy is awake.
Does oil really matter for a USDCAD trade?
Yes. Canada is a major oil exporter, so higher oil prices support the Canadian dollar and tend to push USDCAD down, while falling oil tends to push it up. I check the WTI direction before every trade and skip the Wednesday inventory report window entirely.
How many USDCAD trades should I take per day?
At most two, with a stop after two losses or at the personal daily stop. A policy pair prints tempting breakouts all day, and without a hard cap it becomes an overtrading machine.
Can I hold a USDCAD breakout trade overnight?
You can, but check the swap costs first and keep the stop beyond the level, because an overnight oil headline can gap price through it. I avoid new positions on Friday afternoons for exactly this reason.
Risk disclaimer: This article is for education only and is not financial advice. Prop firm accounts carry strict loss limits, and a single oversized trade can end a challenge. Always size from your firm’s published rules and your own daily stop before trading.




2 comments
[…] The 6.50-Dollar Pip, the Two-Central-Bank Cross and the Sydney-London Plan That Keep You FundedTrading USDCAD on a Funded Account: The 7.19-Dollar Pip, the Oil Link and the New York Plan That Kee…Trading EURGBP on a Funded Account: The 12.70-Dollar Pip, the Range Rules and the London Plan That […]
[…] who copy AUDUSD stops and sizes onto AUDCAD get stopped out by ordinary Canadian-side noise. USDCAD is the direct Canadian-dollar pair, and watching it is the single best AUDCAD habit: when USDCAD […]