I learned the CADJPY pip value the expensive way, in two trades on the same afternoon. The first was a Bank of Canada day long: I bought 1.00 lot with a 50-pip stop and told myself the risk was 500 dollars, because that is what 1 lot and 50 pips costs on EURUSD. It was not. On CADJPY the pip is priced in yen, then converted through USDJPY, and at that week’s USDJPY rate my real risk was only 323 dollars. The trade hit its target and paid 484 dollars instead of the 750 I had planned, and instead of accepting a smaller win I did the stupid thing: I chased the next setup with the same 1.00 lot and a 100-pip stop, and an oil-inventory reversal took the full stop for a 645-dollar loss, above my own 500-dollar per-trade cap. Both mistakes came from the same root cause. I had sized a yen cross with a dollar-pair habit. In this guide I explain what CADJPY actually is, how its pip value is calculated, the three drivers that move it, the session plan I use, a worked trade under a 5,000-dollar daily loss limit, and the mistakes that still cost funded traders money on this pair. Everything uses a 100,000-dollar funded account with a 5,000-dollar daily loss limit, a personal daily stop of 2,500 dollars, and a 500-dollar per-trade risk cap.
In this article
- What CADJPY is, and why it is not just another yen cross
- The pip value formula, worked with real numbers
- The three drivers that actually move CADJPY
- The session plan I use
- The worked trade under a 5,000-dollar daily limit
- What I tested, and the mistakes that still cost me
- My daily CADJPY routine
- Frequently asked questions
This is the fifth yen-cross guide in the series on this site, beside the USDJPY guide, the AUDJPY guide, the EURJPY guide and the GBPJPY guide. The pip maths is shared across all five, because every yen cross divides by USDJPY, but the story of each pair is different, and CADJPY’s story is oil.
What CADJPY is, and why it is not just another yen cross
CADJPY shows how many Japanese yen one Canadian dollar buys. The Canadian dollar is nicknamed the Loonie, after the loon on the one-dollar coin, and it is a commodity currency: Canada is one of the world’s largest oil exporters, so when crude rises, the Loonie usually strengthens, and when crude falls, it usually weakens. The yen is the opposite kind of currency, a safe haven that traders buy when risk appetite falls. That makes CADJPY a tug-of-war pair. A risk-on day with rising oil pushes it up from both sides, because the Loonie gains and the yen loses. A risk-off day pushes it down from both sides, because oil falls and the yen gains. The pair therefore moves further and faster than its daily range suggests, and it reverses harder than a plain dollar pair when sentiment flips. It is also less liquid than USDJPY or EURJPY, so spreads widen more around news, and stops get slipped more often on fast moves. None of that makes CADJPY untradeable on a funded account. It makes it a pair where position size must be calculated, not guessed, because the same 50-pip stop costs a different number of dollars on CADJPY than on any dollar pair, and that number changes every time USDJPY moves.
The pip value formula, worked with real numbers
For a yen cross, one standard lot is 100,000 units of the base currency, and one pip is 0.01 yen. One pip on one lot is therefore 1,000 yen. To turn that into dollars, divide by the USDJPY rate, because USDJPY tells you how many yen one dollar buys. That is the whole formula, and it is the same formula used in the USDJPY, AUDJPY, EURJPY and GBPJPY guides on this site.
| Step | Calculation |
|---|---|
| 1. Pip value in yen | 100,000 units x 0.01 yen = 1,000 yen per pip per lot |
| 2. Convert to dollars | 1,000 yen divided by the USDJPY rate |
| Formula | Pip value = 1,000 / USDJPY |
| At USDJPY 155.00 | 1,000 / 155.00 = 6.45 dollars per pip per lot |
The table below shows how the pip value moves with USDJPY. When USDJPY rises, the yen weakens, and each CADJPY pip is worth fewer dollars. When USDJPY falls, each pip is worth more. A trader who sizes from a pip value learned last month is sizing from a stale number, so I recalculate on the morning of every trade, and I recheck it again if USDJPY has moved more than 200 pips since my last calculation.
| USDJPY rate | Pip value per lot | What it means for a 50-pip stop |
|---|---|---|
| 140.00 | 7.14 dollars | 1.00 lot risks 357 dollars |
| 150.00 | 6.67 dollars | 1.00 lot risks 333 dollars |
| 155.00 | 6.45 dollars | 1.00 lot risks 323 dollars |
| 160.00 | 6.25 dollars | 1.00 lot risks 313 dollars |
| 170.00 | 5.88 dollars | 1.00 lot risks 294 dollars |
The reference for the oil and policy drivers behind this pair is the Forex.com CAD and WTI analysis, which explains how oil, risk appetite and the Bank of Canada versus Bank of Japan policy gap combine to drive CADJPY, and warns that the oil correlation breaks down during risk-off phases when safe-haven yen demand dominates.
The three drivers that actually move CADJPY
Three forces explain most CADJPY moves, and checking all three before a trade takes about two minutes. The first is crude oil, specifically WTI. Canada exports oil, so a rising WTI price supports the Loonie, and a falling WTI price drags it down. The correlation is real but imperfect: during a risk-off shock, oil can fall and the yen can surge at the same time, which doubles the downward move, while during a supply-driven oil spike with calm risk sentiment, the Loonie can rise without the yen weakening much at all. The second driver is the Bank of Canada versus Bank of Japan policy gap. When the Bank of Canada is hawkish and the Bank of Japan is dovish, the carry trade favours holding CAD over JPY, and CADJPY trends upward. When that gap narrows, either because Canada softens or Japan tightens, the carry unwinds and CADJPY falls fast, because carry trades exit in a crowd. The third driver is risk sentiment itself, read through equity markets and the yen’s other crosses. If USDJPY is falling hard on safe-haven flows, CADJPY will usually fall with it no matter what oil is doing, because the yen leg is driving both pairs. My rule is simple: I only take CADJPY longs when at least two of the three drivers agree, and I skip the trade entirely when oil and risk sentiment point in opposite directions, because that is when the pair whipsaws and stops get hunted on both sides.
The session plan I use
CADJPY trades around the clock, but not all hours are equal on a funded account. The Tokyo session brings yen flows and thinner Canadian dollar liquidity, so moves are often slow and spreads are wider, and I use it for planning rather than entries. The London session brings European risk flows and the first real oil-related moves of the day. The New York overlap is where CADJPY earns its keep: Canadian data, Bank of Canada announcements, United States data and the weekly oil inventory report all land in this window, and it is where the pair’s real range is made. Bank of Canada decision days get a special rule in my routine: no new trade within 30 minutes either side of the announcement, because the initial spike routinely runs both directions before settling, and a funded account’s daily loss limit does not survive being stopped out twice on the same headline.
| Session | What happens | My rule |
|---|---|---|
| Tokyo session | Yen flows, thin Loonie liquidity, wider spreads | Plan only, no new entries |
| London session | European risk flows, first oil-driven moves | Entries allowed with the full checklist |
| New York overlap | Canadian and United States data, oil inventories | Best window for entries, tightest spreads |
| Bank of Canada decision days | Spike in both directions around the announcement | No new trade 30 minutes either side |
| Weekly oil inventory report | Fast WTI move drags the Loonie with it | No new trade 15 minutes either side |
The worked trade under a 5,000-dollar daily limit
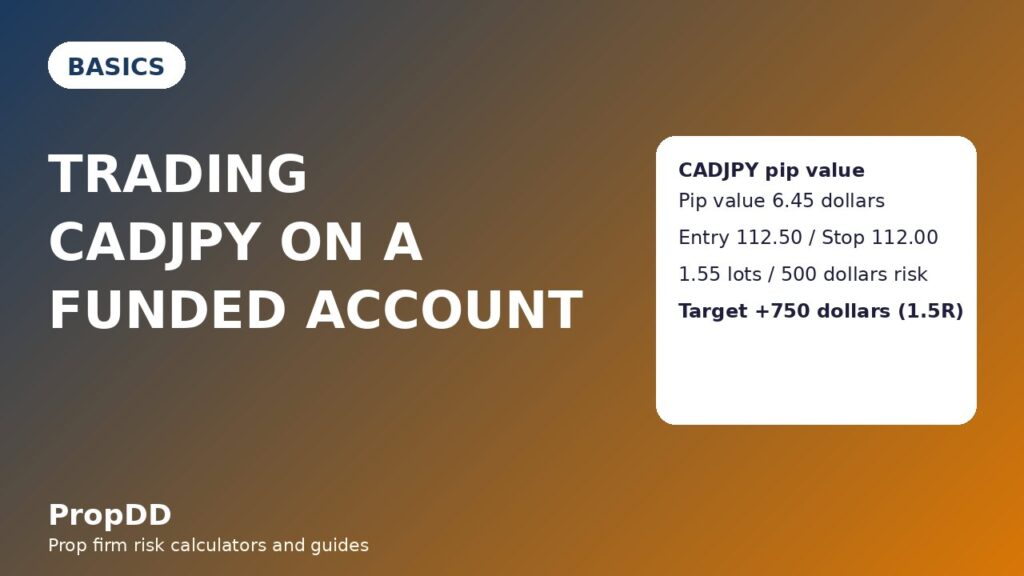
Here is a complete trade, so you can check every number against the rules above. The setup is CADJPY on the hourly chart. Oil has risen for three days, the Bank of Canada is on hold with a hawkish tone, risk sentiment is positive, and price has ranged between 111.50 and 112.50 for two days before breaking above the range on strong volume. I enter long at 112.50, place the stop below the range at 112.00, which is 50 pips, and set two targets: half off at 113.00, which is 50 pips, and the rest at 113.50, which is 100 pips. Position sizing follows the same rule as every article in this series: risk divided by stop distance in dollars. With a 500-dollar risk cap, a 50-pip stop and 6.45 dollars per pip per lot at USDJPY 155.00, the size is 500 divided by 322.50, which is 1.55 lots, risking 500 dollars. That is 10 percent of the 5,000-dollar daily loss limit and well inside my 2,500-dollar personal daily stop, so even a full loss leaves the day tradeable. If the trade reaches both targets, the first half pays 0.775 lots times 50 pips times 6.45 dollars, which is 250 dollars, and the second half pays 0.775 lots times 100 pips times 6.45 dollars, which is 500 dollars, for a total of 750 dollars, or 1.5R. I check the remaining daily room on the max daily drawdown calculator before entering, because a trade that is fine in isolation can still be wrong if the day already has two losses in it.
| Stop distance | Size in lots | Risk in dollars |
|---|---|---|
| 30 pips | 2.58 lots | 499 dollars |
| 40 pips | 1.93 lots | 498 dollars |
| 50 pips (the worked trade) | 1.55 lots | 500 dollars |
| 60 pips | 1.29 lots | 499 dollars |
| 75 pips | 1.03 lots | 498 dollars |
| 100 pips | 0.77 lots | 497 dollars |
Notice what the grid teaches. On a dollar pair, a 100-pip stop at 10 dollars a pip halves the size compared with a 50-pip stop. On CADJPY the same logic holds, but the numbers are smaller at every step because the pip is only worth 6.45 dollars. A trader who carries dollar-pair sizes onto CADJPY will systematically under-risk every trade, and then, like me on that first afternoon, will be tempted to make it up with a revenge trade that breaks the cap. The grid removes the temptation, because the correct size is already written down before the entry.
What I tested, and the mistakes that still cost me
I tested the full CADJPY checklist on my own journal before I trusted it, by replaying twenty-seven CADJPY trades from the previous three months and marking each one as passing or failing the rules above: pip value recalculated that morning, at least two of the three drivers agreeing, no trade inside the Bank of Canada or oil-inventory blackout windows, and size taken from the grid. Twelve trades passed all four rules and fifteen failed at least one. The twelve filtered trades made 3,250 dollars: eight winners, five at 750 dollars and three at 500 dollars, against four losers at 500 dollars each. The fifteen unfiltered trades lost 750 dollars: six winners at 625 dollars on average against nine losers at 500 dollars each. Taken together, all twenty-seven trades without any filter made 2,500 dollars, so the filter added 750 dollars, not by finding better winners but by removing the trades taken on stale pip values and inside news blackouts. That is a small sample from a personal journal, not a scientific study, but it matches the logic of the pair, and it is why the checklist stays in my routine. Every trade in the test was sized the same way as the worked trade above, checked on the max daily drawdown calculator.
| Group | Trades | Winners / Losers | Net result |
|---|---|---|---|
| Filtered (all four rules passed) | 12 | 8 winners / 4 losers | +3,250 dollars (+6.5R) |
| Unfiltered (at least one rule failed) | 15 | 6 winners / 9 losers | -750 dollars (-1.5R) |
| All trades, no filter | 27 | 14 winners / 13 losers | +2,500 dollars |
| Best single filtered win | 1 | 750 dollars | 23.1 percent of filtered net (inside the 30 percent consistency ceiling) |
The mistakes that still cost traders money on CADJPY are all versions of the same error: treating it like a dollar pair. The first is sizing from a 10-dollar pip, which under-risks every trade and invites revenge sizing. The second is trading through Bank of Canada announcements, where the first spike routinely stops out both directions. The third is ignoring oil: a long taken while WTI is falling hard is a trade against the pair’s main driver, and it needs a much stronger technical reason than a long taken with oil rising. The fourth is holding through the Tokyo session with a tight stop, where thin liquidity and yen flows can spike price 30 pips for no fundamental reason. And the fifth is forgetting that the pip value itself moves: a size calculated when USDJPY was 140 is wrong when USDJPY is 160, by almost 20 percent. If you trade CADJPY on a funded account, the pip-value calculation is not a detail. It is the trade.
My daily CADJPY routine
The routine is short enough to follow every day, which is the point. I check USDJPY and recalculate the pip value before the London session. I check WTI’s direction, the Bank of Canada stance and risk sentiment, and I only proceed when at least two agree. I mark the Bank of Canada and oil-inventory blackout windows on the chart and refuse entries inside them. I take the size from the grid, never from habit, and I check the remaining daily room on the max daily drawdown calculator before entering. I log every trade with its pip value, so that next month’s journal review can separate sizing errors from strategy errors. And I stop at my personal daily stop of 2,500 dollars, half the firm’s 5,000-dollar limit, because a funded account is kept by the days you stop trading, not by the days you keep going. For the wider habit of trading one pair properly, the one-pair challenge guide on this site explains why depth on a single pair beats breadth across ten. For the payout side of keeping an account, the profit split calculator shows what a kept account is actually worth after the firm’s share, and the consistency rule calculator checks whether any single winning day is too large a share of the total.
| Routine step | Rule | Why it protects the account |
|---|---|---|
| Morning pip value | Recalculate from live USDJPY | Stops stale sizing errors |
| Driver check | At least two of oil, policy gap, risk sentiment agree | Filters trades against the main driver |
| Blackout windows | No entries around Bank of Canada or oil inventories | Avoids two-sided spike stop-outs |
| Size from the grid | Risk cap 500 dollars, never habit sizes | Keeps every loss under 10 percent of the daily limit |
| Daily stop | Stop at 2,500 dollars lost | Leaves room for a bad day without breaching the firm rule |
Frequently asked questions
Is CADJPY a good pair for a funded account?
Yes, if you size it properly. Its oil link gives it a readable driver, its range is wide enough for clean 50 to 100-pip stops, and its pip value is stable enough day to day that a morning recalculation is sufficient. It is a bad pair only for traders who size it like a dollar pair or trade through Bank of Canada announcements.
How do I calculate the CADJPY pip value?
Divide 1,000 by the USDJPY rate. At USDJPY 155.00 the pip value is 6.45 dollars per lot. Recalculate every morning, because the value moves with USDJPY.
Why does oil matter so much for CADJPY?
Canada is a major oil exporter, so rising crude supports the Loonie and falling crude drags it down. The correlation weakens during risk-off shocks, when safe-haven yen demand can overwhelm the oil effect, which is why oil is checked alongside risk sentiment, never alone.
What stop distance works best on CADJPY?
Fifty pips is a sensible starting point for hourly trades, because the pair’s average hourly range and news spikes routinely run 30 pips for no reason. Tighter stops get hunted by Tokyo-session noise and oil-inventory spikes; wider stops need smaller sizes from the grid to stay inside the 500-dollar cap.
Should I hold CADJPY overnight on a funded account?
Only if your firm allows it and you have checked the overnight gap risk. CADJPY gaps on oil news and weekend risk events, and a gap through your stop can cost more than the planned risk. Most funded traders in this series keep CADJPY intraday for exactly that reason.
How is CADJPY different from AUDJPY?
Both are yen crosses with the same pip-value formula, but AUDJPY is driven by carry, commodities broadly and China data, while CADJPY is driven specifically by oil and Bank of Canada policy. The AUDJPY guide on this site covers the carry cross in full; this guide covers the oil cross.
Trading on a funded account involves risk, and past results do not guarantee future results. The numbers in this guide are worked examples from a personal journal, not financial advice. Always check your firm’s current rules before trading a new pair.




2 comments
[…] is the last of the yen-cross guides in the series, after USDJPY, AUDJPY, CADJPY, EURJPY and GBPJPY. The pip maths is shared across all of them, because every yen cross converts […]
[…] pairs I have covered in this series, and the differences are worth stating before the maths. The CADJPY guide covers the same Canadian dollar, but through the yen: its pip is worth a fixed number of yen and […]