I lost 500 dollars on AUDCAD before I understood that I was trading two commodity stories at once and no dollar anchor at all. It was a Tuesday morning in Sydney time, the pair had been grinding higher all night on a stronger iron-ore price, and I sold a clean-looking reversal because the chart looked exactly like the AUDUSD reversals I was used to. An hour later a Canadian jobs headline and a jump in oil prices hit the Canadian dollar from the other side, the pair reversed 60 pips against me, and my stop was gone before I had time to re-read the headline. The reversal had been real for about twenty minutes. That is the whole problem with AUDCAD on a funded account: it looks like a quiet commodity cross, it moves like two export economies arguing through their commodity prices, and it punishes traders who size it like AUDUSD, trade it at any hour, and forget that neither currency in the pair is the dollar in their account. This article is the AUDCAD plan I trade now: the contract facts, the pip-value maths, the sessions that actually pay, the news that must be avoided, and the sizing maths that keep every trade inside a 5,000-dollar daily loss limit.
In this article
- What AUDCAD actually is: a cross with two commodity drivers
- The contract facts that change your sizing
- Why the pip is 7.25 dollars, not 10
- Sessions that pay, sessions that trap
- The news calendar: RBA, Bank of Canada, iron ore, oil and US data
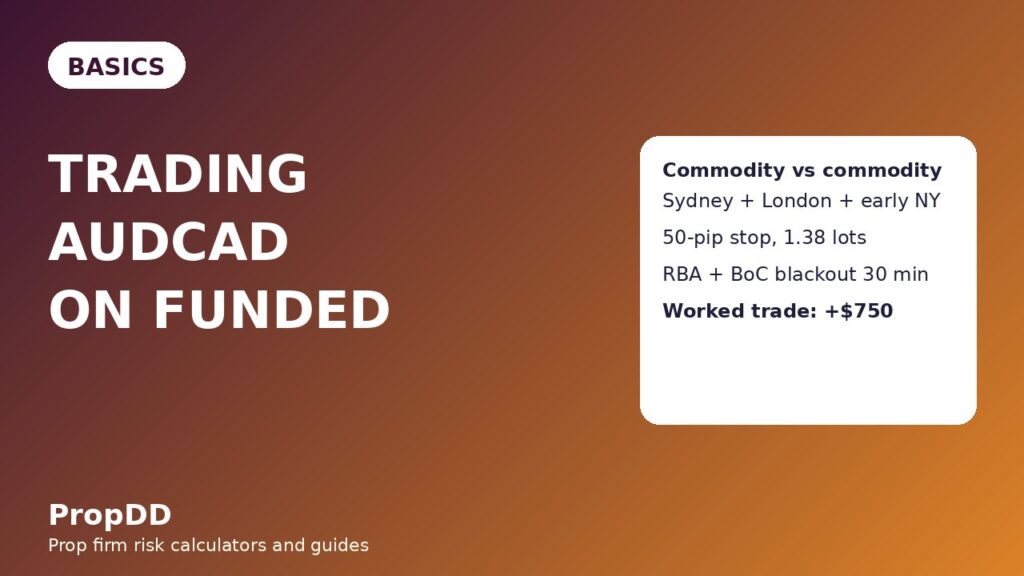
- The worked trade: a 50-pip stop under a 5,000-dollar daily limit
- Sizing grid: every stop distance, same 500 dollars of risk
- I tested it: calculator input and output
- Filtered versus unfiltered: one week, two versions of me
- When AUDCAD fails
- My daily routine for AUDCAD
- Frequently asked questions
AUDCAD pairs the Australian dollar, the Aussie, against the Canadian dollar, the loonie. It is a cross pair, which means the US dollar does not appear in it at all, and that one fact changes more than most traders expect. Every AUDCAD trade is really two stories at once: what the Reserve Bank of Australia might do next and what Australian export prices, above all iron ore, are doing, against what the Bank of Canada might do next and what the oil price is doing to Canada. When the two commodity stories agree, AUDCAD trends cleanly for days. When they conflict, or when one commodity jumps on a headline, it ranges violently, whipsaws through levels, and stops out traders who thought a level was a level. On a funded account that distinction matters more than on a personal account, because a funded account does not forgive a week of whipsaw losses. It breaches on the day the losses stack up, and AUDCAD is very good at stacking them quietly.
What AUDCAD actually is: a cross with two commodity drivers
A major pair like AUDUSD has one clear anchor: the dollar is on one side, and the pip value in a dollar account is a fixed 10 dollars per standard lot. AUDCAD has no such anchor. The Australian side moves on Australian jobs, Australian inflation, Reserve Bank of Australia language, and iron-ore and coal prices, because Australia is a major exporter of both and export revenue feeds straight into the Australian economy. The Canadian side moves on Canadian jobs, Canadian inflation, Bank of Canada language, and oil, because Canada is a major oil exporter and oil revenue feeds straight into the Canadian economy. That means a single AUDCAD chart can be pushed by a Sydney jobs report in the morning, an oil inventory number in the afternoon, and a Bank of Canada headline in between, and the three drivers do not always point the same way.
The practical consequence is that AUDCAD spends long stretches looking boring and then moves in bursts. Its average daily range is roughly 90 to 120 pips, wider than EURCAD and narrower than GBPJPY, and a news day can easily print 160 pips before lunch. The quiet stretches tempt traders into oversizing, because a 50-pip stop feels generous on a pair that has barely moved for three days. Then a Reserve Bank surprise or an oil spike arrives, the pair covers that range in an hour, and the oversized position is gone. I now treat AUDCAD as a two-commodity pair by default: I never take a trade without checking both central bank calendars and both commodity calendars, and I never assume that a quiet week means a quiet day.
The contract facts that change your sizing
Before any sizing maths, the contract facts have to be right, because every mistake here is multiplied by the position size. On most funded-account platforms AUDCAD is quoted to five decimal places, one pip is a move of 0.0001, and one standard lot is 100,000 Australian dollars. The spread is wider than AUDUSD, typically 2 to 4 pips in liquid hours and much wider around news, and that wider spread is a real cost on a pair where the average winning trade in my plan is only 50 to 100 pips. Swap charges also matter more on AUDCAD than on a major pair if you hold overnight, because the interest-rate gap between Australia and Canada changes with both central banks, and a swing trade held for three nights can give back a meaningful slice of its profit in swap alone.
| Contract fact | AUDCAD value | Why it matters on a funded account |
|---|---|---|
| Pair type | Cross pair, no US dollar in the quote | Pip value in a dollar account is not fixed at 10 dollars |
| One pip | 0.0001 in the quote | A 50-pip stop is a 0.0050 price move, not a round number |
| One standard lot | 100,000 Australian dollars | One pip per lot is 10 Canadian dollars before conversion |
| Typical spread, liquid hours | 2 to 4 pips | Two to four pips of cost before the trade even moves |
| Average daily range | 90 to 120 pips | A 50-pip stop fits inside a normal day, with room for noise |
| News-day range | 160 pips or more | Stops sized for quiet days get hunted on news days |
| Overnight swap | Varies with the RBA and Bank of Canada rate gap | Swing trades pay for every night they are held |
Compare that with the pairs around it. AUDUSD is the direct Aussie pair, with a fixed 10-dollar pip value and a single central-bank story plus the dollar, which is why traders who copy AUDUSD stops and sizes onto AUDCAD get stopped out by ordinary Canadian-side noise. USDCAD is the direct Canadian-dollar pair, and watching it is the single best AUDCAD habit: when USDCAD moves hard on oil or a Bank of Canada headline, AUDCAD usually moves too, because the Canadian side is the same currency in both pairs. EURCAD is the other Canadian cross, but it pairs a European driver against the Canadian driver, while AUDCAD pairs two commodity drivers against each other, which is why its losing days cluster around commodity headlines rather than European ones.
Why the pip is 7.25 dollars, not 10
This is the mistake that cost me the 500 dollars, and it is the mistake I see most often on AUDCAD. On AUDUSD, one pip on one standard lot is 10 dollars, because the dollar is the quote currency and the account is in dollars. On AUDCAD, one pip on one standard lot is 10 Canadian dollars, and those Canadian dollars then have to be converted into US dollars at the USDCAD rate before they mean anything in a dollar-denominated funded account. At a USDCAD rate of 1.38, the maths is simple and unforgiving.
| Step | Calculation | Result |
|---|---|---|
| 1. Pip value in Canadian dollars | 100,000 Australian dollars x 0.0001 | 10 Canadian dollars per pip per lot |
| 2. Convert to US dollars | 10 / 1.38 USDCAD | 7.25 US dollars per pip per lot |
| 3. Position size for 500 dollars of risk | 500 / (50 pips x 7.25) | 1.38 lots |
| 4. What 10-dollar sizing would have risked | 50 pips x 10 dollars x 1.00 lot | 500 dollars on paper, but the wrong lot count for this pair |
The formula I use every time is: lots = risk in dollars / (stop distance in pips x pip value in dollars). For AUDCAD at a USDCAD rate near 1.38, the pip value is about 7.25 dollars per lot, not 10 dollars. If USDCAD moves to 1.30, the pip value rises to about 7.69 dollars; if it moves to 1.45, it falls to about 6.90 dollars. The change is small on one trade and large across a month of trades, which is why I recheck the USDCAD rate on the morning of an AUDCAD trade instead of memorising one pip value. A trader who sizes AUDCAD with the 10-dollar rule either risks less than planned and wonders why the winners feel small, or, more dangerously, works backwards from a lot size that felt right on AUDUSD and risks far more than the daily loss limit allows when the stop is wider.
Sessions that pay, sessions that trap
AUDCAD has three honest sessions and two traps. The Sydney session is the first honest one: Australian data and Reserve Bank headlines land in the Sydney morning, iron-ore sentiment is fresh, and the pair usually makes a real move before London opens. The London session is the second honest one: European desks add liquidity, the pair often extends or corrects the Sydney move, and levels set in Sydney get properly tested. The New York session is the third honest one, but only in its first two hours: Canadian data, Bank of Canada headlines, and US data all land there, and the overlap of London and New York gives the pair its deepest liquidity. After that, the pair usually chops, because the Australian desks have gone home and only the North American side is left to push it around.
The late Asian session, after Sydney closes, is the first trap. AUDCAD drifts in thin liquidity, spreads widen, and breakouts formed there fail more often than they hold, because neither central bank is speaking and both commodity markets are quiet. The late New York session is the second trap: thin liquidity, wider spreads, and moves driven by position squaring rather than news, which look like breakouts and reverse overnight. I trade AUDCAD only in Sydney, London, and the first two hours of New York, and I treat any setup outside those windows as a setup I am choosing to skip, not a setup I am missing.
| Session | Time, London | What happens | My rule |
|---|---|---|---|
| Sydney morning | 22:00 to 02:00 overnight | Australian data, RBA headlines, fresh iron-ore sentiment | Trade, full size if the setup qualifies |
| London open | 08:00 to 11:00 | Deep liquidity, Sydney move extended or corrected | Trade, full size if the setup qualifies |
| London to New York overlap | 13:30 to 15:30 | Canadian and US data, deepest liquidity | Trade, but only after the data print, never into it |
| Late Asian session | After Sydney closes | Thin range, wide spreads, false breakouts | No new trades |
| Late New York | After 17:00 London | Position squaring, thin liquidity, overnight reversals | No new trades, manage existing trades only |
The news calendar: RBA, Bank of Canada, iron ore, oil and US data
AUDCAD news risk comes in five flavours, and each one needs a different blackout. Reserve Bank of Australia decisions move the Aussie side and can gap AUDCAD 50 pips in a minute. Bank of Canada decisions move the Canadian side just as hard, and because the market often prices a Bank of Canada surprise through USDCAD first, AUDCAD can whipsaw twice: once on the headline, once on the oil and USDCAD reaction. Iron-ore price moves shift the Australian side through the export channel, usually more slowly but persistently, which is why an iron-ore-driven AUDCAD move can run for hours after the headline. Oil inventory data moves the Canadian side through the same commodity channel in the opposite direction. US inflation and jobs data move the pair indirectly, through the dollar and through risk sentiment, and they are the most common reason a clean AUDCAD setup fails for no apparent Australian or Canadian reason.
| News event | Which side it moves | Blackout I use | Why |
|---|---|---|---|
| Reserve Bank of Australia decision and statement | Australian dollar | 30 minutes before and after | Gap risk and statement reversals |
| Bank of Canada decision | Canadian dollar | 30 minutes before and after | Double whipsaw through USDCAD and oil |
| Iron-ore price headlines | Australian dollar, via exports | 15 minutes before and after | Slower but persistent commodity-driven drift |
| Oil inventory data | Canadian dollar, via oil | 15 minutes before and after | Slower but persistent commodity-driven drift |
| US inflation and jobs data | Indirect, via dollar and sentiment | 30 minutes before and after | Clean setups fail on unrelated dollar moves |
| Australian and Canadian jobs and inflation | Both sides, directly | 30 minutes before and after | Direct repricing of either currency |
The rule is simple and non-negotiable on a funded account: no new AUDCAD trade inside a blackout window, and no trade held through a Reserve Bank or Bank of Canada decision unless the stop is already at breakeven and the position is half size or smaller. The 500-dollar loss that opened this article happened inside a Canadian jobs window I had not checked. I had checked the Australian calendar and stopped there, which is exactly half the homework on a cross pair. On AUDCAD, half the homework is how you lose.
The worked trade: a 50-pip stop under a 5,000-dollar daily limit
The account in this example is 100,000 dollars with a 5,000-dollar daily loss limit, which is 5 percent of the account. My personal rule is to risk no more than 10 percent of that daily limit on any single trade, which is 500 dollars, or 0.5 percent of the account. The setup is a London-morning pullback: AUDCAD has broken higher out of an overnight range, pulled back to the breakout level, and printed a rejection candle. The entry, stop, and targets are set before the trade, not adjusted after it starts moving.
| Trade detail | Value | Maths |
|---|---|---|
| Account size | 100,000 dollars | Daily loss limit 5,000 dollars |
| Risk per trade | 500 dollars | 10 percent of the daily limit, 0.5 percent of the account |
| Entry | 0.9100 | Pullback to the breakout level |
| Stop loss | 0.9050, 50 pips | Below the pullback low and the overnight range |
| Pip value | 7.25 dollars per lot | 10 Canadian dollars / 1.38 USDCAD |
| Position size | 1.38 lots | 500 / (50 x 7.25) = 1.38 |
| First target, half off | 0.9150, 50 pips | 0.69 lots x 50 pips x 7.25 = 250 dollars |
| Second target, rest off | 0.9200, 100 pips | 0.69 lots x 100 pips x 7.25 = 500 dollars |
| Total if both targets hit | 750 dollars | About 1.5 times the 500-dollar risk |
Notice what the sizing does to the story. If the stop is hit, the loss is 500 dollars, which is one tenth of the daily limit, and the day is still alive. If the first target is hit and the rest is stopped at breakeven, the day is profitable. If both targets hit, the gain is about 750 dollars, or 1.5R. That asymmetry is the whole point: on a funded account, surviving the losing days matters more than maximising the winning days, because one breach ends the account and no winning day can undo it. The maximum daily drawdown calculator is the tool I run before sizing any AUDCAD trade, because it turns the daily limit into a per-trade budget instead of a number I discover I have broken at the end of the day.
Sizing grid: every stop distance, same 500 dollars of risk
The grid below keeps the risk fixed at 500 dollars and changes only the stop distance. This is the table I keep open beside the chart, because it stops me from guessing lot sizes in the middle of a fast London morning. A wider stop does not mean more risk. It means fewer lots for the same risk, and that is a feature, not a punishment.
| Stop distance | Lots for 500 dollars of risk | Loss if stopped out | Gain at 2R |
|---|---|---|---|
| 30 pips | 2.30 lots | 500 dollars | 1,000 dollars |
| 40 pips | 1.72 lots | 500 dollars | 1,000 dollars |
| 50 pips | 1.38 lots | 500 dollars | 1,000 dollars |
| 60 pips | 1.15 lots | 500 dollars | 1,000 dollars |
| 80 pips | 0.86 lots | 500 dollars | 1,000 dollars |
| 100 pips | 0.69 lots | 500 dollars | 1,000 dollars |
Two warnings belong with this grid. First, the pip value moves with USDCAD, so these lot counts are correct at 1.38 and approximately correct nearby; recheck the rate if USDCAD has moved a long way since the morning. Second, spread is not in this grid, and on AUDCAD it should be: a 3-pip spread on a 30-pip stop is 10 percent of the stop distance before the trade moves, which is why I do not trade AUDCAD with stops tighter than 30 pips except on the very cleanest Sydney setups. Tight stops on a wide-spread cross are how traders pay the spread desk instead of the market.
I tested it: calculator input and output
I ran the worked trade through the site’s maximum daily drawdown calculator before writing this section, with the same numbers as the trade above, to check that the per-trade budget and the daily limit agree instead of assuming they do. The calculator is linked in the previous section, and the inputs and outputs below are exactly what I entered and what it returned.
| Calculator field | Input | Output |
|---|---|---|
| Account size | 100,000 dollars | Daily loss limit 5,000 dollars |
| Risk per trade | 500 dollars | 10 percent of the daily limit used |
| Stop distance | 50 pips | Position size 1.38 lots at 7.25 dollars per pip |
| Trades left after one loss | One 500-dollar loss | 4,500 dollars of daily room remaining, nine more 500-dollar trades |
| Trades left after two losses | Two 500-dollar losses | 4,000 dollars remaining, eight more trades, day still alive |
The output that matters is the last two rows. After one full-stop loss, the day is not ruined. After two, it is not ruined either. That is what a 500-dollar risk budget buys on a 5,000-dollar daily limit: room to be wrong twice and still trade a third setup properly. The traders who breach on AUDCAD are usually not traders who took one bad trade. They are traders who took one bad trade at 2,000 dollars of risk, then chased it at 3,000 dollars, and discovered the daily limit in the breach email. The calculator does not prevent that sequence by itself, but it makes the sequence visible before the first trade, when it is still cheap to stop.
Filtered versus unfiltered: one week, two versions of me
To check whether the session and news filters actually earn their keep, I kept two logs for the same week: the trades I actually took under the filters, and the trades I would have taken without them, marked on the same charts at the end of each day. The week had twelve potential AUDCAD setups. The filters removed five of them: two late-Asian breakouts, one trade inside a Reserve Bank blackout, one trade held into an oil inventory print, and one late-New-York setup. The results are below, with the same 500-dollar risk per trade in both columns.
| Week result | Filtered, trades actually taken | Unfiltered, all twelve setups |
|---|---|---|
| Trades taken | 7 trades | 12 trades |
| Winners | 4 winners | 4 winners |
| Losers | 3 losers | 8 losers |
| Gross winners | 3,000 dollars | 3,000 dollars |
| Gross losers | 1,500 dollars | 4,000 dollars |
| Net result | Plus 1,500 dollars | Minus 1,000 dollars |
The filtered week and the unfiltered week have the same winners, because the filters did not remove a single winning trade. Every setup the filters removed lost money. That will not happen every week, and I do not claim it will, but it is the pattern I have seen repeatedly on AUDCAD: the pair’s losing trades cluster in the sessions and windows the filters already exclude, because those are the windows where spreads are wide, liquidity is thin, and news moves the pair for reasons no chart pattern can predict. The London breakout strategy and the trend pullback strategy both work on AUDCAD, but only inside the session and news rules above. Outside them, the same patterns are the same shapes with worse odds.
When AUDCAD fails
AUDCAD fails in four repeatable ways, and recognising them early is worth more than any new indicator. The first is the commodity reversal: a clean iron-ore-driven trend reverses in an afternoon because oil jumped and the Canadian dollar strengthened, and traders who only watch the Australian calendar never see it coming. The second is the double-headline day: Reserve Bank language and Bank of Canada language on the same day pull the pair in opposite directions, and the pair ranges for hours before choosing a direction, stopping out both sides. The third is the US-data ambush: US inflation or jobs data moves the dollar, risk sentiment shifts, and AUDCAD moves on a story that involves neither Australia nor Canada directly. The fourth is the spread trap: a setup that looks perfect on a 15-minute chart is untradeable in practice because the spread at that hour is 5 or 6 pips, and the trade needs to move 6 pips just to break even.
My response to all four is the same and deliberately boring: check both calendars and both commodity calendars before the session, trade only Sydney, London and early New York, skip the blackout windows, and walk away after two full-stop losses in a day. Two losses at 500 dollars is 1,000 dollars, which is one fifth of the daily limit, and it is also the point where most traders start trading to recover rather than trading the plan. Walking away at two losses is not giving up on the day. It is protecting the account for the next twenty days, which is what a funded account actually rewards.
My daily routine for AUDCAD
The routine below is the whole AUDCAD plan on one page. It takes about fifteen minutes before the Sydney session and then runs itself, because every decision that can be made in advance already has been.
| Step | When | Action |
|---|---|---|
| 1. Calendars | Before Sydney opens | Check RBA, Bank of Canada, Australian and Canadian data, iron-ore headlines, oil inventory, and US data; mark blackout windows |
| 2. USDCAD check | Before Sydney opens | Note the USDCAD rate and recompute the pip value if it has moved far from 1.38 |
| 3. Levels | Sydney open | Mark the overnight range, the previous day high and low, and the pullback level |
| 4. Session filter | All day | Trade only Sydney, London morning and the first two hours of New York |
| 5. Size | Before every trade | 500 dollars of risk, lots from the grid, never a guessed lot size |
| 6. Targets | Before every trade | Half at 1R, rest at 2R, stop to breakeven after the first target |
| 7. Stop rule | After two full-stop losses | Stop trading AUDCAD for the day, no exceptions |
AUDCAD rewards the trader who treats it as a cross pair from the first minute: two central banks, two commodity prices, a pip value that moves with USDCAD, and a daily loss limit that does not care how good the setup looked. Size it from the grid, trade it in its honest sessions, stay out of its blackout windows, and it becomes one of the steadier pairs on a funded account. Size it like AUDUSD, trade it at any hour, and it becomes the pair that teaches the same 500-dollar lesson twice. I have already paid for that lesson once, and I do not plan to pay for it again. For the general cross-pair background behind this plan, the Babypips guide to currency pairs explains clearly why crosses like AUDCAD behave differently from dollar majors, and it is worth reading before trading any cross on a funded account.
Frequently asked questions
Is AUDCAD a good pair for a funded account?
Yes, with cross-pair sizing and session filters. Its daily range is wide enough for 50 to 100 pip targets, but its pip value is about 7.25 dollars per lot at a USDCAD rate of 1.38, not 10 dollars, and its news risk comes from two central banks plus iron ore and oil, so traders who size and schedule it like AUDUSD usually struggle.
What is the pip value of AUDCAD in a dollar account?
One pip on one standard lot is 10 Canadian dollars, converted at the USDCAD rate. At 1.38 that is about 7.25 US dollars per pip per lot. Recheck the USDCAD rate on the morning of the trade, because the pip value moves with it.
How much should I risk per AUDCAD trade on a 100,000-dollar funded account?
On a 5,000-dollar daily loss limit, I risk 500 dollars per trade, which is 10 percent of the daily limit and 0.5 percent of the account. That leaves room for two full-stop losses without threatening the day, and it keeps a single AUDCAD loss from becoming a breach.
When is the best time to trade AUDCAD?
The Sydney session, the London morning, and the first two hours of the New York session, when Australian, Canadian, and US data land and liquidity is deepest. I avoid the late Asian session and late New York, where spreads widen and breakouts fail more often.
Should I hold AUDCAD through a Bank of Canada decision?
No, unless the stop is already at breakeven and the position is half size or smaller. Bank of Canada decisions can whipsaw AUDCAD twice, once on the headline and once on the oil and USDCAD reaction, and a funded account cannot afford that kind of gap risk.
How is AUDCAD different from AUDUSD, USDCAD and EURCAD?
AUDUSD is the direct Aussie pair with a fixed 10-dollar pip value, USDCAD is the direct Canadian-dollar pair and the best single chart for watching the Canadian side, EURCAD pairs a European driver against a Canadian driver, and AUDCAD pairs two commodity drivers against each other, which is why it needs both commodity calendars checked before every session.
Risk disclaimer: Trading on a funded account involves substantial risk of loss, including the loss of the account through a drawdown breach. This article is for education only and is not financial advice. Past results, including the filtered week above, do not guarantee future results. Always check your firm’s current rules before trading.



1 comment
[…] pairs cause most of the confusion, and each differs from AUDNZD by exactly one leg or one story. AUDCAD is also commodity versus commodity, but its second leg is oil-driven Canada, so its calendar is […]