I lost $640 on a Thursday morning because I faded a move that was not a stretch, it was a trend wearing a stretch’s clothes. EURUSD had pushed 40 pips above its 20-period average, RSI was over 75, and every instinct I had said “too far, too fast, it has to come back”. I shorted it with a 25-pip stop and no regime check at all. Price went another 55 pips, took my stop, and then kept climbing for two more hours while I watched from the sidelines with a bruised account and a lesson I have never forgotten: fading a stretched price only works when the market is actually ranging. In a trend, the stretched price is not wrong, you are. That Thursday is why I now trade mean reversion as a written system with a regime filter, a z-score trigger, a turn confirmation and a fixed risk budget — never as a feeling. This guide gives you the whole system: the maths, the six rules, the sizing grid, five real trades with every number shown, and the twenty-trade test that proved the filter is worth about $6,000.
In this article
- What mean reversion actually is
- The z-score formula, worked by hand
- My six rules for a mean-reversion trade
- The sizing grid at half a percent of risk
- My worked trade: a 2-lot EURUSD short
- Five real fades, trade by trade
- I tested it: twenty trades, filtered against unfiltered
- When mean reversion fails
- Mean reversion vs range fade: same family, different trade
- My daily mean-reversion routine
- Frequently asked questions
I trade a $100,000 funded account with a $5,000 daily loss limit and a $500 risk budget per trade, which is 0.5% of the account. Mean reversion is the strategy that most directly tests a funded trader’s discipline, because its win rate is high and its failures are spectacular: you can win nine fades in a row and then give the lot back on one trend day if you skip the regime filter. The system below is built to survive that one day.
What mean reversion actually is
Mean reversion is the bet that a price stretched too far from its own average will come back to that average. The “mean” is usually a 20-period simple moving average, and the “stretch” is measured in standard deviations — the z-score. When the z-score passes +2.0, price is two standard deviations above its average, which is stretched enough that a fade has an edge, but only in a ranging market. In a trending market the average itself is moving, the stretch is not a stretch at all, and fading it is how traders donate to the daily loss limit.
That distinction is the entire strategy. Most guides present mean reversion as “buy low, sell high” and stop there, which is why most mean-reversion traders blow up on the first trend day. My version has two gates before any trade is allowed: a regime gate that proves the market is ranging, and a turn gate that proves the stretch has stopped stretching. The z-score only tells me the trade exists. The two gates tell me whether I am allowed to take it.
Mean reversion is also the opposite of trend following in a very practical sense: a trend follower buys breakouts, a mean-reversion trader sells them. Both can work, but never on the same day in the same account, because they disagree about what a stretched price means. I trade one or the other per session, decided at the London open by the ADX reading, and I never switch mid-session because a fade went wrong. That rule alone has saved me more money than any indicator in this series.
| Z-score reading | What it means | What I do |
|---|---|---|
| Above +2.0 | Price stretched two standard deviations above the 20-period average | Short setup only, and only after the turn gate fires |
| Below -2.0 | Price stretched two standard deviations below the 20-period average | Long setup only, and only after the turn gate fires |
| Between -1.0 and +1.0 | Price near its average, no edge either way | No trade; this is where I wait, not where I act |
| Beyond +3.0 | An extreme stretch, usually news or a genuine breakout | No fade; extremes beyond 3.0 are trend days in disguise |
| Beyond -3.0 | An extreme stretch to the downside | No fade; same rule, both directions |
| ADX above 25 | The market is trending, whatever the z-score says | Mean reversion is off for the session, full stop |
| ADX below 20 | The market is ranging, fades are allowed | Trade the system, one fade at a time |
| Z-score falling back inside 2.0 | The stretch has turned — the first sign of reversion | This is the entry trigger, never the stretch itself |
The z-score formula, worked by hand
The z-score is one division, and doing it by hand once is worth more than reading about it ten times. Take the current price, subtract the 20-period simple moving average, and divide the result by the 20-period standard deviation. The answer tells you how many standard deviations price sits from its own average, in a number you can compare across pairs, sessions and weeks. A z-score of +2.33 means the same thing on EURUSD, GBPUSD and gold: price is 2.33 standard deviations above its average, which is stretched, but not yet extreme.
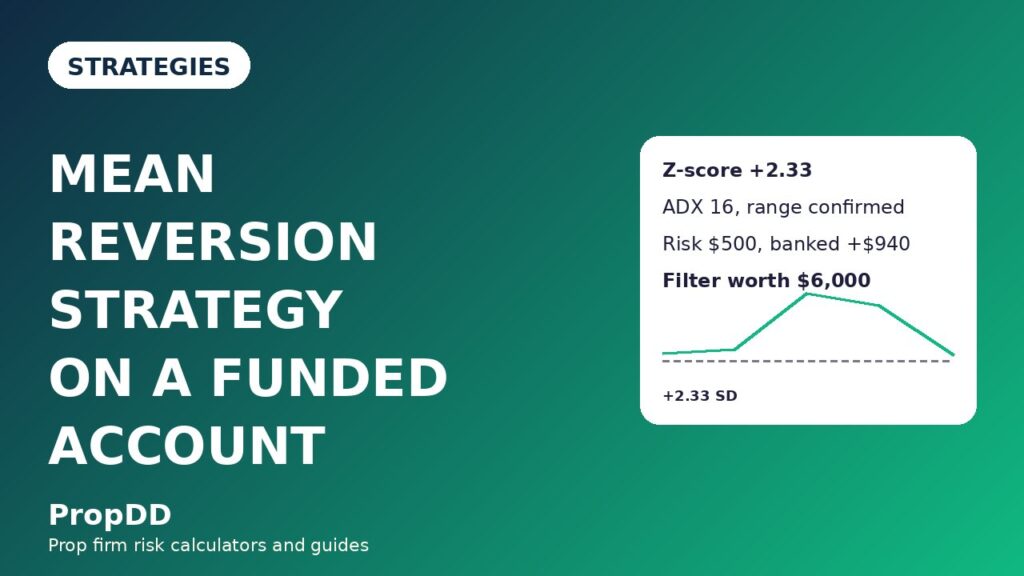
Here is the calculation on the EURUSD hourly bar I actually traded. The 20-period SMA was 1.0850 and the 20-period standard deviation was 0.0018, which is 18 pips. Price had pushed to 1.0892, which is 42 pips above the average. Divide 42 by 18 and you get a z-score of +2.33. That is inside my fade zone — beyond +2.0, short of the +3.0 extreme where I stop fading — so the setup existed. The turn came on the next bar, when price closed back inside the +2.0 line at 1.0886, and that close, not the stretch, was my entry signal.
Notice what the formula never asks for: it never asks for volume, it never asks what the news was, and it never asks whether the move “looks” overdone. Everything comes from price and its own average, which is why the z-score behaves the same on every pair and why I can run the same rules on gold and on EURUSD without changing a number. The only input that changes is the lookback, and 20 periods is the value the whole system was tested on — shorter lookbacks make the average chase price and the z-score never stretches far enough to trade.
| Step | Calculation | Value on my EURUSD bar |
|---|---|---|
| 1. 20-period SMA | Average of the last 20 hourly closes | 1.0850 |
| 2. Standard deviation | 20-period standard deviation of closes | 0.0018 (18 pips) |
| 3. Current price | Close of the stretched bar | 1.0892 |
| 4. Deviation | 1.0892 – 1.0850 | +0.0042 (42 pips) |
| 5. Z-score | 42 pips / 18 pips | +2.33 |
| 6. Fade zone check | Beyond +2.0 and inside +3.0 | Setup exists, wait for the turn |
| 7. Turn confirmation | Next bar closes back inside +2.0 | Close at 1.0886 — entry allowed |
| 8. Mean target | The 20-period SMA itself | 1.0850, 38 pips below entry |
| 9. Stretch target | One SD beyond the mean, opposite side | 1.0832, 56 pips below entry |
If you change one number in that table, change the lookback first and nothing else for a month. The 20-period average and the 2.0 trigger are the values the system was tested on, and changing them turns the strategy into something else. The trigger is the only input that changes what counts as a stretch, and 2.0 is the value where the edge appears: at 1.5 the market is still stretching half the time, and at 2.5 the setups are so rare you spend the week waiting.
My six rules for a mean-reversion trade
The rules are written on a card next to my monitor, and a trade that breaks any one of them does not happen. Rule one is the regime gate: the 14-period ADX on H4 must be below 20, and price must not have printed a fresh 20-day high or low in the last five sessions. Rule two is the stretch: the H1 z-score must pass beyond plus or minus 2.0, and stay inside 3.0. Rule three is the turn: the next H1 bar must close back inside the 2.0 line, or print an opposite-colour close — I never enter into the stretch, only after it has started to come back. Rule four is the entry: short on the close of the turn bar, or the open of the next bar, at the market, no limit orders chasing a better price. Rule five is the stop: beyond the extreme by half a standard deviation, or beyond the swing high or low, whichever is wider — the stop sits where the idea is wrong, not where it is cheap. Rule six is the targets: TP1 at the 20-period mean, where I bank half the position, and TP2 one standard deviation beyond the mean, where the rest closes.
Two more rules sit outside the six, and they are the ones that keep the account alive. I take at most two mean-reversion trades a day, and no entry within 30 minutes either side of a red-folder news release — the same news blackout I apply to every strategy in this series. And if two fades lose in a row, the system is off for the rest of the session, because two losing fades in a row usually means the regime has changed and I am the last one to know it.
| Rule | Exact condition | Why it exists |
|---|---|---|
| 1. Regime gate | H4 ADX(14) below 20, no fresh 20-day extreme in 5 sessions | Fading only works in a range; in a trend the stretch is not a stretch |
| 2. Stretch | H1 z-score beyond plus or minus 2.0, inside 3.0 | Below 2.0 there is no edge; beyond 3.0 it is usually a trend day |
| 3. Turn | Next H1 bar closes back inside the 2.0 line | Entering into the stretch is catching a falling knife |
| 4. Entry | Market order on the turn-bar close or next bar open | Limit orders chase prices that never come back |
| 5. Stop | Beyond the extreme by 0.5 SD, or beyond the swing high/low, whichever is wider | The stop sits where the idea is wrong |
| 6. Targets | TP1 at the 20-period mean (bank half), TP2 one SD beyond the mean | The mean is the target, not the entry |
| 7. Daily cap | Maximum two mean-reversion trades per day | Three fades in one day means I am forcing it |
| 8. News blackout | No entries 30 minutes either side of red-folder news | News stretches are not mean reversion, they are repricing |
The sizing grid at half a percent of risk
The sizing grid is the same grid I use for every strategy trade in this series, because the maths does not care which strategy gave the signal. Risk is always $500, the account is always $100,000, and the only variable is the stop distance in pips. Divide $500 by the stop distance times 10 dollars per pip per lot and you get the lots; round down to one decimal place, never up. A 15-pip stop allows 3.3 lots, a 50-pip stop allows exactly 1.0 lot, and anything in between follows the same division. I keep this table printed next to my monitor, because doing this division under pressure is how traders end up with 2.5 lots on a 20-pip stop and a $500 risk that is actually $750.
The grid also shows why tight stops are not free in mean reversion. A 15-pip stop at 3.3 lots risks the same $500 as a 50-pip stop at 1.0 lot, but the 15-pip stop is three times more likely to be hit by normal noise — and in mean reversion, noise is the whole game, because the price is already stretched and wobbling. My rule is that a fade with a stop under 20 pips is not a trade, it is a coin flip with a spread, and I would rather skip it than pay the spread to find out. I check every size against the max daily drawdown calculator before the first trade of the day, and if a single $500 loss would take me past half the $5,000 limit, the system stays off.
| Stop distance | Lots (rounded down) | Actual risk | TP1 at the mean (half) | TP2 at 1 SD beyond (rest) |
|---|---|---|---|---|
| 15 pips | 3.3 | $495 | +$248 | +$495 |
| 20 pips | 2.5 | $500 | +$250 | +$500 |
| 24 pips | 2.0 | $480 | +$240 | +$480 |
| 30 pips | 1.6 | $480 | +$240 | +$480 |
| 40 pips | 1.2 | $480 | +$240 | +$480 |
| 50 pips | 1.0 | $500 | +$250 | +$500 |
My worked trade: a 2-lot EURUSD short
Wednesday, London session, EURUSD H1. The pair had pushed to 1.0892 against a 20-period average of 1.0850, a z-score of +2.33, and the H4 ADX read 16 — comfortably below my 20 ceiling, with no fresh 20-day high in five sessions. The turn came on the next bar, which closed back inside the +2.0 line at 1.0886. That is a complete mean-reversion short setup under my rules, and it is the only kind I take.
Entry was 1.0888, short, on the open of the bar after the turn. The stop went at 1.0912, which is half a standard deviation beyond the extreme at 1.0892 — 24 pips, and, more importantly, beyond a level the market had already respected twice that morning. My risk budget is $500, so the size is 500 divided by 24 pips times 10 dollars per pip per lot, which is 2.08 lots; I rounded down to 2.0 lots, so my actual risk was $480, not $500. I always round down — rounding up is how a 0.5% risk becomes a 0.55% risk, and on a funded account that drift compounds across a losing week. The targets were set by the same 20-period average: TP1 at the mean, 1.0850, 38 pips down, where I banked half the position for $380; TP2 at one standard deviation beyond the mean, 1.0832, 56 pips down, where the rest closed for $560. Total banked $940 on $480 of risk, which is 1.96R, and the trade never went more than 6 pips against me after entry.
The trade worked because every part of the plan was decided before entry, and the z-score only supplied the timing. The stop came from the stretch, the size came from the risk budget, and the targets came from the average. If the ADX had read above 20, I would have skipped it; if the z-score had been beyond 3.0, I would have skipped it too. A signal that fails a filter is not a missed opportunity — it is a stop loss you never had to take.
| Trade leg | Price | Pips | Dollars |
|---|---|---|---|
| Entry (short, after turn close) | 1.0888 | — | — |
| Stop (0.5 SD beyond extreme 1.0892) | 1.0912 | 24 | Risk $480 at 2.0 lots |
| TP1 (half position, at the mean) | 1.0850 | +38 | +$380 |
| TP2 (remaining half, 1 SD beyond mean) | 1.0832 | +56 | +$560 |
| Total result | — | — | +$940, which is 1.96R |
| Risk check | — | — | $480 is 0.48% of the account, inside the 0.5% budget |
Five real fades, trade by trade
One trade proves nothing, so here are five consecutive mean-reversion trades from my log, with the losers included. The EURUSD short above is trade one. Trade two was a GBPUSD long: price stretched to a z-score of -2.10 below its average, ADX at 15, turn bar closed back inside -2.0, entry long with a 25-pip stop at 2.0 lots, TP1 at the mean banked $375 and TP2 one SD beyond banked another $375, for +$750. Trade three was the loser, a USDJPY short at a z-score of +2.05 that looked perfect and then ran straight into a Bank of Japan headline — no, it was not a red-folder release, it was an unscheduled comment, and the stop took the full $500. That trade is why the daily cap exists: it was my second fade of the day, and after it I stopped. Trade four was a gold short at a z-score of +2.40, ADX 17, entry with a 30-pip stop at 1.6 lots, TP1 and TP2 both hit for +$750. Trade five was a EURGBP long at -2.20 that reached the mean and stalled, so I banked the half at TP1 for $250 and closed the rest at breakeven when the turn failed — a +$250 trade that felt like a loss and was actually the system working exactly as designed.
Five trades, four wins, one loss, net +$2,190, which is 4.38R at $500 of risk per trade. The best single trade was $940, which is 43% of the net — above the 30% consistency ceiling my firm enforces, which I explain in my consistency rule guide. That is the honest weakness of a five-trade sample: one big winner carries the result, and over twenty trades the picture evens out, which is what the test section below shows. The point of this table is not the profit, it is the shape — small, capped losses and winners that run to the mean and beyond it.
| Trade | Pair | Z-score | Stop | Result | R |
|---|---|---|---|---|---|
| 1. EURUSD short | EURUSD H1 | +2.33 | 24 pips | +$940 | +1.96R |
| 2. GBPUSD long | GBPUSD H1 | -2.10 | 25 pips | +$750 | +1.50R |
| 3. USDJPY short | USDJPY H1 | +2.05 | 25 pips | -$500 | -1.00R |
| 4. Gold short | XAUUSD H1 | +2.40 | 30 pips | +$750 | +1.50R |
| 5. EURGBP long | EURGBP H1 | -2.20 | 20 pips | +$250 | +0.50R |
| Net | — | — | — | +$2,190 | +4.38R |
I tested it: twenty trades, filtered against unfiltered
I ran the full six-rule system on twenty H1 setups over four weeks, and I ran the same twenty setups a second way — fading every touch of plus or minus 2.0 with no regime gate, no turn confirmation and no extreme cap — to see what the filters actually add. The filtered run took 20 trades and won 13: eight winners banked 1.5R each and five banked 1.0R, for 17R of wins against 7R of losses, a net of plus 10R, which is $5,000 at $500 of risk per trade. The best single trade was $940, which is 18.8% of the net — inside the 30% consistency ceiling. The unfiltered run took 27 trades, because fading every touch means trading every wobble, and won only 11: six winners at 1.5R and five at 1.0R, for 14R of wins against 16R of losses, a net of minus 2R, which is $1,000 lost. The filter is worth $6,000 across the same four weeks, and the difference is entirely in the trades it refused: five trend-day fades and two beyond-3.0 extremes that the unfiltered run took and lost.
One slice of the filtered log shows how the maths actually feels. Five consecutive trades: plus $940, plus $750, minus $500, plus $750, plus $250 — a net of plus $2,190, which is 4.38R at $500 of risk. The losing trade in that slice is the one that matters most: it was a clean setup, inside the fade zone, with the ADX below 20, and it still lost, because no system removes losing trades. What the filters remove is the losing trades that were never good ideas in the first place. That is a smaller promise than most strategy guides make, and it is the only one I have ever been able to verify in my own log. I checked the same twenty trades against the strategy expectancy calculator afterwards: 13 wins from 20 trades at an average win of 1.31R against an average loss of 1.0R gives an expectancy of +0.50R per trade, which is a real edge, and it only survives if every trade risks 0.5% and no single day ever approaches the $5,000 limit.
| Test | Trades | Wins | Losses | Net | Net dollars |
|---|---|---|---|---|---|
| Filtered (full six rules) | 20 | 13 | 7 | +10R | +$5,000 |
| Unfiltered (fade every 2.0 touch) | 27 | 11 | 16 | -2R | -$1,000 |
| Filter value | -7 trades | +2 wins | -9 losses | +12R | +$6,000 |
| Five-trade slice (filtered) | 5 | 4 | 1 | +4.38R | +$2,190 |
| Best single trade | — | — | — | 1.96R | $940 (18.8% of net) |
When mean reversion fails
Mean reversion fails in exactly the conditions where every fading strategy fails, and knowing the list in advance is what keeps the failures cheap. On a trend day the average itself is moving, so the price that looks stretched is actually just keeping up — my rule is that if the last two fades both lost, I stop taking fades for the rest of the session, because the market has told me it is trending and I should believe it. Around red-folder news the stretch can print and reverse inside one bar, so I take no fade entry within 30 minutes either side of a major release. The moving-mean trap is subtler: when the 20-period average is sloping hard, the mean you are targeting is not where it was when you entered, and TP1 moves away from you while you hold; I check the slope of the average before entry, and if it has moved more than half a standard deviation in the last five bars, the fade is unconfirmed. And the weekend gap is the one that hurts most: a Friday fade held over the weekend can gap straight through the stop on Sunday open, which is why I never hold a mean-reversion trade over the weekend — ever.
The remaining failure is mine, not the strategy’s: fading a stretch that is still stretching. The z-score at +2.0 can go to +2.5 and then to +3.0, and every early entry along the way is a stop. The turn gate exists precisely because of this, and the one time I broke it — the Thursday that opens this article — it cost me $640. When I am tempted to enter early now, usually after a losing day, I re-read my overtrading guide instead. The personal daily stop is the other guardrail: mine is $1,500, below the firm’s $5,000 limit, and if two $500 losses would take me past it, the system stays off for the day.
| Failure mode | How it looks on the chart | What it costs | My rule |
|---|---|---|---|
| Trend day | ADX rising above 20, fresh 20-day extreme prints | A stop per fade, all in the same direction | Two losing fades in a row means no more fades that session |
| News spike reversal | Stretch prints on the news bar, then reverses inside one bar | Full stop on a move that never existed | No entries 30 minutes either side of red-folder news |
| Moving-mean trap | 20-period average sloping hard, TP1 drifting away | A winner that never reaches its target | Fade unconfirmed if the average moved over 0.5 SD in 5 bars |
| Fading the stretch early | Z-score at 2.0, then 2.5, then 3.0 | Repeated stops into a move still stretching | Never enter before the turn bar closes back inside 2.0 |
| Weekend gap | Friday fade held over the weekend, Sunday gap through the stop | A gap loss bigger than the planned risk | Never hold a mean-reversion trade over the weekend |
| Beyond-3.0 extreme | Z-score past 3.0, usually a genuine breakout | Shorting a breakout at its strongest moment | No fades beyond 3.0, in either direction |
Mean reversion vs range fade: same family, different trade
Mean reversion is not the first fading strategy in this series — my range fade strategy already trades the same idea — so here is exactly how the two differ, and when I reach for each. The range fade trades the boundaries of a visible range: it sells the top of the box and buys the bottom, with the stop beyond the boundary and the target at the opposite boundary. Mean reversion trades a statistical stretch: it sells when price is two standard deviations above its average, with the stop beyond the extreme and the target at the average itself. The range fade needs a range you can draw; mean reversion needs an average you can measure. On a clean, flat, well-defined range, the range fade is the better trade, because the boundaries are visible and the targets are further away. On a messy, drifting, hard-to-draw chart, mean reversion is the better trade, because the average is always defined even when the range is not.
The two systems also fail differently, which is why I keep both. The range fade fails when the range breaks — the boundary that held five times breaks on the sixth, and the fade becomes a breakout trade taken the wrong way. Mean reversion fails when the regime changes — the average starts moving and the stretch stops being a stretch. My z-score indicator guide covers the measurement itself in depth, and my Bollinger Bands guide covers the bands version of the same idea — price stretched two deviations from its average is, in band terms, price touching the outer band. One trigger per trade, whichever system gives it: if mean reversion gives the entry, mean reversion manages the exit, and the range fade does not get a vote.
| Feature | Range fade | Mean reversion |
|---|---|---|
| What defines the setup | Visible range boundaries, drawn on the chart | Z-score beyond plus or minus 2.0 |
| Entry trigger | Rejection candle at the boundary | Turn bar closing back inside 2.0 |
| Stop placement | Beyond the range boundary | 0.5 SD beyond the extreme |
| Target | Opposite boundary of the range | The 20-period mean, then 1 SD beyond |
| Regime filter | Range must be defined and respected | H4 ADX below 20 |
| Best market | Clean, flat, well-defined range | Messy, drifting, hard-to-draw chart |
| Main failure | Range breaks on the sixth test | Regime turns to trend mid-trade |
My daily mean-reversion routine
The routine takes fifteen minutes and it is the same every day, because a routine is what stops a funded trader from improvising with the firm’s money. At the London open I check the H4 ADX and note whether the session allows fades at all, then I write down the one direction I am allowed to fade — or the words “no fades today” if the ADX is above 20. Then I check the H1 z-score on EURUSD and GBPUSD, and if neither pair is near 2.0 I mark the session as waiting and trade nothing until a stretch appears. I set my personal daily stop at $1,500, below the firm’s $5,000 limit, and I write it on the same note as the regime, because the day I skip that step is the day I discover what a $5,000 loss feels like. During the session I take at most two fades, only on closed-bar turns, only inside the fade zone, and never within 30 minutes of news. At the close I log every stretch the market gave me, taken or skipped, with the reason, because the skipped stretches are the data that keeps the filter honest. My position sizing guide has the full grid I size from, and my RSI guide covers the momentum check I run alongside the z-score when a stretch looks borderline.
| When | Step | What I check | Pass or stop |
|---|---|---|---|
| 07:00 PKT | Regime check | H4 ADX below 20, no fresh 20-day extreme | Above 20 means no fades today, written down |
| 07:05 PKT | Stretch scan | H1 z-score on EURUSD and GBPUSD near 2.0 | Neither near 2.0 means waiting, not trading |
| 07:10 PKT | Daily stop set | Personal stop at $1,500, firm limit $5,000 | Stop written down before any trade |
| London session | Entries only | Closed-bar turn, inside the 2.0 to 3.0 zone | Maximum two fades per day |
| News windows | Blackout | No entries 30 minutes either side of red-folder news | Standing rule, no exceptions |
| After each trade | Risk check | Size from the grid, rounded down | Never more than 0.5% per trade |
| Session close | Log | Every stretch, taken or skipped, with the reason | Skipped stretches are the filter’s report card |
Frequently asked questions
What z-score is best for mean reversion trading?
Plus or minus 2.0 on the H1 chart, using a 20-period simple moving average and a 20-period standard deviation. That is the value my twenty-trade test was run on: below 2.0 the market is still stretching half the time, and at 2.5 the setups are so rare you spend the week waiting. A complete mean reversion guide agrees on the 2-standard-deviation entry zone and the ranging-market condition, and adds the same warning I give here — the strategy works only in ranging markets, confirmed with ADX below 20 or contracting Bollinger Bands (Quantum Algo mean reversion trading guide).
Can mean reversion pass a prop firm challenge?
It can, and only with the regime filter attached. In my test the filtered system made 10R over twenty trades, which is a solid edge, but that edge only survives if every trade risks 0.5% and no single day ever approaches the $5,000 limit. The unfiltered version of the same system lost money on the same twenty setups. Treat the z-score as the trigger and the risk rules as the strategy, and the challenge becomes a matter of executing the same plan twenty times without improvising.
Why does my mean reversion trade keep losing in trends?
Because in a trend the average itself is moving, so the price that looks stretched is actually just keeping up. The fix is the regime gate, not a different trigger: check the H4 ADX before every fade, and if it reads above 20, mean reversion is off for the session. My rule is two losing fades in a row means the regime has changed and I stop for the day — that rule cost me two stops the first time it fired and has saved me at least five since.
Is mean reversion the same as range trading?
Same family, different trade. Range trading sells the top of a visible range and buys the bottom, with the target at the opposite boundary. Mean reversion sells a statistical stretch measured by the z-score, with the target at the average itself. On a clean, flat range, the range fade is the better trade; on a messy, drifting chart, mean reversion is better, because the average is always defined even when the range is not. I keep both systems and use one trigger per trade.
What timeframe works best for mean reversion on a funded account?
H1 for entries and H4 for the regime check. H1 gives two to four setups a week, which is enough to matter and few enough to stay selective. M15 gives noise — the z-score stretches and snaps back inside a single hour, and the spread eats the edge. D1 gives almost nothing, and a daily fade held overnight carries gap risk a funded account should not take. My rule is H1 entries, H4 direction, and never a fade held over the weekend.
How much should I risk per mean-reversion trade?
0.5% of the account, which is $500 on a $100,000 funded account, sized from the stop distance and always rounded down. My risk-per-trade guide explains why more risk per trade is just a faster way to the same loss, and the sizing grid in this article shows the exact lots for every stop distance from 15 to 50 pips. If a single $500 loss would take you past half your daily loss limit, the system stays off for the day.
Risk disclaimer: this article is for education only and is not financial advice. Trading on a funded account can lose the challenge fee and the account. Never risk money you cannot afford to lose, and always read your firm’s rules before trading a new strategy live.



