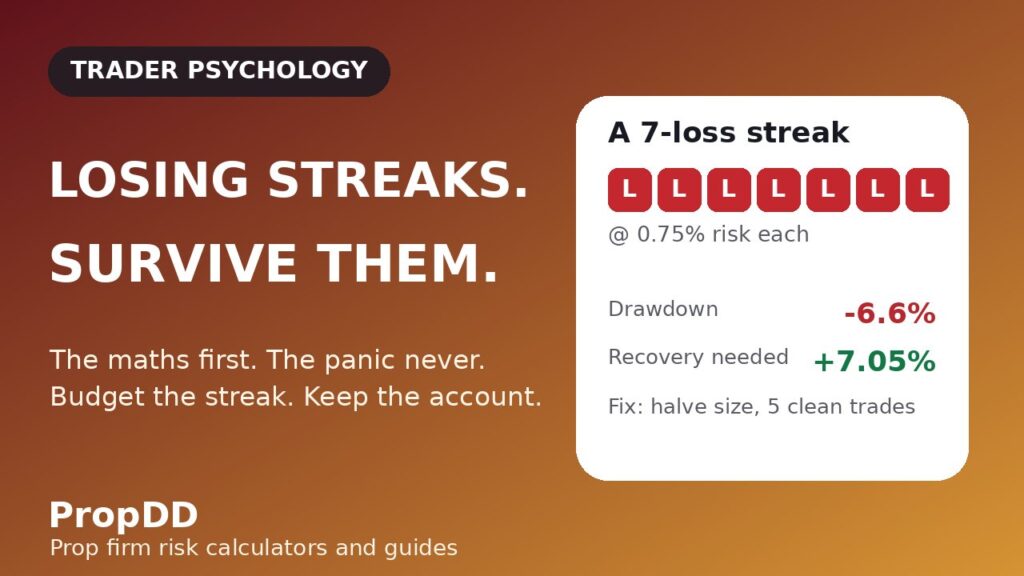
My third challenge attempt died on a Tuesday afternoon in the middle of seven consecutive losses. Not seven catastrophic losses — nothing dramatic enough to tell anyone about. Just seven ordinary, small, correctly-sized trades that all went wrong: a stopped-out EURUSD long, a GBPUSD breakout that wicked my entry then ran without me, two gold scalps that chopped sideways into their stops, and three more entries that looked perfect on the chart and failed anyway. At 0.75% risk each, seven losses should have cost me 5.1% of the account. The daily loss limit was 5%. I had spent almost an entire day’s risk budget in four hours, and the part that embarrassed me was not the money — it was that I had done the arithmetic for my win rate a hundred times in backtests and still treated a seven-loss streak as something that happened to unlucky people.
In this article
- Losing Streaks Are a Maths Problem First, a Mindset Problem Second
- What a 5% Daily Loss Limit Does to Your Streak Budget
- I Tested It: How My Longest Recovery Actually Played Out
- The Five Mistakes That Turn a Streak Into a Blown Account
- My 24-Hour Reset Routine After a Losing Run
- When the Streak Means Your Strategy Is Actually Broken
- The Funded-Account Losing-Streak Protocol
- Losing Streak Questions Traders Ask Me Most
That evening I finally sat down and worked out the actual maths of losing streaks on a funded account, and it changed how I trade challenges permanently. Here is the uncomfortable truth: if your win rate is 45%, you should expect a run of eight or nine consecutive losses somewhere inside every 200 trades. Not because your strategy is broken. Not because the market has it in for you. Because probability says so. A losing streak on a funded account is therefore a maths problem before it is a mindset problem — and the traders who survive it are the ones who budgeted for it in advance instead of panicking when it arrived.
Losing Streaks Are a Maths Problem First, a Mindset Problem Second
Most traders evaluate losing streaks emotionally — “I am doing something wrong” — instead of statistically. The starting point is a simple formula. If your win rate is w, the probability that any given run of n consecutive trades are all losses is:
Probability of n consecutive losses = (1 – w)n
Expected longest losing streak in N trades ≈ ln(N) / ln(1 / (1 – w))
Run the numbers and the pattern is stark. With a 45% win rate, the chance that the next seven trades all lose is about 1.5% — small on any given day, but across 200 trades you will start roughly three separate seven-loss runs. And the longest streak you should expect inside 200 trades is around eight or nine losses. Here is the full picture:
| Win rate | Chance of 5 losses in a row | Chance of 7 losses in a row | Expected longest streak in 200 trades |
|---|---|---|---|
| 40% | 7.8% | 2.8% | ~10 losses |
| 45% | 5.0% | 1.5% | ~9 losses |
| 50% | 3.1% | 0.8% | ~8 losses |
| 55% | 1.8% | 0.4% | ~7 losses |
Two consequences follow. First, a run of five to nine losses is not evidence that your strategy is broken — it is evidence that you have taken enough trades for statistics to show up. Second, and this is the funded-account part: a streak you did not budget for is a streak that will push you toward decisions you would never make on a calm day. The maths does not make the losses painless, but it does make them predictable, and predictable problems get protocols while surprises get panic.
What a 5% Daily Loss Limit Does to Your Streak Budget
On a personal account, a losing streak costs you money. On a funded account, it costs you money and daily-limit room, and the second cost is the one that ends challenges. The typical setup is a 5% daily loss limit and a 10% maximum drawdown. Your risk per trade therefore buys you a fixed number of consecutive losses before the day is over:
| Risk per trade | Consecutive losses before a 5% daily limit is gone | Verdict for streak survival |
|---|---|---|
| 2.0% | 3 losses | One bad morning ends your day — no streak room at all |
| 1.0% | 5 losses | A normal streak burns the whole daily budget |
| 0.75% | 7 losses | Survives an average streak, but nothing longer |
| 0.50% | 10 losses | Survives even the worst expected streak in one day |
Read that table against the streak maths above and the lesson is plain: at 1% risk per trade, a statistically normal losing streak consumes your entire daily loss allowance. That is why so many traders blow challenges during unremarkable streaks rather than dramatic ones — the daily limit is a hard wall, and a streak walks you into it quietly. My personal fix is to trade the challenge at 0.5% and only scale to 0.75% once I am funded, and to keep a personal daily stop well below the firm’s limit so a streak stops me before the firm does. If you want the full sizing logic, my risk-per-trade guide works through the same budget arithmetic trade by trade.
I Tested It: How My Longest Recovery Actually Played Out
Theory is cheap, so here is a real losing streak from my journal: nine consecutive losses on a $100,000 challenge, risking 0.75% per trade, for a drawdown of roughly 6.6%. What surprised me was not the loss — the streak maths above says a nine-loss run is expected at a 45% win rate — but the recovery. Getting back from -6.6% does not require +6.6%. Because you are earning on a smaller base, the required gain is d / (1 – d), so 6.6% down needs 7.05% up. Here is how that run actually recovered:
| Metric | Planned | What actually happened |
|---|---|---|
| Drawdown from the streak | ~6.6% | 6.6% — matched the estimate almost exactly |
| Gain needed to recover | 7.05% | Confirmed with the recovery formula before restarting |
| Risk per trade during recovery | Cut to 0.5% | 0.5% for the first two weeks — the hardest discipline of the whole process |
| Days to break even | ~10 | 14 days, averaging +0.6% per day — slower because of the smaller size |
| Temptation to double risk | Expected | Arrived on day 3; the journal entry where I refused is the entry I am proudest of |
The recovery took longer than the maths said it should, and that was entirely because of smaller size. Smaller size is what makes recovery possible at all on a funded account — the same 9-loss streak at 2% risk would have been an 18% drawdown, and no funded account survives that. If you want to model your own numbers, the consistency rule guide explains why uneven recovery days also create compliance problems, and a funded-trader drawdown walkthrough covers the same survive-the-streak logic from another firm’s data.
The Five Mistakes That Turn a Streak Into a Blown Account
In every journal I have kept, the streak itself never killed the account. What killed it was one of these five reactions:
| # | Mistake | What it actually costs |
|---|---|---|
| 1 | Doubling size to “get it back faster” | Turns a survivable 6.6% drawdown into an account-ending 13% one — three more losses at double size finishes what the streak started |
| 2 | Moving the stop on a losing trade | Destroys the streak budget table above; one “temporary” widened stop can eat a whole day’s allowance |
| 3 | Adding a second strategy mid-streak | Mixes two unmeasured edge profiles — you no longer know your win rate, so the streak maths no longer protects you |
| 4 | Trading more pairs to “find winners” | Multiplies the loss count per day; five pairs each losing once is a five-loss streak with no single trade to blame |
| 5 | Skipping the journal because “I know what happened” | Deletes the only evidence that would tell you whether the streak is normal variance or a broken strategy |
Mistakes one and two are the classic pair — I have committed both, and revenge trading is what mistake one looks like when you stop being honest with yourself. The rule I trade by now is simple: the streak changes my size and my schedule, never my stops and never my strategy.
My 24-Hour Reset Routine After a Losing Run
When I hit five consecutive losses, I stop for the day — that is my personal stop, below the firm’s limit. Then the reset routine starts. It is deliberately boring, because boring is the point:
| When | Action | Rule |
|---|---|---|
| Immediately | Close the platform, write the day’s journal | No “one more trade to fix it” — the decision to stop was made before the day started |
| Same evening | Log all five losses: entry, stop, target, outcome | If all five followed the plan, the streak is variance — say so out loud |
| Next morning | No trading before 11:00; review the week’s stats | Compare the streak length against the expected longest streak for your win rate |
| Next session | Halve position size for the next 5 trades | Half size, full rules — the edge is unchanged, only the exposure drops |
| After 5 clean trades | Restore normal size only if all five followed the plan | Process compliance is the gate, not profitability |
The step traders skip is the journal entry that says “all five followed the plan.” Writing that sentence forces you to check whether it is true, and it is the difference between disciplined patience and blind hope. My trading journal guide has the exact template I use for streak reviews.
When the Streak Means Your Strategy Is Actually Broken
Not every streak is variance. Sometimes the market regime changed, your edge decayed, or you were never trading an edge at all. The difference between a normal streak and a broken strategy is sample size and expectancy, not feelings:
- Check the sample size. A streak of 8 inside your first 30 trades means nothing; the same streak after 300 trades with a known 50% win rate deserves attention. Do not judge a strategy on fewer than 100 trades.
- Recompute expectancy. If (win rate × average win) – (loss rate × average loss) is still positive across your full sample including the streak, the edge is intact and the streak is noise.
- Look for regime drift. Did your losses cluster in one session, one pair, or one volatility regime? A trend strategy breaking in a ranging month is not broken — it is misapplied. My streaks cluster in thin August and December markets; now I simply trade less in those months.
- Audit the entries, not the outcomes. If your journal shows you followed every rule and lost, that is variance. If it shows widened stops, skipped confirmations, or “intuition” entries, the strategy did not break — you did, and the fix is process, not a new system.
The honest version: in four years of journaling, I have declared a strategy broken exactly twice. Every other “broken strategy” was a normal streak plus impatience. Changing systems during a streak is the most expensive decision a funded trader can make, because it resets your sample size to zero at the exact moment you need data the most.
The Funded-Account Losing-Streak Protocol
Putting it all together, here is the protocol taped to my monitor — streak length on the left, action on the right:
| Consecutive losses | Action |
|---|---|
| 3 | Normal variance. Halve position size for the next session; keep everything else identical. |
| 5 | Stop for the day. Journal every loss. Confirm each one followed the plan before trading again. |
| 7 | Take 24–72 hours off the charts. Review the week’s stats against the streak maths above. Return at half size. |
| 10+ | Full strategy audit: 100+ trade sample, expectancy recalculation, regime check. Do not trade the challenge until it is done. |
Notice what is not in the table: increasing size, changing strategies, widening stops, or adding pairs. The protocol only ever reduces exposure or pauses trading, because on a funded account the drawdown limit is the real opponent and the streak is just how it attacks.
And for challenge-specific numbers, I built the Minimum Trading Days Tracker — log each day’s P&L and it tells you your days remaining, your profit pace, and whether that pace is sane against your daily loss limit.
Losing Streak Questions Traders Ask Me Most
How many consecutive losses are normal on a funded account?
With a 45–50% win rate, a run of 7–9 consecutive losses inside 200 trades is statistically normal — the expected longest streak formula above puts it at roughly eight. What matters is not the streak length but the drawdown it creates: at 0.5% risk per trade, nine losses cost 4.4% and you keep trading; at 2%, the same streak ends the account.
Should I reduce risk during a losing streak?
Yes — it is the single highest-leverage response. Halving size after three losses does not change your edge, but it roughly doubles the number of consecutive losses your daily limit can absorb. Never increase size during a streak; the recovery formula d/(1-d) punishes every extra percent of drawdown.
Does a losing streak violate the consistency rule?
Not by itself. The consistency rule targets profit concentration — one lucky day making most of your gains — not loss distribution. A losing streak can only cause a consistency problem indirectly, if you then chase recovery with oversized winners. Keep recovery trades normal-sized and the rule stays satisfied.
How long should I stop trading after a bad run?
At least until the next session for a five-loss day, and 24–72 hours off the charts after seven or more. The break is not about “clearing your head” in some vague sense — it is about breaking the feedback loop where each new loss raises the emotional stakes of the next trade. A genuine reset needs sleep, not just a quiet afternoon.
Can a losing streak breach the daily loss limit without a single big loss?
Easily, and this is the most common way challenges die. Five ordinary 1% losses equal a 5% daily limit with no single trade to blame. Floating losses count too — if your platform marks equity against the daily limit, open drawdown during the streak consumes allowance before any trade closes. Size for the streak, not for the single trade.
When is a losing streak a sign the strategy is broken?
When the full-sample expectancy including the streak turns negative, or when losses cluster in a regime your strategy was never designed for. One streak inside 100+ trades of positive expectancy is variance. Three streaks in a row with deteriorating expectancy is a strategy problem. The journal — not your mood — decides which one you have.
Risk disclaimer: trading funded and personal accounts involves substantial risk of loss. Losing streaks are a normal statistical feature of any trading strategy; nothing here guarantees any outcome. Never trade capital you cannot afford to lose, and always follow your prop firm’s official rules over any guide.




7 comments
[…] and the fixes kept failing — because they are different leaks with different triggers. After my losing-streak reset plan work, I finally split them […]
[…] The trades I took after lunch were not my strategy. They were my ego looking for an encore. The losing-streak article I wrote earlier covers the mirror image: after losses, traders tighten up and revenge-trade. After wins, traders loosen up and […]
[…] of the trade, which is exactly what it is for. Related reading on the same discipline: my notes on losing streaks on a funded account and on setting a personal daily stop below the firm […]
[…] rules, and breaking any one of them used to be how accounts ended. I learned them the hard way, and my losing-streak reset plan covers the psychology side in more […]
[…] being tough, he is spending his daily limit on decisions made by the worst version of himself. The losing streak guide on this site makes the same point from the other side: a streak is rarely a strategy problem, it is […]
[…] One loss and the %R session ends; see the losing streak reset plan […]
[…] losing streak does not breach accounts; the behaviour after it […]