Almost every trader I’ve read about has the same story with journals. They start one with great energy, build a spreadsheet with twenty-two columns, fill it in for nine days and then quietly stop. The journal wasn’t useless. It was just too heavy to carry.
In this article
- Why most journals die
- The minimum that's worth keeping
- The two columns nobody adds
- A layout that fits on a phone
- Screenshots beat descriptions
- Prop firm extras worth a line
- The five-minute weekly review
- Numbers worth looking at monthly
- Spreadsheet, app or notebook?
- An imaginary week, filled in
- Being honest with it
- Using the journal to set your risk
- What to skip
- Journaling on the bad days
- A starter spreadsheet, formula by formula
- A sixty-second end-of-day habit
- When the numbers look good and you still feel bad
- Frequently asked questions
- The short version
If you’re trading a prop firm account, a journal matters a bit more than it does on a personal account, because the rules around you are tighter and the cost of a repeated mistake is a lost fee. This article is about keeping one that survives contact with real life: what to write down, what to ignore, and how to turn the notes into something that changes what you do on Monday.
Why most journals die
They die of effort. Logging every detail of every trade takes ten minutes, and at the end of a long session ten minutes feels like a punishment. So the entries get shorter, then sloppy, then skipped, and by week three there’s a gap that feels too embarrassing to fill.
The fix is boring: write less. A journal with seven columns that you fill in every day beats a perfect one you abandon. You can always add a column later. You can’t recover a month of data you never recorded.
The minimum that’s worth keeping
For each trade, I’d keep the date, the instrument and direction, the entry, the stop and the target, the risk in dollars, and the result in dollars. That’s it for the mechanical side. If you want to measure results in R (your risk per trade as one unit), add a column for that, because it lets you compare a $250 risk trade and a $500 one fairly.
Then add two columns that most templates leave out, and which matter far more on a prop account than any indicator setting.
The two columns nobody adds
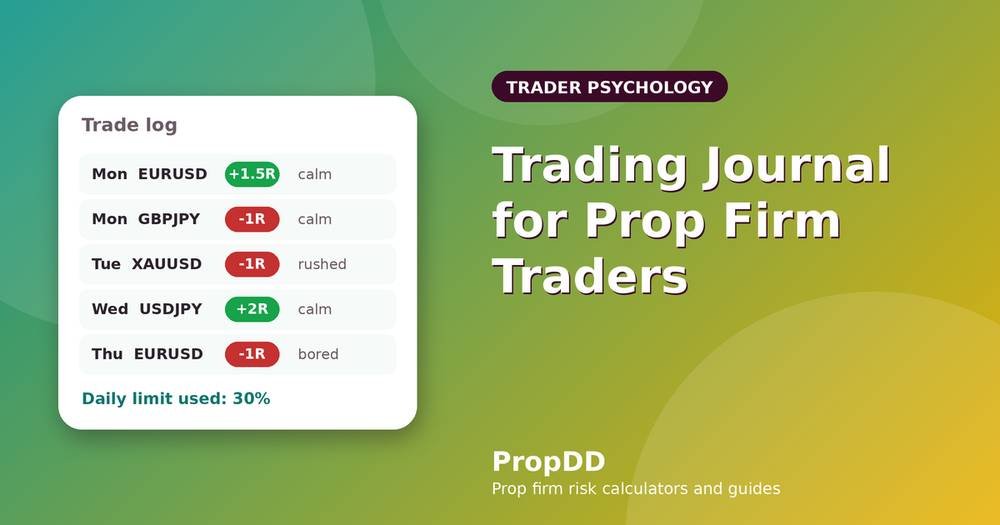
The first is daily limit used, written once at the end of each day as a percentage. If your limit is $5,000 and you finished the day down $1,500, that’s 30%. It takes three seconds and it’s the most honest number in the whole sheet. After a month you’ll see how often you wander into the dangerous zone, and you’ll see it without anyone lecturing you. The drawdown calculator gives you the figure if you’d rather not do the sum.
The second is a single word for how you felt when you took the trade: calm, rushed, bored, angry, confident, tired. Not an essay. One word. It feels silly for about a week. Then you notice that your worst losses cluster around “rushed” and “bored”, and you’ve learned something no chart could have told you.
A layout that fits on a phone
| Column | Example | Why it’s there |
|---|---|---|
| Date / pair / side | 12 Oct, EURUSD, long | Basic record |
| Entry / stop / target | 1.0850 / 1.0825 / 1.0900 | Check the plan was followed |
| Risk ($) | $400 | Keeps size honest |
| Result ($ and R) | −$400, −1R | Compare trades fairly |
| Mood (one word) | rushed | Spots emotional patterns |
| Daily limit used (end of day) | 30% | Tracks closeness to the wall |
That table is your whole journal. If you can’t fill it in on a phone in under a minute per trade, it’s too much.
Screenshots beat descriptions
Take a picture of the chart at entry and another at exit. A screenshot captures the context you’ll forget: the trend, the nearby levels, the news candle. Three weeks later, “I took a long because the setup looked good” tells you nothing, while the picture shows you exactly what “looked good” meant at the time. Most platforms let you save an image in two clicks, and a folder per month keeps things tidy.
Prop firm extras worth a line
Because you’re living inside someone else’s rules, a few extra notes pay off. Write your equity floor and personal stop at the top of each day’s page. Note the reset time in your own time zone, since it’s an easy thing to get wrong; the guide to the daily drawdown reset time shows how to find it. And if you ever hit your personal stop, say so, along with what happened in the hour before. That entry is gold.
The five-minute weekly review
This is the part that turns a diary into a tool. Once a week, ideally on a Sunday when nothing is at stake, read the week and answer a few questions on paper. How many trades did I take, and how many followed the plan? What was my worst day, in percent of the limit? Did I break my own stop? Which mood word appears next to the losses? What’s one thing I’ll do differently next week?
Notice the last one is singular. Choose one change. People who try to fix five habits at once fix none. If the review keeps showing the same thing, say, you take extra trades after 3 p.m., then the fix is a rule, not more willpower: no new trades after 3 p.m.
Numbers worth looking at monthly
Once you’ve got thirty or forty trades, a few figures become meaningful. Average win and average loss in R. How often you win, though be careful, because a high win rate with tiny winners and big losers is a trap. The deepest drawdown of the month as a percent of the daily limit. And your best and worst weekday, if there’s a clear pattern. With fewer than thirty trades, don’t read too much into any of it. Small samples lie, and they lie confidently.
It’s tempting to chase every statistic. Don’t. The two figures that most reliably improve a prop trader’s results are the daily limit used and the share of trades that followed the plan. Everything else is detail.
Spreadsheet, app or notebook?
Whichever you’ll open. A spreadsheet is flexible and free. A paper notebook is slow, which, oddly, helps some people think. Tracking services such as Myfxbook record your trades automatically and give you charts of equity and drawdown, which is handy for the numbers, though they can’t capture how you felt, so you’d still add a note for that. Charting platforms like TradingView are good for saving annotated screenshots. Pick one main place and stick to it.
An imaginary week, filled in
Here’s how it might look for a trader risking $300 on a $60,000 account. Monday: two trades, one win at +1.5R and one loss at −1R, both noted as “calm”, 5% of the limit used. Tuesday: three trades, all losses, moods “rushed”, “rushed”, “angry”, and 45% of the limit used. On Tuesday evening the trader writes: “Took the third trade after the second stop was hit by two pips. Wanted it back.” Wednesday: no trades, a note to review. Thursday: one trade, win, calm. Friday: two trades, one loss.
At the Sunday review, the pattern is obvious. Both bad days started with a trade taken in a hurry. The one change for next week: after any loss, wait fifteen minutes before the next entry. It’s specific, it’s small, and it came straight from the notes. That’s what a journal is for. Our article on revenge trading and the daily loss limit picks this theme up in more depth.
Being honest with it
A journal is only as good as its honesty. It’s easy to leave out the trade you’re embarrassed about, or to write “followed the plan” when you didn’t quite. Nobody is checking. That’s both the freedom and the risk. A trick that helps: write the entry before you look at the result, so the story isn’t shaped by whether you won.
It also helps to record the boring days. A day you took no trades because nothing met your rules is a success, and writing it down trains you to see it that way.
Using the journal to set your risk
After a month, look at your deepest daily drawdown. If it regularly reaches half your limit, you’re risking too much per trade, whatever the maths says. If it never goes past 15%, you’ve probably got room to increase risk slightly, slowly. This is a much better way to adjust than guessing, and it connects directly to the method in how much to risk per trade.
What to skip
You don’t need to record every indicator reading, a grade for each trade out of ten, or a paragraph of reflection on a four-pip scalp. You don’t need to color-code anything. You don’t need a fancy template downloaded from a stranger. If a field hasn’t changed a decision in a month, delete it.
Journaling on the bad days
The days you least want to write are the days that matter most. After a stop-out streak, your instinct is to close the laptop and pretend it didn’t happen. Do the opposite, but keep it small: three lines. What happened. What I felt. What the rule says I should have done. Nothing more. You aren’t writing a confession, you’re collecting evidence, and evidence from bad days is worth ten times the evidence from good ones.
It also helps to write the entry the same evening, while the details are fresh. By the next morning the story has already started to improve itself.
A starter spreadsheet, formula by formula
If you go the spreadsheet route, you only need four formulas. Result in R is the result in dollars divided by the dollar risk, so −$400 on a $400 risk is −1R and +$600 is +1.5R. Daily limit used is the start-of-day equity minus the end-of-day equity, divided by the max daily loss, shown as a percentage (and zero if you finished the day up). Average R is the average of the R column over the month. And running drawdown is the gap between your highest equity so far and your current equity.
That’s all the maths a prop trader’s journal needs. Everything else is decoration. If you’d like the floor and daily limit for each day without doing the sum, the guide to calculating max daily loss walks through it.
A sixty-second end-of-day habit
Close the platform, open the journal, write the date and the daily limit used. Add the mood word for the day’s best and worst trade. If you broke a rule, say which one. Then write tomorrow’s floor and soft stop so they’re ready before you start. That’s it. The whole habit takes a minute, and it makes the next morning easier because the first decision is already made.
When the numbers look good and you still feel bad
Sometimes the journal says you had a perfectly fine week and you still feel on edge. Pay attention to that. It’s often a sign that your risk is a little higher than your comfort level, even if the maths allows it. Dropping risk by a quarter for a week costs you very little and tells you whether the unease goes away. If it does, keep the lower number. Comfort is part of the edge, and the journal is the only place that records it.
Frequently asked questions
How long does journaling take each day?
A minute per trade plus two or three minutes at the end of the day. If it takes longer, trim the columns.
Should I journal demo trades?
Yes, if you’re testing a plan. The habit matters as much as the data, and it’s free practice.
Do I need to share the journal with anyone?
No. Some traders find a trading friend helpful for accountability, but the journal is for you.
What if I miss a few days?
Just restart. Don’t backfill from memory; skip the gap and carry on.
The short version
Keep a journal small enough to survive a bad week. Track the trade, the risk, the result, the mood and the share of the daily limit used. Review it on Sunday, change one thing, and repeat. For the rule your numbers are measured against, see the prop firm max daily drawdown explained, and for a broader look at what can go wrong, why traders breach the daily loss limit. Investopedia’s overview of risk management is a useful background read if you want one.