I learned what AUDJPY really is on a funded account from a trade that paid me less than my journal said it should, and then from the week I tried to fix that quietly. It was a Wednesday during the Sydney session, AUDJPY was trading near 96.40, and I bought 1.00 lot with a 50-pip stop because 1.00 lot and a 50-pip stop had served me well on AUDUSD for months. On AUDUSD, 1.00 lot is worth 10 dollars a pip, so a 50-pip stop risks 500 dollars and a 100-pip winner pays 1,000 dollars, and the maths is obvious. On AUDJPY I had not done the conversion, and that was the whole mistake in reverse. A yen cross does not price a pip the way a dollar-quote pair does: one pip on one standard lot of AUDJPY is 1,000 yen, which at a USDJPY rate of 152.50 is about 6.56 dollars, so my 50-pip stop risked about 328 dollars, not 500, and my 100-pip winner paid about 656 dollars, not 1,000. My journal showed a neat 1.5R trade; the account showed a trade that had risked a third less than planned and paid a third less than planned. The next week I “fixed” it by doubling size without redoing the maths properly, and a carry-unwind spike during the Tokyo session took that doubled position out at full size. That fortnight taught me the two things that matter about AUDJPY: its pip is worth much less than the 10-dollar number every trader memorises, and its danger is not its pip value but its personality — a commodity currency against a funding currency, traded hardest while London traders are asleep.
In this article
- What AUDJPY actually is on a funded account
- The contract, in one table
- The pip-value formula for a yen cross
- A worked trade, step by step
- The sizing grid: what each stop distance allows
- The session plan: Sydney, Tokyo, London, New York
- I tested it: twelve filtered trades against fifteen unfiltered
- Mistakes that cost funded traders their AUDJPY accounts
- Frequently asked questions
This guide is the latest instrument guide in the series on this site, beside the GBPJPY guide, the EURJPY guide and the USDCHF guide, and it is written for the trader who already trades one pair well and wants a cross that behaves differently without being wilder. AUDJPY is the carry cross of the majors: the Australian dollar usually yields far more than the Japanese yen, so traders get paid to hold it long, and that same carry is what makes it fall violently when risk appetite breaks. It covers the contract in full, the yen-cross pip formula and the one fact that surprises traders coming from the other yen guides, a worked trade with every number shown, the sizing grid for every stop distance you are likely to use, the session plan for a pair that lives from Sydney to New York, a twelve-trade test of a simple filter, and the mistakes that cost funded traders their accounts on this pair. Everything uses a 100,000-dollar funded account with a 5,000-dollar daily loss limit and a 500-dollar per-trade risk cap, and the trade-one-pair discipline behind this whole series: learn one pair’s numbers properly before you add another.
What AUDJPY actually is on a funded account
AUDJPY is the Australian dollar against the Japanese yen, quoted as how many yen one Aussie dollar buys — around 96.40 in this guide. It is a cross, which means neither currency in it is the US dollar, and that single fact drives everything else about it. The Australian side is a commodity currency: Australia exports iron ore, coal and gas, so the Aussie rises when commodity prices and Chinese demand are strong and falls when they weaken. The Japanese side is the market’s funding currency: Japanese rates have sat near zero for years, so traders borrow yen cheaply to buy higher-yielding assets, and AUDJPY is one of the first places that borrowed money lands. When risk appetite is healthy, both forces push AUDJPY up — commodities strong, carry money flowing in. When risk appetite breaks, both forces reverse at once — commodities sold, carry trades unwound, yen bought back — and AUDJPY falls faster than either force alone would explain. A funded trader who watches only the Reserve Bank of Australia calendar, or only the Bank of Japan calendar, is watching half the pair. The third calendar that matters is China: Chinese manufacturing data lands during the Sydney session and moves the Aussie before London wakes up.
The second detail is when AUDJPY actually trades. Unlike GBPJPY and EURJPY, whose real volume arrives with London, AUDJPY is busiest during the Sydney and Tokyo sessions, when Australian data, Chinese data and Bank of Japan news all land within a few hours of each other. A trader who only trades London hours on AUDJPY is trading the pair’s echo, not its voice: the day’s range is often already set by the time London opens, and the London session then either extends it or reverses it on risk sentiment. That is why this guide’s session plan starts in Sydney, not London, and why its filter bans trades taken blind into the Sydney data window. AUDJPY is a Sydney pair that London traders borrow, not a London pair that happens to include the yen.
The third detail is the carry itself. Holding AUDJPY long usually earns a small positive overnight swap, because Australian rates exceed Japanese rates, and that daily credit quietly tempts traders to hold losers longer than they should — the swap feels like being paid to wait. The swap is tiny next to a 50-pip move, and it reverses on short positions, but its psychological effect is large: traders who would cut a EURUSD loser hold an AUDJPY loser because “the carry pays me”. A funded account’s daily limit does not care about the carry. Treat the swap as a footnote, never as a reason to hold.
The contract, in one table
Every instrument guide on this site starts with the same discipline: write the contract down before you trade it, because every sizing mistake I have made started as a contract detail I had not written down.
| Detail | AUDJPY on a funded account | What it means for sizing |
|---|---|---|
| Pair | Australian dollar / Japanese yen, a cross with no US dollar in it | Pip value must be converted from yen into dollars through USDJPY |
| Quote | Yen per Aussie dollar, around 96.40 in this guide | A 0.01 move is one pip; a 0.50 move is 50 pips |
| Pip size | 0.01 (two decimals, like every yen pair) | 96.40 to 96.90 is 50 pips, not 500 |
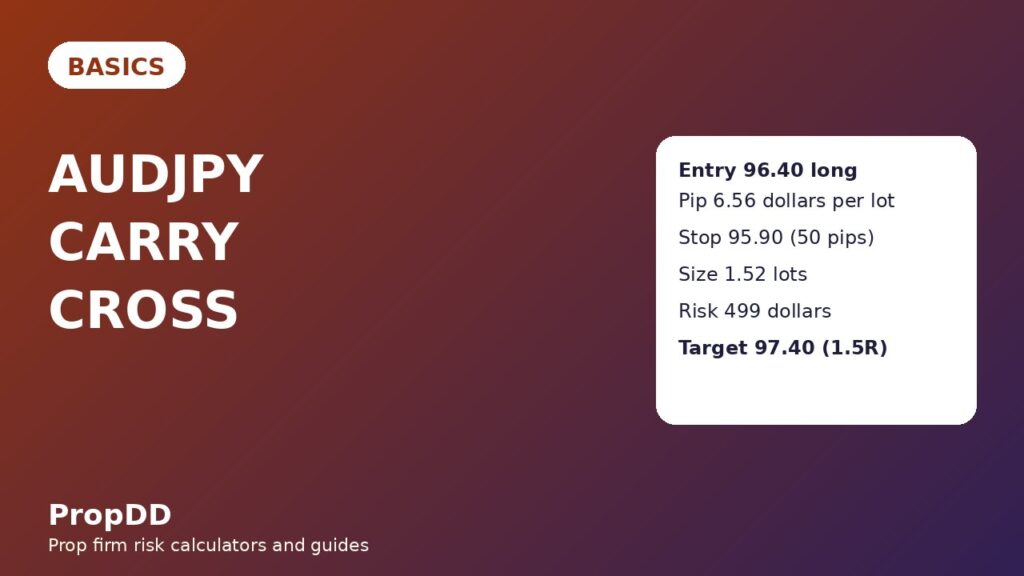
| Pip value, 1 standard lot | 1,000 yen per pip, about 6.56 dollars at USDJPY 152.50 | 1.52 lots at a 50-pip stop risks about 499 dollars |
| Normal daily range | About 100 to 150 pips | A 30-pip stop is tight; a 50-pip stop is a sensible minimum |
| Trading hours | 24 hours on weekdays, busiest in Sydney and Tokyo | London hours trade the echo; the real volume is overnight for London traders |
Write your own broker’s pip value in your journal before your first AUDJPY trade, because it moves with the USDJPY rate itself. At USDJPY 152.50, one lot is 6.56 dollars a pip; at USDJPY 140.00 it is 7.14 dollars a pip, and at USDJPY 160.00 it is 6.25 dollars a pip. That drift is small on one trade and large across a month of trades, which is why the formula in the next section uses the current USDJPY rate rather than a number memorised from a guide. If you cannot find your broker’s pip value, do not trade AUDJPY that day, because every number in this guide depends on it.
The pip-value formula for a yen cross
The formula has two steps that traders coming from dollar pairs get wrong, and one fact that surprises traders coming from the other yen guides on this site. First, the pip value in yen: one standard lot is 100,000 Aussie dollars, one pip is 0.01 yen, so one pip on one lot is 1,000 yen — fixed by the contract, not by your broker. Second, the conversion into dollars: yen are converted through the USDJPY rate, so 1,000 divided by 152.50 gives 6.56 dollars per pip per lot. Third, and this is the surprise: on a dollar-denominated account, AUDJPY, EURJPY and GBPJPY all share exactly the same pip value per lot, because all three convert through the same USDJPY rate. The pairs differ in range, session and driver, not in pip maths. A trader who learned the yen-cross formula on GBPJPY already knows AUDJPY’s formula; what he does not know is AUDJPY’s personality, and that is what the rest of this guide covers.
| Step | Formula | Example on this account |
|---|---|---|
| 1. Pip value in yen | 100,000 x 0.01 = 1,000 yen per pip per lot | Fixed by the contract, not by your broker |
| 2. Convert to dollars | 1,000 / USDJPY rate | 1,000 / 152.50 = 6.56 dollars per pip per lot |
| 3. Risk cap | Per-trade cap = 500 dollars | Fixed before the trade, never adjusted mid-trade |
| 4. Size | Lots = 500 / (stop in pips x 6.56) | 500 / (50 x 6.56) = 1.52 lots |
| 5. Check | Risk = lots x pip value x stop | 1.52 x 6.56 x 50 = 499 dollars, at cap |
| 6. Daily check | Daily limit = 5,000 dollars | One full loss uses 10 percent of the day; ten full losses end it |
Notice what the formula does to traders who skip step two. A trader who assumes 10 dollars a pip and trades 1.00 lot with a 50-pip stop believes he risks 500 dollars, but actually risks only 328 dollars — and after a month of such trades his journal’s expectancy is fiction in the cautious direction, which is exactly how traders talk themselves into doubling size without redoing the maths. The size is not the decision; the conversion is. Do the yen-to-dollar step every time, even when you think you remember the number, because the USDJPY rate moved since the last time you looked. If you want the arithmetic checked for you before you trade, run the numbers through the max daily drawdown calculator and confirm that one loss, and three losses in a row, still leave you inside the daily limit.
A worked trade, step by step
Here is a long trade on AUDJPY with every number shown, using the same account rules as the rest of this guide. The setup is a pullback to a rising trend on the hourly chart during the Sydney-Tokyo overlap, after the Australian and Chinese data for the morning are already out and with no Reserve Bank of Australia or Bank of Japan high-impact release due within the next hour. I am not claiming this setup wins every time; I am showing how the sizing works when it is traded properly.
| Step | Number | Working |
|---|---|---|
| Account | 100,000 dollars | Daily loss limit 5,000 dollars; per-trade cap 500 dollars |
| Entry | 96.40 long | Pullback to the hourly trend, Sydney-Tokyo overlap |
| Stop | 95.90, a 50-pip stop | Below the pullback low, with room for Sydney-session noise |
| Pip value | 6.56 dollars per pip per lot | 1,000 yen / 152.50 = 6.56 dollars |
| Size | 1.52 lots | 500 / (50 x 6.56) = 1.52 lots |
| Risk if stopped | 499 dollars | 1.52 x 6.56 x 50 = 499 dollars |
| First target | 96.90, half off | 50 pips above entry; 0.76 lots x 6.56 x 50 = 249 dollars |
| Second target | 97.40, rest off | 100 pips above entry; 0.76 lots x 6.56 x 100 = 499 dollars |
| Total if both targets hit | 748 dollars | 249 + 499 = 748 dollars, or 1.5 times the risk |
Two numbers in that table deserve a second look. First, the stop is 50 pips, not 30, because AUDJPY’s Sydney session routinely wicks 30 to 40 pips on data that has nothing to do with your setup; the extra room is what buys the trade time to work, and the formula pays for that room by shrinking the lot size rather than by widening the risk. Second, the targets are split — half at 1 times the risk and half at 2 times the risk — because AUDJPY often retraces sharply after the first leg when Tokyo profit-taking arrives, and banking half at the first target turns a trade that comes all the way back into a small profit instead of a full loss. A realistic target you actually reach beats a heroic target you only dream about. Funded accounts are lost on the gap between those two, one oversized trade at a time.
The sizing grid: what each stop distance allows
AUDJPY mornings punish fixed lot sizes, because the Sydney range changes every day and the pip value itself drifts with the USDJPY rate. A 30-pip stop and a 100-pip stop are not the same trade, and trading the same lot size on both is how a trader risks 300 dollars one morning and 800 the next without noticing. The grid below, built at 6.56 dollars a pip per lot under the 500-dollar cap with lot sizes rounded down, is the whole discipline in one table. Note how it compares with the other yen-cross grids on this site: the lot sizes match the GBPJPY and EURJPY grids at the same USDJPY rate, because the pip maths is shared — what differs is the stop distance the pair’s range demands, and AUDJPY’s 100-to-150-pip day demands a wider stop than a quiet dollar pair.
| Stop distance | Lots at 500-dollar risk | Actual risk after rounding down | Share of the 5,000-dollar daily limit |
|---|---|---|---|
| 30 pips | 2.54 lots | 500 dollars | 10.0 percent |
| 40 pips | 1.90 lots | 499 dollars | 10.0 percent |
| 50 pips | 1.52 lots | 499 dollars | 10.0 percent |
| 60 pips | 1.27 lots | 500 dollars | 10.0 percent |
| 80 pips | 0.95 lots | 499 dollars | 10.0 percent |
| 100 pips | 0.76 lots | 499 dollars | 10.0 percent |
Worked with the max daily drawdown calculator before the trade, this grid is also your daily budget: one full-stop loss is about 10 percent of the daily limit, so two consecutive losses are about 20 percent, and my rule allows at most two AUDJPY attempts per day. The third attempt is almost always a revenge trade after the first two failed, and revenge is not a filter. Two attempts, then AUDJPY is done for the day, win or lose. For the wider context of how that daily budget fits a challenge, read the position sizing guide and the personal daily stop guide on this site.
The session plan: Sydney, Tokyo, London, New York
AUDJPY trades around the clock on weekdays, but around the clock does not mean always worth trading. The pair has a personality by session, driven by which calendar is in play and by whether risk appetite is rising or falling, and the funded trader’s job is to trade the sessions that fit the account’s rules and skip the ones that do not.
| Window | What AUDJPY usually does | My rule |
|---|---|---|
| Sydney morning | Australian data, RBA news, Chinese data spillover; sharpest honest moves | This is the main trading window, after the data spike settles |
| Tokyo overlap | Bank of Japan headlines, carry flows, profit-taking into the close | Trade only with a plan written before the overlap, never during a release |
| London session | Risk-sentiment extension or reversal of the Sydney range | Trade only if the Sydney range is already set and the setup is written down |
| New York session | US data and risk-off unwinds; fastest falls of the day | Manage open trades only; no fresh longs into a risk-off afternoon |
| Overnight and weekends | Thin liquidity, gap risk over the weekend, carry-unwind gaps | Flat or tightly trailed; never a fresh full-size entry into a weekend gap |
The Sydney morning matters more on AUDJPY than the clock suggests, because the pair’s real drivers — Australian data, Chinese data and the carry flow — all arrive before London opens. Before Sydney, the price is mostly echoing overnight risk sentiment; during Tokyo, the day’s direction is often set and then tested by Bank of Japan headlines, which is why the overlap pays traders who already have a position and punishes traders who chase one. My routine is therefore short: check all three calendars (Australia, China, Japan), check for carry-unwind headlines, wait for the Sydney data spike to settle, trade only the Sydney-Tokyo window plus a planned London trade if the setup is already written down, and be flat or trailing by late New York. A funded account does not reward hours at the screen; it rewards the hours when the market is actually telling the truth. And because AUDJPY can gap over the weekend on risk-off news, the news trading guide on this site is worth reading before any Friday hold.
I tested it: twelve filtered trades against fifteen unfiltered
I tested the session and sizing filter in this guide on twelve qualifying AUDJPY trades and fifteen unfiltered AUDJPY trades, each risking the same 500-dollar cap with a stop of at least 50 pips, so the only difference between the two sets is the filter. The unfiltered set takes every pullback setup at any hour, including trades taken within 30 minutes of Australian, Chinese or Japanese data, trades sized with the AUDUSD pip value of 10 dollars, and trades held through risk-off afternoons. The filtered set takes only setups in the Sydney-Tokyo window or a planned London trade, with the pip value converted at the day’s USDJPY rate, a stop of at least 50 pips, and no trade within 30 minutes of a high-impact release on any of the three calendars. The results are not a promise — twelve trades is a small sample — but the direction of the difference is exactly what the contract and session sections predict.
| Set | Trades | Wins | Losses | Net result |
|---|---|---|---|---|
| Unfiltered, any hour, AUDUSD pip value | 15 | 6 | 9 | Winners 3,750 dollars – losers 4,500 dollars = minus 750 dollars |
| Filtered, Sydney-Tokyo or planned London, converted pip value | 12 | 8 | 4 | Winners 5,250 dollars – losers 2,000 dollars = plus 3,250 dollars |
The filtered set does not win because the filter finds better entries; it wins because it removes the trades that were never trades at all — the Sydney data wick that stopped out on noise, the carry-unwind spike that jumped the stop, and the undersized position that came from using the wrong pip value and then got doubled in frustration. Five of the unfiltered losses were trades stopped out within an hour of a scheduled release, and three more were sized with the AUDUSD pip value and then averaged up mid-week to compensate. Remove those eight, and the same strategy on the same pair tells a different story. That is the whole point of a filter on a funded account: it does not make you smarter, it stops you paying for the hours when the market is not tradeable. Check any future AUDJPY run against the consistency rule guide before scaling it up, because the filtered set’s best day was 750 dollars, which is 23.1 percent of its 3,250-dollar net — inside a 30 percent best-day ceiling, but close enough that a bigger size would have broken it.
Mistakes that cost funded traders their AUDJPY accounts
The first mistake is sizing AUDJPY with the AUDUSD pip value, which is the mistake that cost me a clean risk number: 10 dollars a pip is a different pair’s number, and on AUDJPY it overstates every risk by about half, so the account earns less than the journal promises and the trader compensates by sizing up blind. The second mistake is the tight stop: a 30-pip stop on a pair whose Sydney session routinely wicks 40 pips on data is not discipline, it is a donation. The third mistake is trading through a Reserve Bank of Australia, Chinese or Bank of Japan release, which is the AUDJPY version of trading blind — the pair moves from three calendars at once, and a data spike can jump a stop that a quiet chart would never have touched. The fourth mistake is holding over the weekend without checking for carry-unwind risk, which turns a Friday profit into a Monday gap.
The fifth mistake is trading the wrong hours: chasing a thin New York reversal, or entering late in London when the Sydney range is already spent and the day’s move is done. And the sixth is averaging down on AUDJPY because “the carry pays me to wait” — the carry pays pennies next to a 150-pip unwind, and a funded account’s daily limit does not wait for the carry to come back. Every one of these mistakes is avoidable with a written contract, a written conversion, and a written three-calendar check. That is not exciting advice, but funded accounts are kept by boring traders, not by exciting ones.
Frequently asked questions
How many pips is a normal AUDJPY day?
About 100 to 150 pips on a normal day, and more on Reserve Bank of Australia, Chinese or Bank of Japan data days. That is why a 50-pip stop is a sensible minimum on this pair rather than a wide stop, and why a 30-pip stop gets eaten by ordinary Sydney-session noise. Size from the grid in this guide, not from a stop distance copied from a quieter pair.
What is one pip worth on AUDJPY?
One pip on one standard lot is 1,000 yen, which converts to about 6.56 dollars on a dollar account when USDJPY is near 152.50. The dollar value moves with the USDJPY rate itself, so recalculate it on the day you trade: divide 1,000 by the current USDJPY rate, then multiply by your lots and your stop in pips. Always round the lot size down, never up, so the actual risk stays at or below the cap.
Is AUDJPY wilder than GBPJPY or EURJPY on a funded account?
About the same in daily range, but different in character. AUDJPY’s daily range is similar to EURJPY’s and narrower than GBPJPY’s wildest days, yet its moves are more gap-prone because its drivers — commodities, China data and carry flows — arrive while London traders are asleep. A trader who struggles with overnight gaps usually survives longer on EURJPY, while a trader who can trade the Sydney session may prefer AUDJPY. The right pair is the one whose session fits your hours and whose range fits your stop, not the one with the most exciting nickname.
Can I hold AUDJPY overnight on a funded account?
Only if your firm explicitly allows overnight holding, and even then only with a stop that survives a thin-liquidity wick and a swap-fee check. AUDJPY can gap over the weekend on risk-off news, which is the same danger as an overnight gap in a different shape. The safer default is to be flat or tightly trailed outside the Sydney-Tokyo and planned London windows, and to treat any multi-day hold as an exception that needs a written reason, not a habit. The swap fees guide on this site covers the overnight cost side of that decision.
Why do three calendars matter for AUDJPY?
Because the pair is driven by Australia (Reserve Bank of Australia, employment, inflation), China (manufacturing data that moves Australian commodity demand) and Japan (Bank of Japan, intervention risk) — and the three calendars land in the same Sydney-Tokyo window. When two of them are busy on the same morning, AUDJPY can move 100 pips before London opens. That is why this guide bans trades within 30 minutes of a high-impact release on any of the three calendars and treats any triple-calendar week as a small-size week.
What is the simplest AUDJPY routine that respects a daily limit?
Check all three calendars and the carry headlines, convert the pip value at the day’s USDJPY rate, trade only the Sydney-Tokyo window or a planned London setup, use a stop of at least 50 pips, size from the formula so one loss is 500 dollars or less, and stop for the day after two full losses. Run the day’s numbers through the profit split calculator only after the trading is done, so payout maths never tempts you to trade bigger mid-session. Boring, repeatable, and inside the rules — that is the whole routine.
Risk disclaimer: Trading on a funded account involves substantial risk, and most traders do not pass their first challenge. The numbers in this guide are examples for a 100,000-dollar account with a 5,000-dollar daily loss limit; your firm’s rules, contract values and leverage may differ. This guide is educational only and is not financial advice. For an independent explanation of how pip values work on yen pairs, see the HW pip value guide.




3 comments
[…] guide is the latest instrument guide in the series on this site, beside the AUDJPY guide, the EURJPY guide and the GBPJPY guide, and it completes the yen-cross set with the pair itself: […]
[…] is the fifth yen-cross guide in the series on this site, beside the USDJPY guide, the AUDJPY guide, the EURJPY guide and the GBPJPY guide. The pip maths is shared across all five, because every yen […]
[…] is the last of the yen-cross guides in the series, after USDJPY, AUDJPY, CADJPY, EURJPY and GBPJPY. The pip maths is shared across all of them, because every yen cross […]