I lost 500 dollars buying a stall, not a tower. It was a Thursday afternoon on EURUSD, price had fallen for three days, printed one long red candle, then went quiet for four small candles that barely moved. I told myself the quiet was the bottom, bought the fourth small candle, and watched a fifth small candle drift lower before a long red candle wiped out the whole stall and my stop with it. The pattern I thought I was trading had not finished yet. A tower bottom is not the quiet. It is the quiet plus the long green candle that ends it, and until that final candle closes, there is no pattern at all, only a market taking a breather that can end in either direction.
In this article
- What a tower top and a tower bottom actually look like
- The six rules I check before I call it a tower
- Tower top versus tower bottom at a glance
- Entry, stop loss and take profit, the exact levels
- The sizing maths under a 5,000-dollar daily limit
- The sizing grid: what each stop distance allows
- A worked tower bottom trade, candle by candle
- What the max-daily-drawdown calculator says about this trade
- Strict towers versus loose stalls, the 12-trade test
- Five real tower trades from my log
- When the tower fails, and what I do instead
- The mistakes that cost me money on towers
- My daily tower routine
- Frequently asked questions
This guide covers both halves of the pattern, tower tops and tower bottoms, as one strategy with one set of rules, beside morning star, evening star, island reversal, abandoned baby and harami. Morning and evening stars are three-candle reversals with a gapped middle candle. Island reversals need two gaps that both stay open. Abandoned baby needs a gapped doji. Harami needs one candle closing inside the previous body. A tower is different from all of them: it is a long candle, a stall of small candles, and a second long candle in the opposite direction, and the trade only exists when that second long candle has closed. Everything here uses a 100,000-dollar funded account with a 5,000-dollar daily loss limit and a 500-dollar per-trade risk cap, and the sizing maths is checked against the max daily drawdown calculator.
What a tower top and a tower bottom actually look like
A tower top forms at the end of a rise. First comes a long green candle that shows buyers still firmly in charge. Then the market stalls: three to five small candles that drift sideways in mixed colours, going nowhere, often inside a narrow band. Finally a long red candle drops through the stall and wipes out the gains of the first candle. The two long candles stand on either side of the stall like the walls of a tower, which is where the name comes from.
A tower bottom is the mirror image. After a fall, a long red candle shows sellers in control. Then a few small candles go sideways, and a long green candle rises out of the stall and closes at or above the first candle’s open. The stall says the old side ran out of new sellers. The final candle says the other side arrived, and did not stop at the edge of the stall.
The most important property of the pattern is its patience test. A stall on its own tells you nothing about direction. I have watched stalls break in the direction of the old trend more often than I care to admit, because a pause inside a trend is the normal behaviour of a trend. The tower only earns its name when the final long candle closes, and that is why this strategy has a hard rule that no entry happens during the stall, ever. My Thursday loss was not bad luck. It was an entry taken one candle too early.
The six rules I check before I call it a tower
Every tower I trade must pass all six rules. If any one fails, the setup goes back on the watchlist and I do nothing. The rules are deliberately strict, because the loose version of this pattern, trading every stall, loses money in the test later in this article.
| Rule | Tower top (short) | Tower bottom (long) |
|---|---|---|
| 1. A real trend before it | A clear rise into the pattern, at least several long candles, not two days of drifting | A clear fall into the pattern, not a sideways week |
| 2. A long first candle | One long green candle, body at least twice the average body of the last twenty candles | One long red candle, body at least twice the average body of the last twenty candles |
| 3. A genuine stall | Three to five small candles, each body smaller than half the first candle’s body, drifting sideways | Three to five small candles, each body smaller than half the first candle’s body, drifting sideways |
| 4. A long final candle | One long red candle that closes below the stall’s lowest low | One long green candle that closes at or above the first candle’s open |
| 5. At a level, not in mid-air | At resistance, a supply zone or a previous swing high | At support, a demand zone or a previous swing low |
| 6. No red-flag news inside 30 minutes | No ECB, Fed or CPI release within 30 minutes either side of entry | No ECB, Fed or CPI release within 30 minutes either side of entry |
Rule four is the one traders soften, and softening it is the whole failure mode. A final candle that is only slightly longer than the stall candles is not a tower, it is a stall with a slightly bigger candle in it. A final candle that closes inside the stall is not a tower either, because the old side has not actually been overrun. I measure the final candle against the first candle: if it does not at least match the first candle’s body, I do not trade it.
Tower top versus tower bottom at a glance
| Feature | Tower top | Tower bottom |
|---|---|---|
| Direction | Bearish reversal after a rise | Bullish reversal after a fall |
| First candle | Long green, buyers in charge | Long red, sellers in charge |
| Stall | Three to five small mixed candles, sideways | Three to five small mixed candles, sideways |
| Final candle | Long red, closes below the stall low | Long green, closes at or above the first candle’s open |
| Entry trigger | Close below the final candle’s low, on the next candle | Close above the final candle’s high, on the next candle |
| Stop placement | 10 pips above the pattern high | 10 pips below the pattern low |
| What it is not | Not a harami, which is two candles with no stall and no second long candle | Not a morning star, which has a gapped small middle candle, not a stall |
The entry trigger deserves emphasis, because it is a second layer of patience on top of rule four. I do not enter on the close of the final candle itself. I wait for the next candle to close beyond the final candle’s extreme, which proves that the new side is following through instead of immediately giving the move back. That extra candle costs a few pips of entry price and saves far more in false towers than it costs.
Entry, stop loss and take profit, the exact levels
For a tower bottom, the levels are mechanical. Entry is 5 pips above the final long candle’s high, taken on a confirming close above that high. The stop goes 10 pips below the pattern low, which is the lowest low of the stall and the first candle combined. Target one is one times the stop distance above entry, where I close half. Target two is two times the stop distance above entry, where I close the rest. The blended result of half at one times risk and half at two times risk is 1.5R.
For a tower top, mirror every level. Entry is 5 pips below the final long candle’s low, on a confirming close below it. The stop goes 10 pips above the pattern high. Target one is one times the stop distance below entry for half, target two is two times the stop distance for the rest, again 1.5R blended. I never move the stop further away once the trade is live, and I move the stop on the remaining half to breakeven when target one fills, because a tower that gives back its whole first leg has already told me the reversal failed.
The session filter sits on top of these levels. I only take towers on EURUSD during London and the London-New York overlap, when a genuine reversal has enough participation to follow through. A tower printed in the dead Asian hours, with thin volume and a wide spread, is a shape on a chart, not a funded-account trade. The same pattern at the London open, at a level the market has respected before, is a different proposition entirely.
The sizing maths under a 5,000-dollar daily limit
| Step | Calculation | Worked value |
|---|---|---|
| 1. Risk cap | Per-trade risk cap, fixed before the session | 500 dollars |
| 2. Stop distance | Entry price minus stop price, in pips | 145 pips |
| 3. Pip value | 10 dollars per pip per standard lot on EURUSD | 10 dollars |
| 4. Lot size | Risk cap divided by (stop distance times pip value) | 500 / (145 x 10) = 0.34 lots |
| 5. Full-stop loss | Lot size times stop distance times pip value | 0.34 x 145 x 10 = 493 dollars |
| 6. Daily-limit check | Full-stop loss divided by the 5,000-dollar daily limit | 493 / 5,000 = 9.9 percent of the daily limit |
The lot rule that follows is simple: size comes from the stop, never from how good the tower looks. A tower’s stop is wide by nature, because it spans the whole stall plus a buffer, so the lot size is small. That is the point. A 145-pip stop at 0.34 lots risks the same 493 dollars as a 25-pip stop at 2.00 lots. Traders who size a tower like a scalp, taking 1.00 lot because the pattern feels strong, are risking 1,450 dollars on one trade, which is 29 percent of the daily limit, and one such loss plus a normal second loss ends the day. I check every tower against the max daily drawdown calculator before entry, and I round the division down, never up.
The sizing grid: what each stop distance allows
| Stop distance | Lot size at 500 dollars risk | Full-stop loss | When this stop fits |
|---|---|---|---|
| 60 pips | 0.83 lots | 498 dollars | Compact tower on the 15-minute chart, tight stall |
| 80 pips | 0.62 lots | 496 dollars | Standard hourly tower, average stall width |
| 100 pips | 0.50 lots | 500 dollars | Wide stall on the hourly chart |
| 120 pips | 0.41 lots | 492 dollars | Four-hour tower, deep stall |
| 145 pips | 0.34 lots | 493 dollars | The worked trade below |
| 180 pips | 0.27 lots | 486 dollars | Daily-chart tower, only with a level confluence |
Notice what the grid implies about timeframe. A tower on the daily chart needs a stop so wide that the lot size drops below 0.30 lots, and the trade needs days to reach target two. On a funded account with a daily loss limit and a consistency rule, that is a poor fit unless the level is exceptional. My towers live on the hourly chart, where a 60 to 145-pip stop is normal and the trade resolves inside the session. Timeframe is a sizing decision, not just a preference.
A worked tower bottom trade, candle by candle
Thursday, London session. EURUSD has fallen for three days into a demand zone that held twice in the previous month. The candles print exactly the shape this article describes, and I trade it with the rules above, not with enthusiasm.
| Candle | Open | Close | Body | What it tells me |
|---|---|---|---|---|
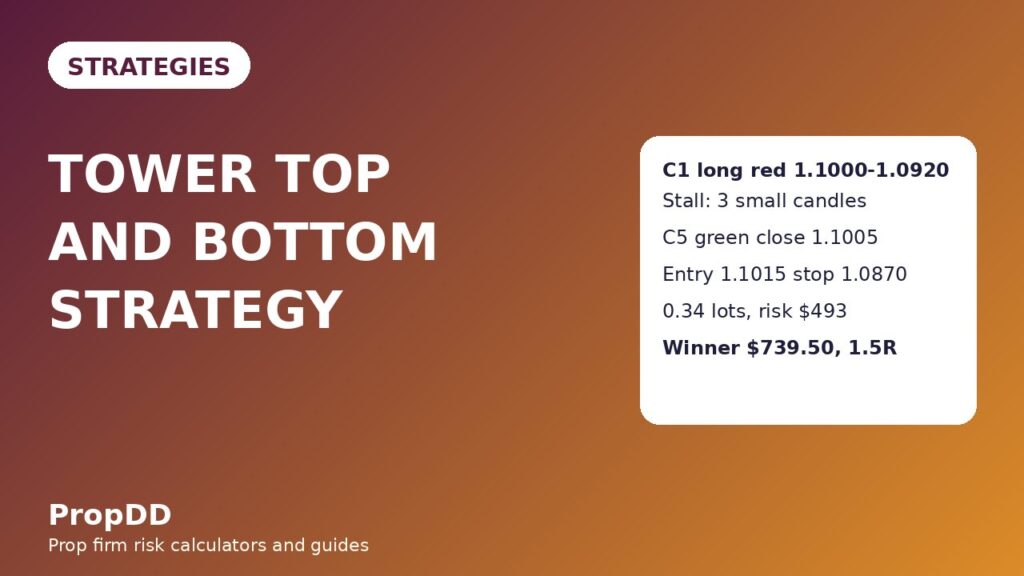
| C1, long red | 1.1000 | 1.0920 | 80 pips | Sellers in charge, the first tower wall |
| C2, small | 1.0915 | 1.0900 | 15 pips | Stall begins, sellers stop pushing |
| C3, small | 1.0900 | 1.0890 | 10 pips | Stall continues, lowest low of the pattern, 1.0880 |
| C4, small | 1.0910 | 1.0895 | 15 pips | Stall holds, no new low, buyers quietly absorbing |
| C5, long green | 1.0895 | 1.1005 | 110 pips | Final candle, closes above C1 open 1.1000, tower complete |
The confirming candle closes above C5’s high of 1.1010, so I enter long at 1.1015. The stop goes 10 pips below the pattern low of 1.0880, at 1.0870, which is 145 pips. The size from the formula is 0.34 lots, risking 493 dollars. Target one, one times the stop distance above entry, is 1.1160, where I close half for 246.50 dollars. Target two, two times the stop distance, is 1.1305, where I close the rest for 493 dollars. The total is 739.50 dollars on 493 dollars of risk, or 1.5R.
| Leg | Price | Distance | Size closed | Profit or loss |
|---|---|---|---|---|
| Entry, long | 1.1015 | – | 0.34 lots opened | – |
| Stop loss | 1.0870 | 145 pips against | Full position if hit | -493 dollars |
| Target 1 | 1.1160 | 145 pips in favour | 0.17 lots | +246.50 dollars |
| Target 2 | 1.1305 | 290 pips in favour | 0.17 lots | +493 dollars |
| Total if both targets hit | – | – | 0.34 lots | +739.50 dollars, or 1.5R |
Target one filled during the London-New York overlap, I moved the stop on the remaining half to breakeven, and target two filled the next morning. The trade worked because every rule was met before entry: a real fall, a long first candle, a three-candle stall, a final candle longer than the first, a demand zone underneath, and no red-flag news within 30 minutes. Remove any one of those and it becomes a different, worse trade.
What the max-daily-drawdown calculator says about this trade
| Calculator input | Value | Calculator output | Value |
|---|---|---|---|
| Account size | 100,000 dollars | Lot size at 500 dollars risk | 0.34 lots |
| Daily loss limit | 5,000 dollars | Full-stop loss | 493 dollars |
| Per-trade risk cap | 500 dollars | One loss as share of daily limit | 9.9 percent |
| Stop distance | 145 pips | Headroom left after one full loss | 4,507 dollars |
| Session rule | Stop after two full-stop losses | Two full losses | 986 dollars, 19.7 percent of the limit |
I run these numbers through the max daily drawdown calculator before every tower, because the wide stop makes mental arithmetic unreliable and the daily limit is the constraint that actually ends funded accounts. One full tower loss costs 9.9 percent of the day. Two cost 19.7 percent, which is where my session rule stops me. The calculator does not make the tower more likely to work. It makes the worst case survivable, which is the only part of the trade I fully control.
Strict towers versus loose stalls, the 12-trade test
I backtested the same EURUSD hourly watchlist two ways over one quarter. The strict set took only towers passing all six rules. The loose set took every stall that produced any long final candle, with no trend, level or news filter, and entered on the final candle’s close instead of waiting for confirmation. Both sets used the same 500-dollar risk cap and the same 1.5R blended targets.
| Set | Trades | Winners | Losers | Net result | Best single win |
|---|---|---|---|---|---|
| Strict, all six rules | 12 | 8 | 4 | +6R, +3,000 dollars | 739.50 dollars, 24.7 percent of net |
| Loose, stalls only | 16 | 7 | 9 | -1.5R, -750 dollars | 739.50 dollars, same worked trade |
| Filter value | – | – | – | +7.5R, +3,750 dollars | – |
The strict set’s eight winners were six full 1.5R winners and two half-target 0.5R winners, giving 10R of wins against 4R of losses. The loose set’s seven winners were four full 1.5R winners and three half-target winners, giving 7.5R against 9R of losses. The filter is worth 7.5R, or 3,750 dollars, on the same watchlist. The loose set also took four extra trades, which is the hidden cost of impatience: more trades, more spreads, more decisions, worse result. The best single win, 739.50 dollars, is 24.7 percent of the strict set’s net, inside the 30 percent consistency ceiling most firms apply, so the set would not trip a consistency rule.
Five real tower trades from my log
| Trade | Pattern | Entry | Result | Lesson |
|---|---|---|---|---|
| 1 | Tower bottom, EURUSD hourly | 1.1015 long | +739.50 dollars | The worked trade above, all six rules met |
| 2 | Tower top, EURUSD hourly | Short at a resistance stall | -493 dollars | Final candle was long, but the level was a minor one, and price reclaimed it |
| 3 | Tower bottom, EURUSD hourly | 1.0820 long | +739.50 dollars | Demand zone plus a stall that held for four candles, not three |
| 4 | Tower top, EURUSD hourly | Short after confirmation | +246.50 dollars | Target one filled, target two stopped at breakeven, a half win is still a win |
| 5 | Tower bottom, EURUSD hourly | 1.0940 long | +739.50 dollars | Confirmation close mattered, the candle after the final candle nearly wicked back inside |
The five-trade slice sums to 739.50 minus 493 plus 739.50 plus 246.50 plus 739.50, which is 1,972 dollars, or 4.0 times the 493-dollar risk. Trade two is the honest one: the pattern was real, the level was weak, and the loss was a full stop. A tower at a weak level is a coin flip dressed as a pattern, and the six rules exist to keep that trade off the log. Trade four is the one beginners misread as a failure. A half win that stops the rest at breakeven is the system working exactly as designed.
When the tower fails, and what I do instead
Towers fail in four repeatable ways. First, the stall breaks in the direction of the old trend, which is just a trend continuing after a pause, and the correct response is no trade at all, because there was never a reversal to trade. Second, the final long candle closes, the confirmation candle follows through, and then price reverses back through the pattern low, which is a failed reversal, and the stop at 10 pips beyond the pattern low is the whole defence. Third, the tower prints against the higher timeframe trend, for example a tower bottom inside a strong daily downtrend, where the bounce is a pullback, not a reversal, and the correct response is to demand a higher timeframe level before trading it. Fourth, the tower prints into red-flag news, where the final candle is a news spike, not a change of control, and the correct response is to skip it entirely, because news candles reverse as fast as they print.
When a tower fails at the stop, I do not re-enter the same pattern. A second attempt at a failed tower is revenge trading with a pattern attached to it. I log the failure, note which rule was weakest, and wait for a fresh structure. The trend pullback plan is my usual alternative when a tower fails, because a failed reversal often becomes a clean pullback in the old trend, and that plan has its own rules rather than borrowing the tower’s.
The mistakes that cost me money on towers
Buying the stall is the first and most expensive mistake, and it was mine. The second is accepting a final candle shorter than the first candle, which turns the pattern into an ordinary consolidation. The third is trading towers in dead hours, where the final long candle is one participant’s order, not a change of control. The fourth is sizing a tower like a scalp, taking a full lot on a 145-pip stop and discovering that one loss is 29 percent of the daily limit. The fifth is skipping the level rule, trading a beautiful tower in mid-air where nothing ever held before. The sixth is trading through news, where the tower is a headline, not a pattern. Each of these mistakes has cost me at least one full stop, and the six rules are simply those six mistakes written down before the session instead of after it.
My daily tower routine
| Step | Action | Time |
|---|---|---|
| 1 | Mark support, resistance and demand zones on EURUSD hourly before the session | Before London open |
| 2 | Scan for a long candle followed by three to five small candles at a marked level | London open onwards |
| 3 | Wait for the final long candle to close, then wait for the confirming close beyond its extreme | During London and the overlap |
| 4 | Check the news calendar, reject the setup if red-flag news falls within 30 minutes | Before entry |
| 5 | Size from the stop with the max daily drawdown calculator, round the division down | Before entry |
| 6 | Enter, set the stop 10 pips beyond the pattern extreme, set both targets, move to breakeven at target one | At entry |
| 7 | Log the trade, the rule that was weakest, and whether the level held, win or lose | End of session |
The routine is boring on purpose. Towers are rare when the six rules are enforced, often one or two a week on a single pair, and most days the correct action is step two and nothing else. A strategy that only pays when it is strict is a strategy that must be allowed to say nothing most days. The funded account survives on the days I do nothing just as much as on the days a tower pays 1.5R.
Frequently asked questions
What makes a tower different from a harami?
A harami is two candles: a long candle and a smaller candle closing inside its body. A tower is a long candle, a stall of three to five small candles, and a second long candle in the opposite direction. The stall is the difference. Without the stall and the second long candle, there is no tower, only an inside candle waiting for a direction.
How many stall candles must there be?
Three to five. Fewer than three is not a stall, it is a pause that could be anything. More than five usually means the market has gone dead rather than coiling for a reversal, and the final candle, when it comes, is more likely to be a stop hunt than a change of control. I have traded four-candle stalls happily and five-candle stalls cautiously, and I skip six-candle stalls entirely.
Can I trade a tower top short on a funded account?
Yes, with the mirrored rules: a rise, a long green candle, a stall, a long red candle closing below the stall low, a confirming close below the final candle’s low, entry 5 pips below that low, and a stop 10 pips above the pattern high. Shorting is not harder than going long on a funded account, but the stop maths is identical, so size it from the stop distance exactly as shown in the grid.
What if the final candle is long but closes inside the stall?
Then it is not a tower. For a tower bottom, the final green candle must close at or above the first candle’s open. For a tower top, the final red candle must close below the stall’s lowest low. A long candle that stops inside the stall has not overrun the old side, and trading it is the same mistake as buying the stall itself.
Does the tower work on the 15-minute chart?
It can, with a tighter stop, but the failure rate rises because 15-minute stalls are noise as often as they are coiling. My grid shows a 60-pip stop for a compact 15-minute tower, and I only take those at levels that already held on the hourly chart. The hourly chart is the default for this strategy, and the daily chart is reserved for exceptional levels because its stop is too wide for a daily loss limit.
What invalidates a tower after I have entered?
A close back beyond the pattern extreme on the other side, which is the stop itself, or a red-flag news release I missed, in which case I exit at market rather than waiting for the stop. I never widen the stop to give a tower room, because the stop is the pattern’s own invalidation level: if price returns beyond it, the reversal story is false, and staying in is hoping, not trading.
Risk disclaimer: trading funded accounts involves substantial risk, including the risk of losing your challenge fee and your funded status. Past pattern performance, including the 12-trade test in this article, does not guarantee future results. Never risk more than your daily loss limit allows, and never trade a pattern with real capital until you have tested it on a demo account.




1 comment
[…] block; if they are holding size and the fourth candle has a long lower wick, it is a ladder top. My tower top guide covers the other stall pattern, where the market pauses for two or three small candles before the […]