I learned what a harami really is from a trade I almost took, and the reason I did not take it is the whole strategy. It was a Thursday afternoon on EURUSD: six straight falling H4 candles, then a small green candle printed entirely inside the previous red candle’s body. Every instinct said reversal. But I had a rule from a 500-dollar lesson the week before: no confirmation candle, no trade. I waited. The next candle closed lower, the “reversal” fell apart, and the pair dropped 90 more pips. That non-trade saved my daily limit, and it taught me the one thing that matters about the harami: the pattern itself is only half a signal, the confirmation candle is the other half, and skipping it turns a quiet exhaustion signal into a stopped-out account.
In this article
- What a harami actually is
- The two versions, side by side
- The full strategy rules
- Position-sizing maths under a daily loss limit
- Worked example: a bullish harami on EURUSD
- Five logged setups, honest results
- When the harami fails
- How it fits prop firm consistency and drawdown rules
- My pre-trade checklist
- Frequently asked questions
This guide covers the harami as a complete funded-account strategy, not as a textbook pattern description. It gives you the exact anatomy of both versions, the full rules, the sizing maths under a 5,000-dollar daily loss limit, a worked EURUSD trade, five logged setups, and how it fits prop firm consistency and drawdown rules. Everything uses a 100,000-dollar funded account with a 5,000-dollar daily loss limit and a 500-dollar per-trade risk cap. If you trade a different account size, the percentages still hold: risk 0.5% per trade, never more than 10% of your daily limit on one setup.
What a harami actually is
The word harami comes from the Japanese word for pregnant, and the picture explains why: a large candle followed by a small candle whose whole body sits inside the large candle’s body. The large candle is the trend’s last push; the small candle is the market pausing inside it, unable to make a new extreme. That pause is the signal’s meaning: it does not say the trend has reversed, only that the winning side has stopped winning for one candle.
That distinction is everything on a funded account. Most harami guides treat the two candles as a buy or sell signal on their own, but that reading is too weak to risk money on: inside candles print constantly in ranges, and a range inside candle means nothing at all. The harami only earns its risk when three things are true at once — it prints at the end of a real trend, at a level that matters, and a confirmation candle proves the other side followed through. Without all three, it is wallpaper, not a setup. For textbook pattern anatomy beside this funded-account version, see the Signal2Forex harami guide.
The two versions, side by side
There are two haramis, mirror images of each other. The table below lays out both.
| Feature | Bullish harami | Bearish harami |
|---|---|---|
| Trend before it | Clear downtrend, lower lows | Clear uptrend, higher highs |
| First candle | Long bearish (red) candle | Long bullish (green) candle |
| Second candle | Small bullish candle, body fully inside the first candle’s body | Small bearish candle, body fully inside the first candle’s body |
| What it means | Sellers exhausted, buyers pushing back | Buyers exhausted, sellers pushing back |
| Confirmation | A candle closing above the second candle’s high | A candle closing below the second candle’s low |
| Invalidation | Close below the pattern low | Close above the pattern high |
Two details in that table do real work. First, the second candle’s body must sit inside the first candle’s body — wicks may poke out, but if the body sticks out, it is not a harami. Second, the harami cross, where the second candle is a doji, is the highest-conviction version, because it shows total indecision after a strong push. I size crosses exactly the same as normal haramis — the edge is in the filter, not in bigger size — but I take them first when two setups compete for one slot in my day.
The full strategy rules
Here are the rules exactly as I trade them. A setup must pass all six checks before I calculate size.
Setup. A clear trend of at least five candles in one direction, ending at a level that matters: daily support or resistance, a round number, or a previous swing extreme. A harami in the middle of a range is not a setup, no matter how pretty it looks.
Entry. Only after a confirmation candle closes beyond the second candle’s extreme — above its high for a bullish harami, below its low for a bearish one. I enter at the confirmation close, not mid-candle on a spike. If the confirmation candle closes back inside the pattern, there is no trade.
Stop loss. Beyond the pattern extreme plus a 5-pip buffer: below the pattern low for a long, above the pattern high for a short. The pattern low is the lowest low of both candles, not just the second. Cutting the buffer to save pips is false economy — it is what keeps normal wick noise from stopping you out of a good trade.
Take profit. Two targets, always: half at 1R with the stop moved to breakeven, the rest at 2R. It banks something on every winner while leaving room for the runner, and it keeps any single day’s best result small relative to the total — which matters for consistency rules, covered below.
Session and time filter. I only trade haramis on the H4 and daily charts, and only when the confirmation candle closes during London or New York hours. A harami confirming in thin Asian hours is a coin flip with a spread attached. One setup per pair per day, maximum two per day across all pairs, so a bad morning cannot eat the whole daily limit.
News filter. No new harami trade within 30 minutes either side of a red-folder news event on that pair’s currency. A pattern printing into a central bank decision is a lottery ticket, and funded accounts punish lottery tickets with drawdown.
Position-sizing maths under a daily loss limit
The maths is the same formula I use for every strategy on this site, because the daily limit does not care which pattern you traded. On a 100,000-dollar account with a 5,000-dollar daily loss limit, my per-trade risk cap is 500 dollars — 0.5% of the account, 10% of the daily limit. The two-setups-per-day cap is what actually protects the limit, not the formula alone.
Formula box. Position size (lots) = risk ÷ (stop in pips × 10 dollars per pip per standard lot). Risk per trade = 500 dollars = 0.5% of a 100,000-dollar account. Daily room used = 500 ÷ 5,000 = 10% of the daily loss limit per trade. Target 1 banks half the position at 1R, the stop distance; target 2 takes the rest at 2R.
The grid below assumes EURUSD at 10 dollars per pip per standard lot; for other pairs, use that pair’s pip value in the same formula, and never round size up — always down to the nearest 0.01 lot.
| Stop distance | Position size | Dollar risk |
|---|---|---|
| 40 pips | 1.25 lots | 500 dollars |
| 50 pips | 1.00 lot | 500 dollars |
| 60 pips | 0.83 lots | 498 dollars |
| 75 pips | 0.66 lots | 495 dollars |
| 90 pips | 0.55 lots | 495 dollars |
| 100 pips | 0.50 lots | 500 dollars |
Notice what the grid quietly tells you: a harami with a 100-pip stop needs half a lot and one with a 40-pip stop needs one and a quarter lots, but both risk the same 500 dollars. Traders who trade a fixed lot size on every pattern trade a different risk on every setup, and the wide-stop setups are the ones that breach daily limits. If your stop is wider than 100 pips on EURUSD, skip the setup — never shrink the stop to fit your size.
Worked example: a bullish harami on EURUSD
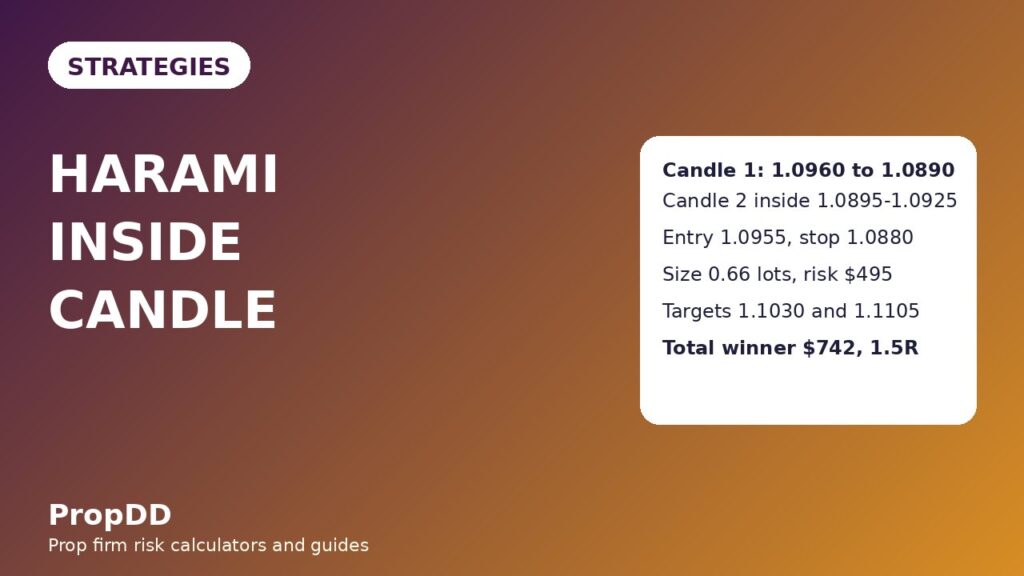
Here is the full worked example, with every number shown. The pair is EURUSD on H4, falling into daily support near 1.0880 after six lower closes.
| Step | Price | Notes |
|---|---|---|
| Candle 1 (bearish) | Open 1.0960, close 1.0890 | 70-pip body, the trend’s last push |
| Candle 2 (bullish, inside) | Open 1.0895, close 1.0925, high 1.0935, low 1.0885 | Body fully inside 1.0890–1.0960; low holds above support |
| Confirmation candle | Closes 1.0955 | Above candle 2’s high of 1.0935 — trade is on |
| Entry (long) | 1.0955 | At the confirmation close |
| Stop loss | 1.0880 | Pattern low 1.0885 minus 5-pip buffer = 75 pips |
| Position size | 0.66 lots | 500 ÷ (75 × 10) = 0.666, rounded down |
| Target 1 (half, 1R) | 1.1030 | 75 pips, banks 0.33 × 75 × 10 = 247.50 dollars |
| Target 2 (rest, 2R) | 1.1105 | 150 pips, banks 0.33 × 150 × 10 = 495 dollars |
| Total if both targets hit | 742.50 dollars | 1.5R on a 500-dollar risk, stop at breakeven after target 1 |
The bearish mirror: bullish candle 1.0900 to 1.0970, small bearish candle inside it opening 1.0965 and closing 1.0935, confirmation close at 1.0895, entry short at 1.0895, stop 1.0975 (80 pips), size 0.62 lots, targets 1.0815 and 1.0735. The pattern is symmetrical; the discipline is not — most traders take the bullish version eagerly and chase the bearish version late, because buying a bounce feels better than shorting one. The rules do not care how a setup feels.
One more check on the worked example: the 742.50-dollar full winner is 14.9% of the 5,000-dollar daily limit, so even two full winners stay inside the day. For a fast sanity check on any harami, run the numbers through the max daily drawdown calculator — it shows in seconds how much of your daily room one stopped-out setup actually costs.
Five logged setups, honest results
The table below is five consecutive harami setups I logged on H4 and daily charts, traded with the rules above at 500 dollars of risk each. I include the losers because an article that only shows winners is an advertisement, not a guide.
| # | Setup | Result | Profit / loss |
|---|---|---|---|
| 1 | Bullish harami, EURUSD H4 | Both targets hit | +742 dollars (+1.5R) |
| 2 | Bearish harami, GBPUSD H4 | Stopped out | −500 dollars (−1R) |
| 3 | Bullish harami cross, EURUSD daily | Target 1 only, rest stopped at breakeven | +247 dollars (+0.5R) |
| 4 | Bearish harami, USDJPY H4 | Both targets hit | +742 dollars (+1.5R) |
| 5 | Bullish harami, AUDUSD H4 | Stopped out | −500 dollars (−1R) |
| Net across five setups | 3 wins, 2 losses | +731 dollars (+1.5R) |
Two lessons sit inside that table. First, the win rate is 60% yet the net is only +1.5R, because the partial-exit plan trades maximum profit for consistency — target 1 banks early and the breakeven stop turns some 2R winners into 0.5R winners. That is deliberate: a smooth equity curve that passes consistency rules beats a spiky one that breaches them. Second, setup 3 is the harami cross, yet it produced the smallest win despite being the “strongest” pattern. Pattern strength improves the odds of a move starting, not how far it runs. Never size up for a cross.
When the harami fails
The harami fails in four repeatable ways, and recognising them in advance is worth more than any entry tweak. First, the range harami: an inside candle in a sideways market, where there is no trend to reverse — check the daily chart before trusting an H4 harami. Second, the news harami: a pattern printing minutes before a rate decision, where the confirmation candle is just pre-news positioning — hence the 30-minute news filter. Third, the shallow harami: a first candle so small that the whole pattern is 15 pips wide, giving a stop that normal noise hunts; I skip stops under 25 pips. Fourth, the runaway trend: a genuine harami that confirms, then the old trend resumes and takes out the pattern extreme — setups 2 and 5 above. That is not a broken rule, it is the strategy’s normal loss, and the 500-dollar cap makes it survivable. The other classic errors are shortcuts around the rules above: trading without a confirmation candle, measuring the inside body against the first candle’s wicks instead of its body, stopping at the second candle’s extreme instead of the pattern extreme, trading 5-minute charts where spreads eat the edge, and taking a third setup after two losses because the day “owes” a winner. The day owes nothing: two setups, win or lose, and the screens go off.
How it fits prop firm consistency and drawdown rules
Two firm rules shape this strategy more than any chart rule. The first is the daily loss limit: at 500 dollars per trade and two trades per day maximum, the worst possible day is 1,000 dollars, 20% of the 5,000-dollar limit. That headroom is intentional — a strategy that can breach the daily limit on a normal bad day is a countdown.
The second is the consistency rule, which most firms phrase as a cap — commonly 30% — on how much of your total profit may come from a single day. The partial-exit plan is built for this: because half the position banks at 1R, a single day’s best result stays modest. Across a 20-trade illustration month netting 4,200 dollars, the best single day was the 742-dollar full winner from the worked example, 17.7% of the total — comfortably inside a 30% ceiling. If your best day ever exceeds that ceiling, keep trading the same plan until the total grows past the spike; overtrading after a big day is how traders breach the daily limit instead.
My pre-trade checklist
I run this checklist before every harami trade. If any line fails, there is no trade.
| Check | Pass condition |
|---|---|
| Trend | At least five candles in one direction into the pattern |
| Level | Pattern sits at daily support, resistance, a round number or a swing extreme |
| Inside body | Second candle’s body fully inside the first candle’s body |
| Confirmation | Next candle closes beyond the second candle’s extreme |
| Stop size | Stop distance at least 25 pips, position sized to 500 dollars maximum |
| Session and news | London or New York session, no red-folder news within 30 minutes |
| Daily room | Fewer than two setups taken today, daily loss so far under 1,000 dollars |
Related guides on this site cover the harami’s closest cousins: the evening star is the three-candle top reversal to compare against the bearish harami, the three outside up and down pattern is the stronger engulfing version of the same exhaustion idea, the tweezer tops and bottoms show what equal extremes look like when the second candle is not inside the first, and the stick sandwich is the rarer three-candle cousin with equal closes. Together: exhaustion first, confirmation second, size third.
Frequently asked questions
Is a harami a reversal signal on its own?
No. On its own it is an exhaustion signal — it says the trend paused, not that it reversed. Only the confirmation candle turns it into a tradeable setup. Treat an unconfirmed harami as information, not an entry.
What is the difference between a harami and a harami cross?
In a harami cross the second candle is a doji, with almost no body — deeper indecision than a normal harami, so the higher-conviction variant. I still size it identically, because conviction about direction is not conviction about distance.
Can I trade haramis on the 15-minute chart?
You can, but I do not recommend it on a funded account: the pattern prints far more often on low timeframes, stops shrink below my 25-pip floor, and spreads take a larger share of every winner. H4 and daily keep the pattern rare and the stops wide enough to survive noise.
How is a harami different from an inside bar?
An inside bar only requires the second candle’s full range, wicks included, to sit inside the first candle’s range. A harami requires the second candle’s body to sit inside the first candle’s body, plus a preceding trend — so most inside bars are not haramis.
What win rate should I expect from this strategy?
My logged five setups ran at 60% wins with a +1.5R net, but five trades prove nothing — treat that as an illustration, not a promise. Over larger samples, reversal patterns of this family typically win roughly half their trades, and the strategy makes money only when winners average more than losers, which is what the 1R/2R partial-exit plan is designed to produce.
Does the harami work on all pairs and instruments?
It works best on liquid pairs and indices where candles reflect real order flow. On exotic pairs and illiquid crypto, gaps distort the inside-body measurement and the confirmation candle means less. If your instrument regularly gaps over the pattern extreme, trade a different strategy on it.
Risk disclaimer: This article is for education only and is not financial advice. Trading a funded account involves the risk of losing the account through rule breaches as well as market losses, and past pattern performance does not guarantee future results. Always check your firm’s exact rules before trading any strategy.



