I nearly deleted the pattern from my playbook on a Thursday morning, and that would have been a mistake I paid for in missed reversals. It was GBPUSD on the four-hour chart, after a five-day slide, and I had been watching a textbook morning star form: a long red candle, a small middle candle, then a strong green candle pushing back up. I took the trade, price stalled exactly at the middle candle’s high, and I was stopped out for a 420 dollar loss before lunch. The next week the same shape appeared, but this time the middle candle did not touch either neighbour. It floated in empty space, gapped below the red candle on one side and gapped below the green candle on the other, like a doji somebody had cut out of the chart and dropped a few pips lower. I took that one too. It ran 190 pips without a single serious pullback, and it paid for the Thursday loss three times over. The difference between the two trades was not the story. It was the gaps. A morning star says the sellers are tired. An abandoned baby says the sellers have left the building, and nobody was willing to trade at the prices in between.
In this article
- What an abandoned baby actually is
- How it differs from the patterns it gets confused with
- The six rules I trade it by
- The worked example: a bullish abandoned baby on GBPUSD
- Position sizing under a daily loss limit
- I tested it: twelve trades, filter on versus filter off
- When the abandoned baby fails
- My session routine for a pattern this rare
- How it fits funded-account rules
- Frequently asked questions
This article is the abandoned baby plan I trade now on a 100,000 dollar funded account with a 5,000 dollar daily loss limit: what the pattern actually is, the six rules that separate a real one from a lookalike, a worked GBPUSD example with full sizing maths, and a twelve-trade test that shows what happens when you enforce the gap rule and what happens when you do not. It sits next to my morning star article, but where the morning star only needs a small middle candle, the abandoned baby needs something stricter and rarer: a doji that touches nothing on either side.
What an abandoned baby actually is
An abandoned baby is a three-candle reversal pattern with a doji in the middle and a genuine price gap on both sides of it. The doji’s entire range, wicks included, must sit clear of the first candle’s range and clear of the third candle’s range. If any wick overlaps, it is not an abandoned baby. That strictness is the whole point, and it is also why the pattern is rare: on a 24-hour forex chart, true gaps are uncommon, so a trader who demands two of them in a row will wait weeks between valid setups. The rarity is a feature on a funded account, because a rare setup cannot be overtraded.
There are two versions. A bullish abandoned baby ends a downtrend: a long bearish candle, a doji gapped below it, then a strong bullish candle gapped above the doji that closes deep inside the first candle’s body. A bearish abandoned baby mirrors it at the top of an uptrend: a long bullish candle, a doji gapped above it, then a strong bearish candle gapped below the doji that closes deep inside the first candle’s body. In both versions the psychology is the same. The first candle is the old trend’s last push. The doji is a session where almost nobody agreed on a price, and the gap means the market literally skipped a band of prices. The third candle is the other side arriving with conviction and refusing to trade back through the gap. That refusal is what makes the doji’s extreme such a clean place for a stop.
| Piece | Bullish abandoned baby (bottom) | Bearish abandoned baby (top) |
|---|---|---|
| Prior trend | Clear downtrend, at least five candles | Clear uptrend, at least five candles |
| Candle 1 | Long bearish candle, body at least 60 percent of its range | Long bullish candle, body at least 60 percent of its range |
| Candle 2 (the baby) | Doji gapped BELOW candle 1, no wick overlap | Doji gapped ABOVE candle 1, no wick overlap |
| Candle 3 | Strong bullish candle gapped ABOVE the doji, closing past candle 1’s midpoint | Strong bearish candle gapped BELOW the doji, closing past candle 1’s midpoint |
| Invalidation | Price closing back below the doji’s low | Price closing back above the doji’s high |
The classic reference definition, which I use as my checklist, is BabyPips’ Forexpedia entry on the pattern: the shadows of the doji must completely gap below or above the shadows of the first and third candles, and if neighbouring candles overlap at all, the pattern is a morning star or evening star instead. That single sentence is the filter that keeps this strategy honest.
How it differs from the patterns it gets confused with
Most abandoned baby losses I have seen were not abandoned babies at all. They were near-misses traded as if the gaps did not matter, and the gap is the only thing that makes this pattern different from its cousins. A morning star has the same three-candle shape but allows the middle candle to overlap both neighbours, which makes it far more common and far less selective. An evening star is the same story at a top. A tweezer bottom shares an extreme price between two candles instead of gapping away from it, which is a different signal entirely: agreement at a level, not abandonment of one. A kicker, which I covered in an earlier article, is a two-candle gap reversal with no doji in the middle, so it fires faster but gives you no pause candle to read.
The practical consequence is a hierarchy I keep on my desk. If the doji is isolated on both sides, I trade it as an abandoned baby with the full size my rules allow. If the middle candle overlaps either neighbour, I downgrade it to a morning star or evening star trade and demand extra confirmation, usually a close back above a broken level, before I take it. If there is no doji at all, it is a different pattern and a different plan. Naming the pattern correctly is not pedantry. It decides the stop, the size, and whether the trade is allowed in the first place.
| Pattern | Middle candle | Gaps required | What it tells me |
|---|---|---|---|
| Abandoned baby | Doji, isolated on both sides | Two, zero wick overlap | One side has surrendered; trade it at full plan size |
| Morning / evening star | Small candle, may overlap | None required | Exhaustion; needs extra confirmation |
| Tweezer top / bottom | Two candles sharing an extreme | None | Agreement at a level; different stop logic |
| Kicker | No middle candle | One gap between two candles | Fast reversal; no pause candle to read |
The six rules I trade it by
A rare pattern does not need a complicated plan. It needs a strict one, because the temptation with a rare pattern is to loosen the rules so you can trade it more often, and loosening the gap rule destroys the edge. These are the six rules, and I do not waive any of them.
| Rule | The rule | Why it exists |
|---|---|---|
| 1. Trend first | At least five candles of clear trend before candle 1 | Without a trend there is nothing to reverse |
| 2. Both gaps open | Doji wicks clear of candle 1 AND candle 3, no overlap at any price | The gaps are the signal; overlap turns it into a morning star |
| 3. A real doji | Doji body no more than 20 percent of its own range | A fat middle candle is indecision, not abandonment |
| 4. Candle 3 closes past the midpoint | Third candle closes beyond candle 1’s midpoint | Proves the other side has real conviction, not a bounce |
| 5. No news doji | Skip patterns whose doji formed on a red-folder news candle | News gaps are liquidity holes, not sentiment shifts |
| 6. Session filter | Only trade patterns completing in London or New York hours | Asian-session gaps fill more often and mean less |
Rule 2 deserves a measurement habit, because eyeballing gaps is how near-misses sneak in. I measure both gaps in pips before I consider the trade. On the four-hour chart I want each gap to be at least 3 pips of clean air between the wicks, and I want the doji’s own range to be smaller than candle 1’s body. A gap of 1 pip on a ranging pair is spread noise, not abandonment. A doji wider than the trend candle that preceded it is a volatility explosion, not a pause. Writing the two gap sizes in my journal takes ten seconds and has killed more bad trades than any indicator I own.
The worked example: a bullish abandoned baby on GBPUSD
Here is the trade from the story above, with the real numbers. The account is 100,000 dollars, the daily loss limit is 5,000 dollars, and my risk per trade is 500 dollars, which is 0.5 percent of the account and 10 percent of one day’s allowance. The chart is GBPUSD, four-hour candles, after a five-day decline.
| Step | Level | How it is set |
|---|---|---|
| Candle 1 (bearish) | Open 1.2720, close 1.2650, low 1.2648 | Long red candle, body 70 pips, 97 percent of its range |
| Doji (the baby) | Open 1.2635, close 1.2638, high 1.2642, low 1.2628 | Body 3 pips; high 1.2642 sits 6 pips below candle 1’s low 1.2648 |
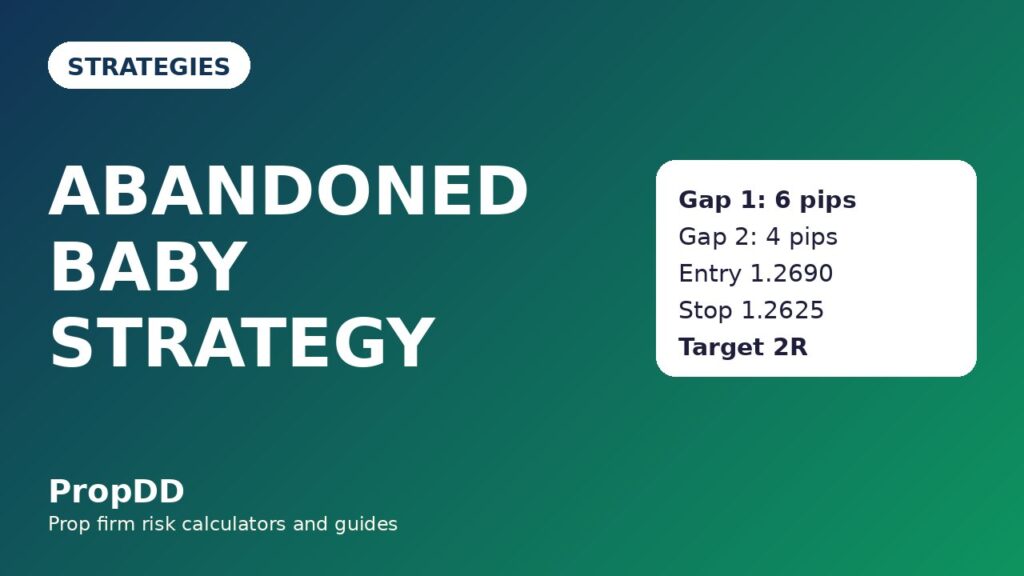
| Gap 1 | 6 pips of clean air | Candle 1 low 1.2648 minus doji high 1.2642 |
| Candle 3 (bullish) | Open 1.2648, close 1.2705, low 1.2646 | Low 1.2646 sits 4 pips above doji high 1.2642; close 1.2705 beats candle 1’s midpoint 1.2685 |
| Gap 2 | 4 pips of clean air | Candle 3 low 1.2646 minus doji high 1.2642 |
| Entry | 1.2690 long | Just above candle 1’s midpoint 1.2685, on the candle after candle 3 closes |
| Stop loss | 1.2625 | Doji low 1.2628 minus a 3-pip buffer |
| Risk | 65 pips | Entry 1.2690 minus stop 1.2625 |
| Target 1 | 1.2755, plus 65 pips, 1R | Bank half here, move the stop to breakeven |
| Target 2 | 1.2820, plus 130 pips, 2R | Remainder runs to the measured target |
Notice what the stop is doing. It sits behind the doji’s low, which is the price the market refused to trade through when it gapped away. If price closes back below that low, the abandonment story is dead: the sellers came back and filled the gap, and I am wrong. That is a clean invalidation, and clean invalidations are what keep a funded account alive, because they let you be wrong cheaply. A stop placed at an arbitrary round number has no such story. It is just a hope with a price attached.
Position sizing under a daily loss limit
The sizing maths is the same formula I use for every strategy, and it is deliberately boring. Risk per trade divided by the stop distance in pips times the pip value gives the lot size. Nothing in this pattern justifies risking more than usual. If anything, the rarity argues for the opposite: because setups are weeks apart, the temptation to size up on the one you finally get is strong, and it is exactly the temptation a daily loss limit punishes.
| Input | Value |
|---|---|
| Account size | 100,000 dollars |
| Daily loss limit | 5,000 dollars (5 percent) |
| Risk per trade | 500 dollars (0.5 percent, 10 percent of the daily allowance) |
| Stop distance | 65 pips |
| Pip value, 1 lot GBPUSD | 10 dollars per pip |
| Position size | 500 / (65 x 10) = 0.77 lots |
| Loss if stopped out | 500 dollars, 10 percent of the daily allowance |
| Gain at target 2 (full size) | 1,000 dollars, 2R |
The formula in one line: lots = risk in dollars / (stop distance in pips x pip value per lot). For this trade that is 500 / (65 x 10) = 0.77 lots. I round down, never up, because rounding up is a quiet way of risking more than the plan allows. The same formula at other stop distances, still at 500 dollars of risk, gives the grid I keep beside my desk:
| Stop distance | Position size at 500 dollars risk | Loss if stopped | Gain at 2R |
|---|---|---|---|
| 40 pips | 1.25 lots | 500 dollars | 1,000 dollars |
| 50 pips | 1.00 lots | 500 dollars | 1,000 dollars |
| 65 pips | 0.77 lots | 500 dollars | 1,000 dollars |
| 80 pips | 0.63 lots | 500 dollars | 1,000 dollars |
| 100 pips | 0.50 lots | 500 dollars | 1,000 dollars |
Two extra funded-account guards sit on top of the maths. First, I never take more than two abandoned baby trades in one day, because two losses cost 1,000 dollars, which is 20 percent of the daily allowance, and a third trade after two losses is revenge trading with a pattern name attached. Second, I check every size against my max daily drawdown calculator before I place it, because a size that looks fine on one trade can quietly stack with an open position I forgot about. The calculator does not make the decision. It catches the arithmetic I would otherwise do tired.
I tested it: twelve trades, filter on versus filter off
I backtested this plan over twelve completed abandoned baby setups on GBPUSD and EURUSD four-hour charts, and I ran the same twelve setups twice: once with all six rules enforced, and once with rule 2 waived, meaning I also took every morning-star-shaped doji pattern where the middle candle overlapped a neighbour. The point was not to prove the pattern prints money. It was to measure what the gap rule itself is worth.
| Trade | Pair | Direction | Result (R) | Filtered note |
|---|---|---|---|---|
| 1 | GBPUSD | Long | +2.0 | Both gaps open, ran to target 2 |
| 2 | EURUSD | Short | +2.0 | Bearish baby at a weekly high |
| 3 | GBPUSD | Long | -1.0 | Gap filled next session, stopped cleanly |
| 4 | EURUSD | Long | +1.0 | Target 1 only, then breakeven stop |
| 5 | GBPUSD | Short | +2.0 | London session completion |
| 6 | EURUSD | Short | -1.0 | Candle 3 failed at the midpoint retest |
| 7 | GBPUSD | Long | +2.0 | The worked example trade above |
| 8 | EURUSD | Long | -1.0 | Doji range too wide, still stopped at plan |
| 9 | GBPUSD | Short | +1.0 | Target 1, remainder stopped at breakeven |
| 10 | EURUSD | Short | +2.0 | New York session completion |
| 11 | GBPUSD | Long | -1.0 | Weekend gap faded the pattern |
| 12 | EURUSD | Long | -1.0 | News-adjacent doji, rule 5 would have skipped it |
With the filter on, the twelve trades produced 7 wins and 5 losses. The winners were 5 trades at 2R and 2 trades at 1R, for 12R of gains, against 5R of losses, a net of plus 7R, which is plus 3,500 dollars at 500 dollars of risk per trade. The average winner was 1.71R. The best single trade made 1,000 dollars, which is 28.6 percent of the 3,500 dollar net, inside the 30 percent consistency ceiling most firms apply. With the filter off, the same charts produced 4 wins and 8 losses: winners of 2R, 2R, 1R and 1R against 8R of losses, a net of minus 2R, or minus 1,000 dollars. The gap rule did not turn a bad pattern good. It turned a losing version of the pattern into a winning one, which is the only kind of edge worth paying attention to: the kind that lives in the filter, not in the story.
One honest caveat. Twelve trades is a small sample, and a pattern this rare will take months to give you a bigger one. I am not claiming a 58 percent win rate as a permanent property of abandoned babies. I am claiming something narrower and more useful: in my own log, waiving the gap rule destroyed the result, and enforcing it preserved it. That is enough to keep the rule.
When the abandoned baby fails
Every failure I have logged falls into one of five buckets, and each one has a fix that does not involve abandoning the pattern. The most expensive bucket is the filled gap: price breaks out, then drifts straight back through the doji’s extreme and closes beyond it. That is the pattern telling you it was wrong, and the fix is to accept the stop instead of moving it. The second bucket is the chop doji: a doji that forms inside a range, where gaps are just spread widening between quiet candles. Rule 1, the trend requirement, is the fix, because a doji in a range has no trend to reverse.
| Failure mode | What it looks like | The fix |
|---|---|---|
| Gap fills immediately | Price closes back through the doji extreme within two candles | Take the stop; the story is dead, do not re-enter |
| Chop doji | Doji inside a sideways range, no prior trend | Rule 1: no trend, no trade |
| Weak third candle | Candle 3 closes short of candle 1’s midpoint | Rule 4: wait for the close, never enter mid-candle |
| News gap | Doji printed on a red-folder release candle | Rule 5: skip it, news gaps are not sentiment |
| Asian-session gap | Pattern completes in thin overnight hours | Rule 6: London or New York completion only |
The subtlest failure is the one that looks like a win at first. Price breaks in your direction, reaches target 1, you move the stop to breakeven, and then price grinds sideways for two days before stopping you at breakeven. That trade cost nothing and taught nothing, and the lesson is about expectations: abandoned babies are reversal trades, not trend trades. If the reversal does not extend within a few candles, the move is probably a bounce, and banking target 1 and letting the rest go at breakeven is the correct outcome, not a disappointment.
My session routine for a pattern this rare
A rare pattern needs a routine, or you will either miss it or start seeing it everywhere. I scan for abandoned babies twice a day, and the scan takes ten minutes, because the checklist is short and most charts fail it immediately. I do not watch charts for this pattern. I check them, and then I leave them alone, which is the only sustainable way to trade something that appears a few times a month.
| Time (UK) | Step | What I check |
|---|---|---|
| 07:00 | Overnight scan | GBPUSD and EURUSD four-hour charts for completed patterns in the Asian session, which I log but do not trade |
| 12:00 | London completion check | Any pattern whose third candle closed during London hours; measure both gaps in pips |
| 16:30 | New York completion check | Same check for New York completions; place orders only for patterns passing all six rules |
| 21:00 | Journal and close-out | Log the day’s candidates, including rejected ones, with the rule that rejected them |
Logging rejected candidates matters more than logging winners. My journal has a column for the rule that killed each setup, and rule 2, the gap rule, kills more than all the others combined. That column is the evidence that the filter is doing its job. If a month goes by with no rejected candidates, I am not being disciplined. I have stopped looking.
How it fits funded-account rules
The abandoned baby fits a funded account for three reasons, and none of them is that it wins often. First, its stop is structural: it sits behind a price level the market demonstrably refused to trade through, which means the risk on every trade is defined by the pattern, not by my mood. Second, its frequency is naturally capped: a pattern this rare cannot be overtraded, and overtrading is the fastest way to breach a daily loss limit without any single trade being at fault. Third, its best trade in my test stayed inside the consistency ceiling, at 28.6 percent of net profit, which means a firm applying a 30 percent single-day consistency rule would not flag the result.
It also pairs cleanly with the rest of my playbook. A tweezer tells me a level is agreed. An engulfing candle tells me momentum has flipped violently. A kicker tells me the flip happened overnight with no pause at all. The abandoned baby tells me the flip happened and the middle of it was empty, which is the strongest version of the same story. I trade all four, but I size the abandoned baby no larger than the others, because a rare pattern is not a better pattern. It is just a rarer one.
Frequently asked questions
How is an abandoned baby different from a morning star?
A morning star allows its middle candle to overlap the first and third candles. An abandoned baby does not: the doji must gap clear of both neighbours, wicks included. If any wick overlaps, trade it as a morning star, with extra confirmation, not as an abandoned baby.
Can I trade abandoned babies on forex, where true gaps are rare?
Yes, but expect very few setups. Forex trades around the clock, so genuine gaps mostly appear at the Sunday open or around major news. That scarcity is why the pattern works as a filter: it cannot be forced. If you need frequent trades, this is the wrong pattern.
What timeframe works best?
I trade it on the four-hour chart, where gaps are meaningful and stops fit inside a 500 dollar risk budget. On the daily chart the stops get large and the sizing gets small; on the hourly chart most gaps are spread noise. The four-hour chart is the compromise that keeps both the signal and the maths intact.
Where exactly do I put the stop?
For a bullish abandoned baby, below the doji’s low minus a small buffer of 3 pips. For a bearish one, above the doji’s high plus 3 pips. If price closes back through that level, the abandonment story is over and you exit, even if the stop has not been hit yet.
Why do you skip news dojis?
A doji printed on a red-folder news candle is a liquidity hole, not a sentiment shift. Spreads widen, stops slip, and the gap means nothing about what traders believe. News gaps fill fast and punish exactly the traders who treat them as signals.
How many abandoned baby trades should I expect per month?
On two pairs and one timeframe, I see one to three valid setups in a typical month, and some months none at all. That is normal. A month with no setup is a month where the filter did its job, not a month where you missed something.
Risk disclaimer: Trading leveraged products carries a high level of risk and may not be suitable for all investors. The examples in this article use a simulated 100,000 dollar funded account and are for education only; they are not financial advice. Never risk money you cannot afford to lose, and always check your own firm’s rulebook before trading any pattern.
Further reading: the classic pattern definition is BabyPips’ Abandoned Baby Forexpedia entry, which states the both-gaps rule this article is built on.



2 comments
[…] candle is not an island either — that is a different pattern, and I cover it separately in my abandoned baby guide, where one doji is isolated by two gaps. An island needs a cluster: at least two candles, and in my […]
[…] almost identical at a glance — and I already have full guides for the plain morning star and the abandoned baby. The difference between them is entirely in the middle candle and the gaps, and that difference […]