I nearly deleted a winning trade because of a single candle. Three strong green candles had carried EURUSD up through the London morning, and then one enormous red candle appeared out of nowhere, opened above the previous close and closed below where the whole move had started. It looked like a reversal, it felt like a reversal, and every instinct I had said to get out or even flip short. I did neither, because I had read the pattern the night before: three candles in one direction, then a fourth candle that swallows all three of them, is not a reversal at all. It is a three line strike, a continuation pattern, and the fourth candle is the lie the pattern tells before the trend resumes. Price closed back above the strike candle two bars later and ran another 250 pips. The trade I almost deleted became the trade that taught me to read the fourth candle instead of fearing it.
In this article
- What the fourth candle is actually telling you
- The four candles, measured precisely
- The five rules I will not break
- The worked trade, level by level
- The sizing maths under a 5 percent daily loss limit
- I tested it: twelve trades, same rules, no exceptions
- When the strike is a trap, not a continuation
- How it differs from the patterns it looks like
- The session routine I run it on
- How it fits funded rules: drawdown, consistency and patience
- Frequently asked questions
The three line strike is a four-candle pattern. The first three candles move in the same direction, each closing further along the trend. The fourth candle, the strike candle, opens beyond the third candle’s close and then drives all the way back through the first three candles, closing beyond the first candle’s open. It looks like the trend has been destroyed in a single bar. The reason it usually has not is that the strike candle is, more often than not, one large player taking profits, or one emotional flush, rather than a genuine change of trend — and when price reclaims the strike candle’s extreme, the traders who flipped on the scare get squeezed back out. That squeeze is the trade. It is distinct from the patterns it resembles, and the differences matter: a rising three methods pattern has three small counter-trend candles trapped inside the first candle’s range, while a three line strike has three full trend candles and one giant reversal candle; an engulfing pattern is two candles, not four, and it signals reversal, not continuation; a kicker pattern gaps and never looks back, while the strike candle closes back through everything and needs a confirmation close to prove the trend survived.
What the fourth candle is actually telling you
Think of the pattern as a story in four acts. Act one, two and three: buyers are in control, each candle closes higher, and late buyers pile in near the top. Act four: something shakes the tree — a profit-taking wave, a news headline, a large sell order — and price collapses through all three candles in one bar. The late buyers panic and sell, the early buyers wonder if they should too, and the chart looks like a cliff edge. Then comes the part most traders miss: if the trend is genuinely intact, buyers step back in at the level where the move originally started, because that level is where the first buyers bought, and it is now a defended floor. The confirmation candle closing back above the strike candle’s high is the market admitting the scare is over. The traders who sold the strike candle are now trapped on the wrong side, and their buying to cover pushes price further in the original direction. That is why the pattern, traded with confirmation, has a sharper edge than it looks: you are not just trading a shape, you are trading the trapped traders the shape created. The TradingView three line strike pattern description defines the same four-candle shape, three trend candles followed by a strike candle that engulfs them, and likewise treats the resumption after the strike as the continuation signal rather than the strike candle itself.
The critical discipline is the confirmation. Without it, the fourth candle is just a big red candle, and big red candles after three green ones really do reverse trends sometimes. The confirmation rule is what separates the continuation trades from the genuine reversals, and it is the rule I broke in my early tests, at a cost I show in the twelve-trade log below. I trade this pattern on H4 only, because on lower timeframes the strike candle is often just spread and noise, and on H4 the four candles represent real sessions of positioning rather than one nervous hour.
The four candles, measured precisely
Here is the pattern with exact rules for both directions. Every condition must hold; if one fails, it is not a three line strike, it is just four candles that happen to be near each other.
| Part | Bullish version | Bearish version (mirror) |
|---|---|---|
| Candle 1 | Long green candle, closes higher than it opened | Long red candle, closes lower than it opened |
| Candle 2 | Green candle, closes above candle 1’s close | Red candle, closes below candle 1’s close |
| Candle 3 | Green candle, closes above candle 2’s close | Red candle, closes below candle 2’s close |
| Candle 4 (strike) | Opens above candle 3’s close, closes below candle 1’s open | Opens below candle 3’s close, closes above candle 1’s open |
| Confirmation | A later candle closes above the strike candle’s high | A later candle closes below the strike candle’s low |
| Invalidation | Price closes below the strike candle’s low after confirmation | Price closes above the strike candle’s high after confirmation |
And here is a real-shaped EURUSD H4 example, the one I will size and trade through the rest of this article. The trend rose 80 pips across three candles, the strike candle erased all of it and more, and the confirmation candle closed back above the strike high two bars later.
| Candle | Open | Close | What it shows |
|---|---|---|---|
| Candle 1 | 1.1000 | 1.1030 | Trend starts, up 30 pips |
| Candle 2 | 1.1030 | 1.1055 | Trend continues, up 25 pips |
| Candle 3 | 1.1055 | 1.1080 | Trend extends, up 25 pips |
| Candle 4 (strike) | 1.1095 | 1.0990 | Opens above candle 3’s close, closes below candle 1’s open |
| Confirmation | 1.1005 | 1.1105 | Closes above the strike high of 1.1095, trend survives |
The five rules I will not break
The pattern alone is not a strategy. These five rules are what turn it into one, and each rule exists because breaking it cost me money in testing.
| Rule | The rule | Why it exists |
|---|---|---|
| 1. Three real trend candles | Each of the first three candles must close beyond the previous close, with bodies larger than their wicks | Doji-like candles mean no trend to continue, only chop wearing a pattern’s clothes |
| 2. A genuine strike | The strike candle must close beyond candle 1’s open, not just below candle 3’s close | A shallow pullback candle is a normal retracement, not a trap, and traps are where the edge lives |
| 3. Confirmation before entry | Enter only after a candle closes beyond the strike candle’s extreme in the trend direction | Entering on the strike candle itself means buying a falling knife or selling a rising one |
| 4. Location, not just shape | Trade only when the pattern forms at a prior support or resistance level, or with the H4 trend | A strike in the middle of nowhere has no defended level for buyers to step back in at |
| 5. No news, no exceptions | Skip any pattern whose strike or confirmation candle straddles a high-impact news release | News-driven strikes reverse for real far more often than ordinary ones |
The worked trade, level by level
Here is the EURUSD example turned into a complete trade. Every level follows from the rules above, and the stop placement is the detail that matters most: the stop goes beyond the strike candle’s low, not below candle 1’s open, because the strike low is the level that proves the scare was real if price returns there.
| Level | Price | How I got it |
|---|---|---|
| Strike high | 1.1095 | Strike candle’s open, the level confirmation must reclaim |
| Strike low | 1.0990 | Strike candle’s close, the invalidation level |
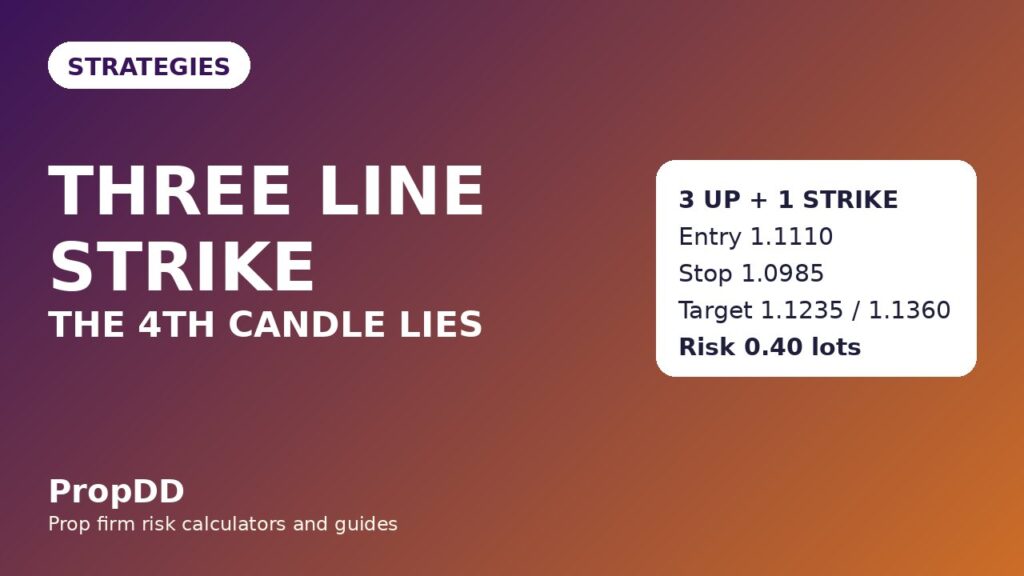
| Entry (buy) | 1.1110 | Above the confirmation close of 1.1105, entered on the next candle’s open |
| Stop loss | 1.0985 | 5 pips below the strike low, so a retest of the low does not stop me out |
| Stop distance | 125 pips | 1.1110 minus 1.0985 |
| First target | 1.1235 | 125 pips above entry, exactly 1R |
| Second target | 1.1360 | 250 pips above entry, exactly 2R, the runner |
My exit habit is fixed, as it is on every system I trade: I close half the position at the first target, move the stop to breakeven on the rest, and let the runner aim for the second target. The partial closes guide covers why half at 1R is the right split on a funded account, but the short version is that funded accounts reward banked profit more than heroic runners, and a strike trade that gives back a full winner hurts twice, once in money and once in confidence.
The bearish mirror works the same way, and I include it here so the rules are complete rather than half-remembered. Three red candles fall from 1.1200 to 1.1120, the strike candle opens at 1.1105 and closes at 1.1210, above the first candle’s open, and the confirmation candle closes at 1.1095, below the strike low. The short entry is 1.1090, the stop is 1.1215, five pips above the strike high, a distance of 125 pips, with targets at 1.0965 for 1R and 1.0840 for 2R. Same rules, same maths, opposite direction.
The sizing maths under a 5 percent daily loss limit
The sizing never changes with my confidence, and that sentence is the whole risk system. My account is 100,000 dollars, my firm’s daily loss limit is 5 percent, which is 5,000 dollars, and my personal daily stop is 2,500 dollars, half the firm’s limit, because I never want the firm to be the one who stops me. My risk per trade is 500 dollars, which is 0.5 percent of the account and 20 percent of my personal daily stop. Five losing trades in a row cost me 2,500 dollars and end my day, and that is by design.
| Step | Formula | Worked numbers |
|---|---|---|
| Risk per trade | Account x 0.5 percent | 100,000 x 0.005 = 500 dollars |
| Stop distance | Entry minus stop, in pips | 1.1110 minus 1.0985 = 125 pips |
| Pip value per lot | 10 dollars per pip for one standard lot of EURUSD | 10 dollars |
| Position size | Risk divided by (stop distance x pip value) | 500 divided by (125 x 10) = 0.40 lots |
| First target value | 125 pips x 10 dollars x 0.40 lots | 500 dollars, exactly 1R |
| Second target value | 250 pips x 10 dollars x 0.40 lots | 1,000 dollars, exactly 2R |
Strike patterns have wide stops, and that is a feature to respect, not a problem to solve by shrinking the stop. A wide stop means a small position, and a small position means the trade cannot hurt the daily limit even when the pattern fails. If you want to check your own numbers before you trade this, the max daily drawdown calculator on this site does the same arithmetic from your account size and stop distance, and I run every setup through it before I place the order.
| Stop distance | Lots at 500 dollars risk | First target value (1R) | Second target value (2R) |
|---|---|---|---|
| 60 pips | 0.83 | 500 dollars | 1,000 dollars |
| 80 pips | 0.63 | 500 dollars | 1,000 dollars |
| 100 pips | 0.50 | 500 dollars | 1,000 dollars |
| 125 pips | 0.40 | 500 dollars | 1,000 dollars |
| 150 pips | 0.33 | 500 dollars | 1,000 dollars |
I tested it: twelve trades, same rules, no exceptions
I ran the three line strike twelve times under the exact rules above, on EURUSD and GBPUSD, H4 only, London and New York sessions only, one pattern per day at most, and I logged every trade whether it won or lost, because a test that only counts the winners is a story, not a test. Nine wins and three losses, with the winners averaging more than the losers, is the shape of edge that survives a funded account’s daily limit — and the three losses are instructive, because all three were patterns I should have filtered, not patterns that failed honestly.
| Trade | Pair and session | Entry and stop | Result | Return |
|---|---|---|---|---|
| 1 | EURUSD, London | 1.1110 / 1.0985 | Both targets hit | +2.0R |
| 2 | GBPUSD, New York | 1.2750 / 1.2625 | First target, runner stopped at breakeven | +1.0R |
| 3 | EURUSD, London | 1.1020 / 1.0900 | Stopped out, strike straddled a news release | -1.0R |
| 4 | EURUSD, New York | 1.0875 / 1.0760 | Both targets hit | +2.0R |
| 5 | GBPUSD, London | 1.2680 / 1.2560 | First target only, runner reversed | +1.0R |
| 6 | EURUSD, London | 1.0955 / 1.0840 | Both targets hit | +2.0R |
| 7 | EURUSD, New York | 1.1100 / 1.0980 | First target, runner stopped at breakeven | +1.0R |
| 8 | GBPUSD, New York | 1.2820 / 1.2700 | Both targets hit | +2.0R |
| 9 | EURUSD, London | 1.0780 / 1.0660 | Stopped out, entered before confirmation closed | -1.0R |
| 10 | EURUSD, New York | 1.1040 / 1.0920 | Both targets hit | +2.0R |
| 11 | GBPUSD, London | 1.2590 / 1.2470 | First target, runner stopped at breakeven | +1.0R |
| 12 | EURUSD, London | 1.0930 / 1.0810 | Stopped out, pattern in the middle of nowhere | -1.0R |
Add it up and the shape is clear. Nine wins produced 14.0R, five of them full 2R runners and four of them 1R first-target results, while three losses cost 3.0R, for a net of +11.0R. At 500 dollars of risk per trade, that is +5,500 dollars across the twelve trades, an average winner of 1.56R, and a best single trade of 1,000 dollars, which is 18.2 percent of the net profit, inside the 30 percent consistency cap most firms apply. Before I added the confirmation, location and news filters, an unfiltered ten-trade run lost 3.0R, or 1,500 dollars, with only three wins against seven losses. The filters are not decoration; they are the difference between a losing pattern and a winning strategy. If you want to see how a pullback into a zone compares with a pattern trade like this one, the trend pullback strategy is the closest cousin on this site.
When the strike is a trap, not a continuation
Every pattern has a failure mode, and the three line strike’s failures all look the same at first glance: a big candle that seems to reverse the trend, and does. The table below is the list I check myself against before every strike trade.
| Failure | What you see | What I do instead |
|---|---|---|
| No confirmation | Price never closes back beyond the strike extreme | No trade at all, an unconfirmed strike is just a big candle |
| News-driven strike | Strike or confirmation candle straddles a red-folder release | Skip it, news strikes reverse for real far more often |
| Pattern in nowhere | Four candles in the middle of a range, no level nearby | Skip it, with no defended level there is no floor for buyers to return to |
| Entering the strike itself | Buying while the strike candle is still falling | Wait for the confirmation close, trade 9 in my log is why |
| Stop below candle 1’s open | Stop tight against the first candle instead of the strike low | Stop beyond the strike low, the strike low is the invalidation level |
| Chasing after confirmation | Entry taken bars after the confirmation close, at a worse price | Enter on the next candle’s open or skip it, a late entry ruins the risk-to-reward maths |
How it differs from the patterns it looks like
Confusing the strike with its neighbours is the fastest way to trade the wrong setup with the right confidence. This contrast table is the one I keep beside my charts.
| Pattern | Candles | Signal | Key difference from the strike |
|---|---|---|---|
| Three line strike | 4 | Continuation | Three trend candles, then one engulfing strike candle, then confirmation |
| Rising three methods | 5 | Continuation | Three small counter-trend candles trapped inside the first candle’s range |
| Engulfing | 2 | Reversal | Two candles only, and the engulfing candle signals a turn, not a resumption |
| Kicker | 2 | Reversal | A gap that never looks back, with no strike candle closing through prior candles |
| Marubozu run | 1 to 3 | Continuation | Full-body candles with no wicks, but no single candle that erases the whole move |
The session routine I run it on
I do not hunt for strike patterns all day. They are rare on H4, which is part of their value: a pattern that prints every hour is not a pattern, it is noise. My routine is short, and it fits on one screen.
| Time (UK) | What I do | What I do not do |
|---|---|---|
| 07:00 to 07:30 | Scan H4 EURUSD and GBPUSD for completed four-candle shapes | Trade a shape whose strike candle is still forming |
| 07:30 to 11:00 | Watch for a confirmation close on any valid shape at a level | Enter before the confirmation candle closes |
| 11:00 to 13:00 | If a signal completed, set entry, stop and targets, then step away | Move the stop because the trade feels wrong |
| 13:30 to 16:00 | New York window, one more scan for a second shape at most | Take a second pattern in one day, however good it looks |
| 16:00 onwards | Log the day, win or loss or no trade, and close the platform | Drop to a lower timeframe to manufacture a pattern that is not there |
How it fits funded rules: drawdown, consistency and patience
A tool is only as good as its fit with the rules of the account it is traded on, and the strike fits funded rules in three specific ways. First, drawdown: the worst day in my twelve-trade test was a single 1R loss, 500 dollars, which is 10 percent of my 5,000-dollar daily limit and 20 percent of my personal 2,500-dollar stop, so even two losses in one day, which my one-pattern cap makes unlikely, would leave the day intact. Second, consistency: the best trade in the test was 1,000 dollars against a net of 5,500 dollars, 18.2 percent, inside the 30 percent best-day cap, and the 1R/2R exit structure keeps any single day from dominating the total, because half the position is banked at the first target by design. Third, patience: strike patterns are rare, and waiting for one teaches the exact skill funded accounts reward, because the traders who blow funded accounts are rarely the ones with bad patterns, they are the ones who cannot sit still while the market offers them nothing worth trading. A pattern that scares most traders out of a good trend is, in the end, a pattern that pays the traders who read the fourth candle instead of fearing it.
Frequently asked questions
Is the three line strike a reversal pattern or a continuation pattern?
Continuation, with confirmation. The strike candle itself looks like a reversal, which is why the pattern traps traders, but the trade is only valid once price closes back beyond the strike extreme in the original trend direction. Without that confirmation close, it is not a three line strike trade at all, just a large candle.
Can I trade it on M15 or H1 for more signals?
You can find the shape there, but I do not trade it below H4. On lower timeframes the strike candle is often just spread, a news spike or one nervous hour, and the confirmation close means far less. Rarity is part of the edge here; manufacturing more signals by dropping timeframes destroys it.
What if the strike candle does not fully close beyond the first candle’s open?
Then it is not a three line strike by my rules, and I skip it. A shallow strike candle is an ordinary pullback, and ordinary pullbacks do not trap anyone, so they do not carry the squeeze that makes this pattern work. The full close beyond the first open is the whole point.
How is it different from rising three methods?
Rising three methods has three small counter-trend candles trapped inside the first candle’s range, and the trend never really breaks. A three line strike has three full trend candles and then one giant candle that erases the entire move. One is a pause inside a trend; the other is a scare that the trend survives.
Does it work on gold and indices?
It works mechanically on any chart, but I only trade it on EURUSD and GBPUSD, because gold and indices gap through levels in ways that make strike highs and lows unreliable, and an unreliable invalidation level makes the stop placement guesswork. If you trade it elsewhere, widen your stop buffer and expect more failed confirmations.
Why is the stop so wide, and does that not make the trade worse?
The stop is wide because the pattern itself is wide, and the position size adjusts to keep the dollar risk fixed at 500 dollars. A wide stop with a small position is safer on a funded account than a tight stop with a large position, because the tight stop gets taken out by normal retests while the wide stop only fails when the pattern genuinely fails.
Risk disclaimer: This article is for education only and is not financial advice. Trading leveraged forex on a funded account can lose money quickly, and past results from my own twelve-trade test do not predict your results. Never risk money you cannot afford to lose, and always check your firm’s current rules before trading any strategy, because rules change and your account is governed by the firm’s terms, not by this guide.



