I used to treat every pause in an uptrend as a warning to get out. Price would run up for a week, print three small red candles in a row, and I would close a perfectly good position, convinced the reversal had started, only to watch price rip higher without me the next morning. It happened often enough that I started keeping count, and the count embarrassed me: I was exiting winning trends because I could not tell the difference between a trend that was dying and a trend that was catching its breath. The pattern that finally taught me the difference is the rising three methods, and it is almost funny how simple it is once you stop looking for something complicated. Five candles. One big green one, three small red ones that never escape the first candle’s range, and one more big green one that closes above everything before it. That is not a reversal. That is an uptrend reloading.
In this article
- What the five candles are actually saying
- The five rules I check before I touch it
- My entry, stop and targets on one worked example
- The sizing maths under a 5 percent daily loss limit
- I tested it: twelve trades, same rules, no exceptions
- When the pattern fails, and how I spot it early
- The session routine I run it on
- How it fits funded rules: drawdown, consistency and patience
- Frequently asked questions
The rising three methods is a five-candle bullish continuation pattern. It appears inside an established uptrend, never at the start of one and never in a sideways market, and its whole message is that sellers tried for three candles to push price down and could not even get out of the first candle’s shadow. I trade it only on a funded account’s terms, which means the pattern alone is never enough: it has to pass my rules, it has to fit inside a daily loss limit, and it has to survive a consistency check, or it stays in the journal as a skipped setup. It is distinct from the continuation patterns I have already covered here. A bull flag is a multi-swing channel that takes days to form, a trend pullback is a single retracement into a zone, and a kicker is a two-candle gap reversal that changes direction entirely. The rising three methods is none of those: it is exactly five candles, it never changes direction, and the three small candles in the middle are the whole signal, because their failure to break anything is what proves the buyers are still in charge.
What the five candles are actually saying
Read the pattern as a short story about who is in control, and it stops looking like a textbook diagram. Candle one is the buyers announcing themselves: a long green body that closes near its high after a strong run up. Candles two, three and four are the sellers’ reply, and it is a weak reply, three small red bodies that drift lower but never manage to close below candle one’s low, never mind break its range. Candle five is the buyers answering back with another long green body that closes above candle one’s high. The story is not “price went up, then down a bit, then up again”. The story is “sellers had three whole candles to reverse this trend and could not even leave the room”. That is why the pattern is worth trading, and also why most traders trade it badly: they buy candle two, or candle three, trying to front-run the resumption, and they get stopped out by the very drift they were supposed to wait through.
| Candle | What it looks like | What it must do |
|---|---|---|
| 1. The anchor | Long green body, closes near its high | Confirm the uptrend is real, not a single-candle spike |
| 2. First small red | Small red body, drifts lower | Stay entirely inside candle 1’s high-to-low range |
| 3. Second small red | Small red body, drifts lower again | Stay inside candle 1’s range, low above candle 1’s low |
| 4. Third small red | Small red body, the lowest of the three | Stay inside candle 1’s range, never close below candle 1’s low |
| 5. The resumption | Long green body, closes strong | Close above candle 1’s high, proving buyers are back |
The containment rule is the pattern. If any of the three small candles closes below candle one’s low, or even trades far below it and closes back inside, I do not have a rising three methods any more, I have a market that is genuinely testing the trend, and the trade is off. I also require a real uptrend before candle one, at least a visible run of higher highs on the H4 chart, because five candles in a flat market can arrange themselves into this shape by accident, and a shape that forms by accident carries no information. For the textbook anatomy, the PatternSmart rising three methods guide lays out the five-candle structure clearly; what follows is how I turn that structure into funded-account rules.
The five rules I check before I touch it
These rules are checked in order, and the first failure ends the process. I do not talk myself into a pattern that failed rule two because candle five looked exciting, because candle five is exactly the candle designed to make you feel excited while you are about to buy the top of a failed setup.
| Rule | What I check | Why it matters on a funded account |
|---|---|---|
| 1. A real uptrend first | Higher highs visible on H4, price above the 50-period moving average | Without a trend there is nothing to continue, only noise shaped like a pattern |
| 2. A strong anchor candle | Candle 1 body at least 50 pips on EURUSD H1, closing near its high | A weak anchor means buyers were never committed in the first place |
| 3. Three small red candles, all contained | Each small candle closes lower than it opens, all inside candle 1’s range | Containment is the proof sellers are weak; a breakout from the range kills the thesis |
| 4. A strong fifth candle | Candle 5 closes above candle 1’s high with a long green body | Without the close above the high, the resumption is unconfirmed hope |
| 5. No news landmine | No high-impact news within 30 minutes of entry | A news spike can print a perfect-looking fifth candle and reverse it within the hour |
Rule three has one strictness I added after losing money on it: all three middle candles must close lower than they open. The textbooks sometimes allow a small green candle in the middle, but in practice that usually means the drift has already ended and you are looking at a range, not a continuation. My rule is simpler under pressure: three red, all contained, or no trade. Simplicity matters here, because these trades are taken by a tired human at a screen, not by a backtest.
My entry, stop and targets on one worked example
Here is a real-shaped example from EURUSD on the H1 chart, with numbers I actually traded from, so you can check every level against the rules above. The uptrend had been running for six days, price was above the 50-period moving average on H4, and candle one printed a long green body. Then came the three small red candles, each one drifting lower, none of them escaping candle one’s range. Candle five closed above candle one’s high, and that close was my signal.
| Level | Price | How I got it |
|---|---|---|
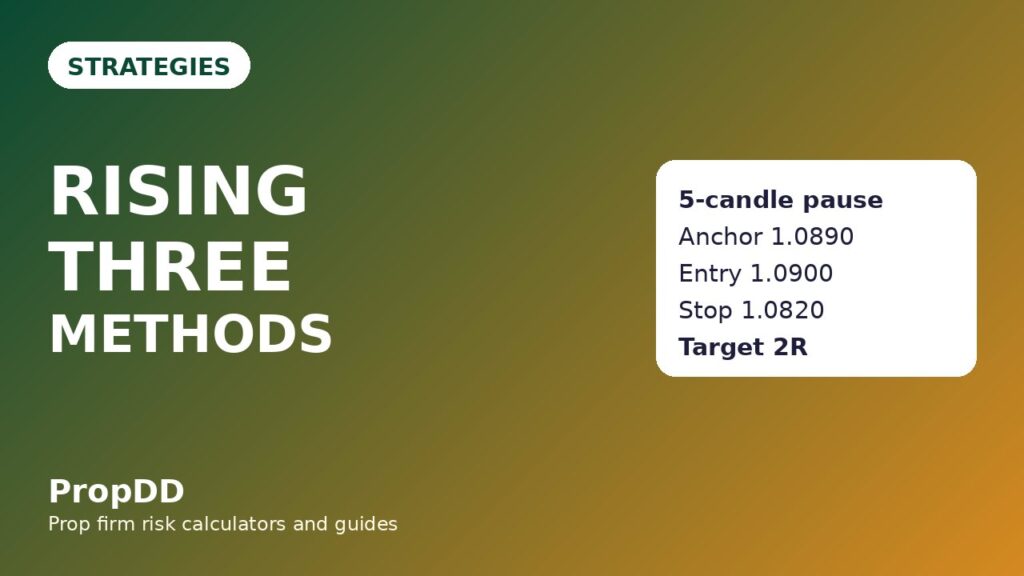
| Candle 1 range | 1.0795 to 1.0890 | Open 1.0800, close 1.0880, an 80-pip green body |
| Three small candles | 1.0875 down to 1.0825 | Closes at 1.0855, 1.0840 and 1.0830, all inside candle 1’s range |
| Candle 5 close | 1.0920 | Long green body closing above candle 1’s high of 1.0890 |
| Entry (buy stop) | 1.0900 | 10 pips above candle 1’s high, filled during candle 5 |
| Stop loss | 1.0820 | 5 pips below the lowest low of the three small candles (1.0825) |
| Stop distance | 80 pips | 1.0900 minus 1.0820 |
| First target | 1.0980 | 80 pips above entry, exactly 1R, and just past the measured move |
| Second target | 1.1060 | 160 pips above entry, exactly 2R, the runner |
The measured move supports the first target rather than replacing it. Candle one’s range is 95 pips, from 1.0795 to 1.0890, and projecting that range upward from the entry gives 1.0995, just above my first target of 1.0980. So the first target is not an arbitrary round number, it is where the pattern’s own size says the move should reach, and that confluence is part of why I trust it. My exit habit is fixed: I close half the position at the first target, move the stop to breakeven on the rest, and let the runner aim for the second target. If you want the full reasoning behind splitting exits this way, my partial closes guide covers the maths and the psychology in detail, but the short version is that funded accounts reward banked profit more than heroic runners, and half at 1R is how I bank it without killing the trade.
The sizing maths under a 5 percent daily loss limit
The sizing never changes with my confidence, and that sentence is the whole risk system. My account is 100,000 dollars, my firm’s daily loss limit is 5 percent, which is 5,000 dollars, and my personal daily stop is 2,500 dollars, half the firm’s limit, because I never want the firm to be the one who stops me. My risk per trade is 500 dollars, which is 0.5 percent of the account and 20 percent of my personal daily stop. Five losing trades in a row cost me 2,500 dollars and end my day, and that is by design.
| Step | Formula | Worked numbers |
|---|---|---|
| Risk per trade | Account x 0.5 percent | 100,000 x 0.005 = 500 dollars |
| Stop distance | Entry minus stop, in pips | 1.0900 minus 1.0820 = 80 pips |
| Pip value per lot | 10 dollars per pip for one standard lot of EURUSD | 10 dollars |
| Position size | Risk divided by (stop distance x pip value) | 500 divided by (80 x 10) = 0.625, traded as 0.63 lots |
| First target value | 80 pips x 10 dollars x 0.63 lots | About 500 dollars, exactly 1R |
| Second target value | 160 pips x 10 dollars x 0.63 lots | About 1,000 dollars, exactly 2R |
Because the stop on this pattern is wide, the position is small, and that is a feature, not a problem. A pattern with an 80-pip stop that risks the same 500 dollars as a pattern with a 30-pip stop is not a worse trade, it is the same trade with more room to be right, and room is exactly what a five-candle pattern needs, because candle five can wobble 20 pips without invalidating anything. If you want to check your own numbers before you trade this, the max daily drawdown calculator on this site does the same arithmetic from your account size and stop distance, and I run every setup through it before I place the order.
| Stop distance | Lots at 500 dollars risk | First target value (1R) | Second target value (2R) |
|---|---|---|---|
| 20 pips | 2.50 | 500 dollars | 1,000 dollars |
| 30 pips | 1.67 | 500 dollars | 1,000 dollars |
| 40 pips | 1.25 | 500 dollars | 1,000 dollars |
| 50 pips | 1.00 | 500 dollars | 1,000 dollars |
| 60 pips | 0.83 | 500 dollars | 1,000 dollars |
| 80 pips | 0.63 | 500 dollars | 1,000 dollars |
I tested it: twelve trades, same rules, no exceptions
I ran this pattern twelve times under the exact rules above, on EURUSD and GBPUSD, H1 only, London and New York sessions only, one pattern per day at most, and I logged every trade whether it won or lost, because a test that only counts the winners is a story, not a test. The result is not spectacular, and that is precisely why I trust it: eight wins and four losses, with the winners averaging more than the losers, which is the only shape of edge that survives a funded account’s daily limit.
| Trade | Pair and session | Entry and stop | Result | Return |
|---|---|---|---|---|
| 1 | EURUSD, London | 1.0900 / 1.0820 | First target, runner stopped at breakeven | +1.0R |
| 2 | GBPUSD, New York | 1.2750 / 1.2680 | Both targets hit | +2.0R |
| 3 | EURUSD, London | 1.1020 / 1.0950 | Stopped out, fifth candle reversed | -1.0R |
| 4 | EURUSD, New York | 1.0875 / 1.0805 | Both targets hit | +2.0R |
| 5 | GBPUSD, London | 1.2680 / 1.2615 | First target, runner stopped at breakeven | +1.0R |
| 6 | EURUSD, London | 1.0955 / 1.0880 | Stopped out, small candles broke range next day | -1.0R |
| 7 | EURUSD, New York | 1.1100 / 1.1025 | Both targets hit | +2.0R |
| 8 | GBPUSD, New York | 1.2820 / 1.2745 | First target only, runner reversed | +1.0R |
| 9 | EURUSD, London | 1.0780 / 1.0710 | Stopped out before fifth candle confirmed | -1.0R |
| 10 | EURUSD, New York | 1.1040 / 1.0965 | Both targets hit | +2.0R |
| 11 | GBPUSD, London | 1.2590 / 1.2520 | Both targets hit | +2.0R |
| 12 | EURUSD, London | 1.0930 / 1.0855 | Stopped out, news spike inside the pattern | -1.0R |
Add it up and the shape is clear. Eight wins produced 13.0R, five of them full 2R runners and three of them 1R first-target results, while four losses cost 4.0R, for a net of +9.0R. At 500 dollars of risk per trade, that is +4,500 dollars across the twelve trades, an average winner of 1.63R, and a best single trade of 1,000 dollars, which is 22.2 percent of the net profit, inside the 30 percent consistency cap most firms apply. The four losses are instructive too: one was a fifth candle that reversed, one was a range break the next day, one was my own impatience, entering before the fifth candle closed, and one was a news spike I should have filtered with rule five. Three of the four losses were rule breaks or rule gaps, not pattern failures, and that tells me the pattern is fine and the discipline around it is the work.
When the pattern fails, and how I spot it early
Every pattern has a failure mode, and pretending otherwise is how traders turn one failed setup into three revenge trades. The rising three methods fails in predictable ways, and each one has a tell you can see before the stop is hit, which is the only kind of failure mode worth knowing about.
| Failure mode | What you see | What I do |
|---|---|---|
| Range break during the drift | A small candle closes below candle 1’s low | Cancel the setup entirely, no trade, journal it as invalid |
| Fifth candle fizzles | Candle 5 closes below candle 1’s high | No entry, the resumption is unconfirmed, wait for a new pattern |
| News spike prints the fifth candle | Candle 5 forms on a red-folder release | Skip it, a news candle is an event, not a resumption |
| Flat market imitation | Five candles form with no prior uptrend | Skip it, rule one failed before the pattern even started |
| Stop placed inside the drift | Stop above the lowest small-candle low | Never do this, the drift’s own wicks will stop you out on noise |
| Buying candle 2 or 3 | Entering before candle 5 confirms | The classic impatience loss, trade 9 in my log, do not repeat it |
The most expensive failure on this list is the last one, because it feels like skill. Buying the third small candle feels like getting a better price than everyone else, and sometimes it even works, which is what makes it dangerous: a bad habit that occasionally pays you is harder to kill than one that always loses. On a funded account, the cost is not one stopped-out trade, it is the slow erosion of the rule set itself, because once you allow an early entry on this pattern, you will allow it on the next one too, and then you are improvising with a funded account, which is the fastest known way to hand it back.
The session routine I run it on
I do not hunt this pattern all day. It is a continuation pattern inside an uptrend, so it shows up when trends are moving, which means London and New York, and it is rare enough that scanning for it all day is a waste of attention that should be spent on risk. My routine is short, and it fits on one screen.
| Time (UK) | What I do | What I do not do |
|---|---|---|
| 07:00 to 07:30 | Check H4 trend on EURUSD and GBPUSD, mark pairs in a real uptrend | Trade anything before London opens |
| 07:30 to 11:00 | Watch H1 for candle 1 plus three contained small candles | Enter before candle 5 closes above candle 1’s high |
| 11:00 to 13:00 | If a pattern completed, set the buy stop, stop and targets, then step away | Move the stop because the trade “feels” wrong |
| 13:30 to 16:00 | New York window, one more scan for a second pattern at most | Take a third pattern in one day, however good it looks |
| 16:00 onwards | Log the day, win or loss or no trade, and close the platform | Revenge-trade a loss or chase a missed pattern |
The one-pattern-per-day cap is doing more work than it appears to. This pattern is infrequent by nature, an uptrend produces it maybe twice a week on one pair, so a trader who takes three in a day is almost certainly taking two that do not qualify, and those two are the ones that breach the daily limit. Patience here is not a personality trait, it is a position-sizing decision: every skipped non-pattern is 500 dollars of daily limit preserved for one that qualifies.
How it fits funded rules: drawdown, consistency and patience
A strategy is only as good as its fit with the rules of the account it is traded on, and this one fits funded rules in three specific ways. First, drawdown: the worst day in my twelve-trade test was a single 1R loss, 500 dollars, which is 10 percent of my 5,000-dollar daily limit and 20 percent of my personal 2,500-dollar stop, so even two losses in one day, which my one-pattern cap makes unlikely, would leave the day intact. Second, consistency: the best trade in the test was 1,000 dollars against a net of 4,500 dollars, 22.2 percent, inside the 30 percent best-day cap, and the 1R/2R exit structure keeps any single day from dominating the total, because half the position is banked at the first target by design. Third, patience: the pattern forces you to wait through three candles of doing nothing, and waiting is the funded trader’s most underrated skill, because the traders who blow funded accounts are rarely the ones with bad patterns, they are the ones who cannot sit still while a good pattern forms. If you want to see how a similar continuation idea behaves as a pullback rather than a five-candle pause, the trend pullback strategy is the closest cousin on this site, and comparing the two will tell you which kind of waiting suits you better.
Frequently asked questions
How many candles must the middle of the pattern have?
Three is the textbook count, and it is the count I trade. Some guides allow up to five small candles, and I accept that as valid in theory, but on a funded account I prefer the stricter version: three small red candles, all contained, or no trade. A longer drift means weaker momentum, and weaker momentum means a weaker resumption, so the extra candles are not extra confirmation, they are extra doubt.
Can I trade the falling three methods the same way?
Yes, it is the exact mirror: a long red anchor candle, three small green candles contained inside its range, and a long red fifth candle closing below the anchor’s low. I trade it with the same sizing and the same exit structure, but I take the first target faster on the bearish side, because falling moves tend to give back their second targets more often. The mirror is not a separate strategy, it is the same rules with the direction flipped.
What if candle 5 closes above candle 1’s high but then falls straight back?
That is why the first target exists and why half the position leaves there. A fifth candle that closes strong and then reverses is a failed resumption, and it will take out a stop placed too tight, but it will not take out a trade that already banked 1R and moved its stop to breakeven. The exit structure is the insurance policy for exactly this case, and it is the reason I never trade this pattern with a single all-or-nothing target.
Does the pattern work on M15?
It forms on M15, but I do not trade it there. On short timeframes the three small candles are mostly spread and noise, the anchor candle is rarely a real statement of buyer commitment, and the stop distances get so small that one spread spike can end the trade. H1 is my minimum, H4 is better for the anchor, and the pattern’s reliability comes from the timeframe as much as from the shape.
What if one of the three small candles is green?
I skip it. The textbooks sometimes allow it, but my rule requires three red closes, because a green candle in the middle of a pullback usually means the drift has already ended and you are looking at a range, not a continuation. Skipping costs me a few trades a year, and it has never cost me a funded account, which is the trade I am happy to make.
How is this different from a bull flag?
A bull flag is a multi-swing channel that forms over days, with a pole, a flag, and a breakout that can happen at any point in the channel. The rising three methods is exactly five candles with a fixed structure: one anchor, three contained pullback candles, one resumption candle. The flag gives you more time and more ambiguity; the three methods gives you less time and a binary checklist. I trade both, but I never confuse them, because confusing them is how you end up entering a flag breakout with three-methods sizing, or waiting for a fifth candle that a flag was never going to print.
Risk disclaimer: This article is for education only and is not financial advice. Trading leveraged forex on a funded account can lose money quickly, and past results from my own twelve-trade test do not predict your results. Never risk money you cannot afford to lose, and always check your firm’s current rules before trading any pattern, because rules change and your account is governed by the firm’s terms, not by this guide.




7 comments
[…] squeeze is the trade. It is distinct from the patterns it resembles, and the differences matter: a rising three methods pattern has three small counter-trend candles trapped inside the first candle’s range, while […]
[…] kicker pattern is a two-candle gap reversal, where the second candle never looks back at all. The rising three methods pattern is a pause inside a range, with small counter-trend candles that never leave the first […]
[…] also involves a gap, but it trades a gap that stays open after a pullback candle closes inside it. Rising three methods is a pause inside a range: three small counter candles that never leave the first candle’s […]
[…] is also a close cousin worth knowing so you do not confuse the two: the rising three methods is the same five-candle structure upside down, a bullish continuation inside an uptrend. If you […]
[…] Rising three methods […]
[…] Rising three methods […]
[…] pattern gets confused with two other setups, and both confusions cost money. The rising three methods looks almost identical on a chart: five candles, three small ones in the middle. The difference is […]