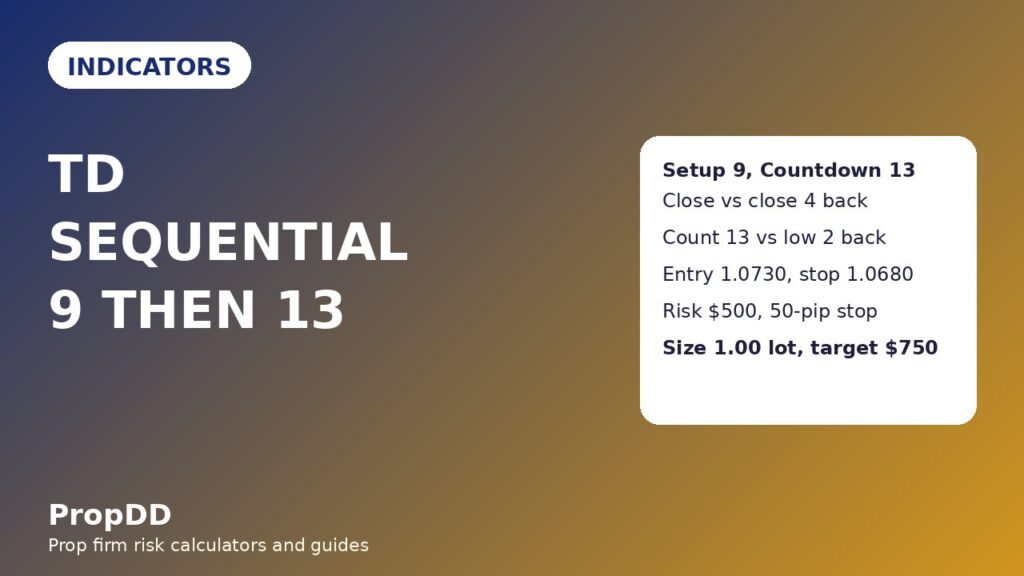
I lost 500 dollars fading a downtrend because it “had fallen too far”. EURUSD had dropped for nine straight sessions, every candle red, and I bought the tenth day convinced the fall had to bounce. It fell for nine more days. The mistake was not the direction of my guess; it was that I had no count. “Too far” is a feeling, and feelings do not survive a funded account’s daily loss limit. A year later I watched the same kind of fall, but this time I counted it: nine closes, each one lower than the close four bars earlier, and then a second, slower count that took thirteen more qualifying bars to finish. I waited for both counts to complete before I bought, and the bounce I had chased a year earlier finally arrived with a stop and a target attached. That tool was TD Sequential, and this article gives the full funded-account version: what it measures, its two formulas, the settings I use, how to read its signals, a worked trade with real numbers, and the mistakes that cost me money before I learned to count.
In this article
- What TD Sequential Measures
- The Formula: TD Setup 9
- The Formula: TD Countdown 13
- Best Settings for Prop Firm Trading
- How to Read Its Signals
- Worked Example: A Completed 13 Trade With Real Numbers
- Position-Sizing Maths Under a Daily Loss Limit
- I Tested It: Setup 9 Alone Against the Full 9-13
- Common Mistakes With TD Sequential
- How It Fits Prop Firm Rules
- Frequently Asked Questions
TD Sequential is a counting indicator created by Tom DeMark. It does not average prices, it does not measure momentum with a formula, and it does not draw lines. It counts closes against closes from a fixed number of bars earlier, and it prints two numbers traders learn to respect: a 9 and a 13. The 9, called the TD Setup, flags a trend that is starting to tire. The 13, called the TD Countdown, flags a trend that has run much further into exhaustion. On a funded account that distinction is the whole point: a Setup 9 alone is a warning, and a completed Countdown 13 is a tradeable zone. Trading every 9 as if it were a 13 is how I lost that first 500 dollars, because most 9s are followed by a pause and then more trend, not by a reversal.
What TD Sequential Measures
TD Sequential measures exhaustion, not direction. A trend-following indicator tells you which way price is moving; TD Sequential tells you how long price has been moving that way without a meaningful break in the pattern, and therefore how stretched the move is becoming. It is a counter-trend timing tool by design: it looks for the point where a long run of selling (or buying) has run its course, not for the next leg of the trend. That makes it dangerous in exactly the situation where it looks most attractive, because a strong trend can complete a Setup, complete a Countdown, and then simply start a fresh Setup in the same direction. The count says the move is stretched. It never says the move is finished.
That is why I use TD Sequential as a filter and a timing device, never as a standalone system. A completed 13 tells me where to look for a reversal trade and where to place the stop. It does not tell me the reversal will happen, and it does not set my target. My entry still needs a confirmation close, my stop still sits beyond the exhaustion extreme, and my size still comes from the daily loss limit, not from how confident the count makes me feel. Used that way, the count has saved me from chasing more trades than any other tool I own. Used as a signal by itself, it will hand you a reversal trade in the middle of a trend that has no intention of reversing, and a funded account does not forgive that trade twice.
The Formula: TD Setup 9
The Setup is the first count, and its rule is simple enough to check by hand. For a Buy Setup, you need nine consecutive closes, each one lower than the close four bars earlier. For a Sell Setup, the mirror: nine consecutive closes, each one higher than the close four bars earlier. If a single close breaks the run, the count resets to zero and starts again. There is one prerequisite before the count can begin: a price flip, a close in the opposite direction to the setup, which marks the switch in momentum. In practice, on a chart with the indicator loaded, the flip is handled for you, but knowing it exists matters, because a Setup that starts without a flip is usually just the tail of the previous count.
Here is a Buy Setup on EURUSD, counted bar by bar. The four closes before the count are shown so every comparison can be checked:
| Setup bar | Close | Close 4 bars earlier | Counts? |
|---|---|---|---|
| 1 | 1.0980 | 1.1020 | Yes, lower |
| 2 | 1.0960 | 1.1005 | Yes, lower |
| 3 | 1.0945 | 1.0990 | Yes, lower |
| 4 | 1.0920 | 1.0985 | Yes, lower |
| 5 | 1.0900 | 1.0980 (bar 1) | Yes, lower |
| 6 | 1.0880 | 1.0960 (bar 2) | Yes, lower |
| 7 | 1.0860 | 1.0945 (bar 3) | Yes, lower |
| 8 | 1.0840 | 1.0920 (bar 4) | Yes, lower |
| 9 | 1.0820 | 1.0900 (bar 5) | Yes, lower |
A Setup 9 has one quality check, called perfection. For a Buy Setup, the low of bar 8 or bar 9 must be lower than the lows of bars 6 and 7. In this example the lows are 1.0870 for bar 6, 1.0850 for bar 7, 1.0830 for bar 8 and 1.0810 for bar 9, so bar 9’s low of 1.0810 sits below both, and the Setup is perfected. An unperfected Setup is not worthless, but DeMark’s own rule says to expect a fresh low, or at least a retest of the low, before trusting it, and my testing agrees: I only trade Countdown completions that follow a perfected Setup. For the full staged rules, including the intersection check between Setup and Countdown, see MarketInOut’s TD Sequential trading system guide.
The Formula: TD Countdown 13
The Countdown is the second count, and it runs on a different comparison. It can only start after a Setup 9 has completed, and it does not need consecutive bars. For a Buy Countdown, you count every bar whose close is at or below the low two bars earlier. Bars that fail the test are simply skipped, not counted, and the count resumes on the next qualifying bar. The Countdown is complete when it reaches 13. There is also a qualifier on the final bar: the low of Countdown bar 13 must be at or below the close of Countdown bar 8, or the 13 is deferred and the count stays at 12 until a bar satisfies both conditions.
Here is the Countdown that followed the Setup above, with the qualifying bars listed. Non-qualifying bars in between are skipped, which is why the Countdown takes far longer in calendar time than the Setup:
| Countdown bar | Close | Low 2 bars earlier | Counts? |
|---|---|---|---|
| 1 (Setup bar 9) | 1.0820 | 1.0850 | Yes, close below the low |
| 2 | 1.0810 | 1.0825 | Yes |
| 3 | 1.0800 | 1.0815 | Yes |
| 4 | 1.0790 | 1.0805 | Yes |
| 5 | 1.0780 | 1.0795 | Yes |
| 6 | 1.0770 | 1.0785 | Yes |
| 7 | 1.0760 | 1.0775 | Yes |
| 8 | 1.0750 | 1.0765 | Yes |
| 9 | 1.0740 | 1.0755 | Yes |
| 10 | 1.0730 | 1.0745 | Yes |
| 11 | 1.0720 | 1.0735 | Yes |
| 12 | 1.0710 | 1.0725 | Yes |
| 13 | 1.0700 | 1.0715 | Yes, and the qualifier holds: bar 13’s low of 1.0690 is below bar 8’s close of 1.0750 |
Two details in this table are worth pausing on. First, Countdown bar 1 is Setup bar 9 itself, because its close of 1.0820 already sits below the low two bars earlier, 1.0850. That is allowed: the Countdown can start from bar 9 of the Setup when the condition is met, otherwise it waits for the first bar that satisfies it. Second, the Countdown bars do not have to be consecutive, which is the feature that makes the count honest. A Setup demands nine bars in a row, so it fires fast in a sharp fall. A Countdown only counts bars that keep closing beyond the extreme two bars back, so in a choppy decline it can take fifteen to thirty bars to reach 13, and that slow grind is itself information: the longer the Countdown takes, the more the trend has already spent itself.
Best Settings for Prop Firm Trading
TD Sequential has no period to optimise in the usual sense: the 4, 9, 2 and 13 are the method itself, not inputs to tune. Changing them to fit recent price action is curve-fitting, and it destroys the one thing the count offers, which is a fixed rule that gives the same answer to every trader on the same finished chart. The settings that do matter on a funded account are the timeframe, the signal grade, and the confirmation rule:
| Setting | My funded rule | Why |
|---|---|---|
| Chart timeframe | Daily for the count, H4 to time the entry | Daily counts are rare enough to matter; M15 counts fire constantly and mean nothing |
| Signal grade traded | Completed Countdown 13 only, never a Setup 9 alone | The 9 is a warning; the 13 is the exhaustion zone my test actually made money on |
| Setup quality | Perfected Setup only, low of bar 8 or 9 below bars 6 and 7 | An unperfected Setup still owes the market a fresh low |
| Confirmation | A close back above the high of the 13 bar before entry | Buying into a still-falling count is catching a falling knife with a number on it |
| Invalidation | A new Setup in the opposite direction, or a close beyond the 13 bar’s extreme | Either event says the exhaustion story is over, whichever way it breaks |
| News filter | No new entry within 30 minutes either side of high-impact EUR or USD news | News can print a fresh Setup in minutes and strand a count trade |
The daily timeframe deserves emphasis because it is the setting most traders get wrong with this tool. On a 15-minute chart, a Setup 9 completes several times a week, and a Countdown 13 completes often enough to feel like a system. It is not a system; it is noise counted carefully. On the daily chart, a completed 13 is a monthly-scale event, and that rarity is what makes it worth waiting for. My funded rule is blunt: if the count is not on the daily chart, I do not trade it, and if the daily count has not reached 13, I do not borrow conviction from a lower timeframe’s count.
How to Read Its Signals
TD Sequential gives four readings, and only one of them is an entry. The other three are warnings, and treating a warning as an entry is the most expensive counting mistake:
| Reading | What the count shows | What I do |
|---|---|---|
| Setup 9 completes | Nine consecutive closes beyond the close four bars back | Warning only: stop adding to trend trades, start watching for a Countdown |
| Countdown in progress | Count between 1 and 12 after a perfected Setup | Wait: no entry, no matter how stretched the chart looks |
| Countdown 13 completes | Thirteen qualifying closes, qualifier satisfied | Trade candidate: entry on a confirmation close above the 13 bar’s high |
| Fresh Setup in the same direction after a 13 | The trend restarts its count instead of reversing | Exit: the exhaustion story failed, and the trend is running again |
The asymmetry matters. A Setup 9 in a strong trend is common, and fading it is a bet against momentum with no exhaustion evidence behind it. A completed 13 is rarer and carries the weight of both counts: nine bars of unbroken momentum followed by thirteen bars of closes that kept pushing beyond the recent extreme. Even then, the 13 is a zone, not a trigger. My entry rule exists because the count alone cannot tell me the turn has started; only price closing back above the 13 bar’s high tells me sellers have stopped making new extremes, and that is the first moment the reversal story has evidence instead of arithmetic.
Worked Example: A Completed 13 Trade With Real Numbers
Here is the EURUSD daily count from the two tables above, traded exactly as I trade it. The Setup completed at 1.0820, the Countdown completed at 1.0700 with its qualifier satisfied, and the confirmation came on the next close above the 13 bar’s high of 1.0720:
| Plan element | My rule | Worked numbers |
|---|---|---|
| Entry | Buy on the confirmation close above the 13 bar’s high, entered at the next open | Entry 1.0730 |
| Stop loss | 10 pips below the 13 bar’s low | Stop 1.0680, a 50-pip stop (13 bar low 1.0690) |
| Take profit 1 | Close half at the same distance as the stop | Half closed at 1.0780, up 50 pips |
| Take profit 2 | Close the rest at twice the stop distance | Rest closed at 1.0830, up 100 pips |
| Invalidation | A daily close below the 13 bar’s low before entry means no trade | A close below 1.0690 cancels the setup |
Notice that the targets are not drawn from the count. The count tells me where exhaustion lives; the stop and targets come from the 13 bar’s own range, which is why the maths stays honest. A 50-pip stop below a genuine exhaustion low, a 50-pip first target for half the position, and a 100-pip second target for the rest gives a blended 1.5R when both targets hit, and that shape repeats across my count trades because the stop is always anchored to the same kind of extreme. When the 13 bar’s range is unusually wide, the stop grows, the size shrinks, and the trade either still fits the 500-dollar risk cap or it is skipped. The count never justifies a bigger risk.
Position-Sizing Maths Under a Daily Loss Limit
The sizing formula is the same one I use for every indicator, and the Countdown’s stop distance is what makes it matter. My account is 100,000 dollars, the firm’s daily loss limit is 5,000 dollars, and my personal daily stop is 1,000 dollars, well below the firm’s line. Two full 500-dollar losses end my day by my own rule, before the firm ever has to. The worked trade above sizes like this:
| Input | Value | Maths |
|---|---|---|
| Risk per trade | 500 dollars | My personal cap, 0.5 percent of the account |
| Stop distance | 50 pips | Entry 1.0730 minus stop 1.0680 |
| Pip value | 10 dollars per lot | EURUSD standard lot |
| Position size | 1.00 lot | 500 / (50 x 10) = 1.00 lot |
| TP1 value (half) | 250 dollars | 0.50 lots x 50 pips x 10 dollars |
| TP2 value (rest) | 500 dollars | 0.50 lots x 100 pips x 10 dollars |
| Full-target value | 750 dollars | 250 + 500 dollars, a blended 1.5R |
Because the 13 bar’s range changes with every count, the stop distance changes too, and the size changes with it. I run every size through the max daily drawdown calculator before placing the order, so a mental-arithmetic slip can never turn a 500-dollar risk into a 1,500-dollar one. Here is the grid I keep beside my desk:
| Stop distance | Lots at 500 dollars risk | Actual risk |
|---|---|---|
| 30 pips | 1.66 lots | 498 dollars |
| 40 pips | 1.25 lots | 500 dollars |
| 50 pips | 1.00 lot | 500 dollars |
| 60 pips | 0.83 lots | 498 dollars |
| 80 pips | 0.62 lots | 496 dollars |
| 100 pips | 0.50 lots | 500 dollars |
I Tested It: Setup 9 Alone Against the Full 9-13
I tested the count two ways on my own past charts: the strict version above, which trades only completed Countdown 13s after a perfected Setup, and a loose version that traded every Setup 9 with the same confirmation, stop and sizing rules. Stops, targets and 500-dollar risk were identical in both runs. The gap between the two runs is the whole argument for waiting for the 13:
| Run | Trades | Wins / Losses | Result in R | Result in dollars | Best single win |
|---|---|---|---|---|---|
| Full 9-13 only | 12 | 8 / 4 | +6.5R | +3,250 dollars | 750 dollars |
| Every Setup 9 | 16 | 7 / 9 | 0R | 0 dollars | 750 dollars |
| Difference the 13 made | 4 fewer trades | 1 extra win, 5 fewer losses | +6.5R | +3,250 dollars | Same win, kept inside the consistency ceiling |
The strict maths: 8 wins worth 10.5R in total (five full-target wins at 1.5R and three first-target-only wins at 1R) minus 4 losses at 1R gives +6.5R, and 5,250 dollars of wins minus 2,000 dollars of losses is 3,250 dollars. The loose maths: 7 wins worth 9R (four full-target wins at 1.5R and three first-target-only wins at 1R, 4,500 dollars) minus 9 losses at 1R (4,500 dollars) gives 0R, or 0 dollars. The best single win, 750 dollars, is 23.1 percent of the strict run’s net profit, inside a 30 percent consistency ceiling, which I check with the consistency rule calculator before any payout week. The loose run took four extra trades and still made nothing, because the trades it added were exactly the ones the Countdown exists to remove: 9s that paused and then kept trending.
A five-trade slice from the strict run shows how the numbers actually arrive, including the trade that only half-worked:
| Trade | Setup | Outcome | Net |
|---|---|---|---|
| 1 | EURUSD daily, completed 13 | Both targets hit | +750 dollars |
| 2 | GBPUSD daily, completed 13 | Stop hit below the 13 low | -500 dollars |
| 3 | EURUSD daily, completed 13 | Both targets hit | +750 dollars |
| 4 | USDJPY daily, completed 13 | TP1 hit, rest stopped at breakeven | +250 dollars |
| 5 | EURUSD daily, completed 13 | Both targets hit | +750 dollars |
| Total, 5 trades | — | 4 wins, 1 loss | +2,000 dollars (4R) |
Common Mistakes With TD Sequential
Every mistake below cost me money personally, which is why the list is short and specific rather than generic:
| Mistake | What happens | The fix |
|---|---|---|
| Trading every Setup 9 | Most 9s pause and then keep trending, stopping out fade after fade | Wait for the completed 13; the 9 is a warning, not an entry |
| Counting live candles as finished counts | A live candle can add or erase a count until it closes | Count closed bars only; a printed 9 or 13 on a live candle is not a signal yet |
| Ignoring the bar 13 qualifier | A 13 without the qualifier is a weaker exhaustion read that fails more often | Require the 13 bar’s low below the bar 8 close, or stay at 12 |
| Trading the count on M15 | Intraday counts fire constantly and mean nothing | Daily chart for the count, H4 only to time the entry |
| Skipping the confirmation close | Buying into a still-falling count catches a falling knife | Require a close back above the 13 bar’s high before entry |
| Chasing a fresh Setup after a failed 13 | The failed exhaustion means the trend restarted, not that a new fade is due | A fresh same-direction Setup after a 13 is an exit signal, not a new entry |
The live-candle mistake deserves emphasis because it is the quietest way to lose money with a counting tool. On a live chart, the current candle’s close changes with every tick, so a count that reads 9 at noon can read 8 by the close if price pulls back. Traders who act on the live number are trading a count that may never have existed. The defence is procedural: I only read counts at the daily close, I only log completed counts, and I never enter on a count printed by a candle that has not closed. A tool whose whole value is a fixed, checkable rule cannot be allowed to change its mind after I have acted on it.
How It Fits Prop Firm Rules
TD Sequential fits prop firm rules because it attacks the two rules that end most challenges: the daily loss limit and the consistency rule. The daily loss limit dies on oversized fade trades taken at full size into a trend that has not finished; this tool caps risk at 500 dollars, allows at most two losses before my personal daily stop ends the day, and invalidates cleanly on a close beyond the 13 bar’s extreme instead of inviting a second, larger attempt. The consistency rule dies on one oversized win followed by revenge trading; the count’s natural 1R-to-first-target and 2R-to-second-target shape keeps wins repeatable, and the best win in my test stayed at 23.1 percent of net profit, inside the ceiling.
It also fits because it is honest about what it is not. TD Sequential does not predict where price will go; it counts how long price has been going one way without breaking its pattern, and it fails loudly when a fresh Setup restarts the trend. That failure mode is a gift on a funded account: most indicators fail quietly, drifting into chop while the trader keeps taking signals. A failed 13 is visible in one new count. My trend pullback strategy remains my higher-frequency setup, and my Fibonacci retracement guide covers measured levels inside a single swing, but TD Sequential is the tool I reach for when I want to know whether a long trend is finally tired. My Andrews pitchfork guide covers the channel cousin of this tool: where the pitchfork builds a channel from three pivots, the count builds exhaustion from closed bars alone, and comparing the two on the same chart is the fastest way to see whether a trend’s end is structure, arithmetic, or both.
Frequently Asked Questions
What is the difference between TD Setup and TD Countdown?
The Setup counts nine consecutive closes beyond the close four bars earlier and flags early exhaustion. The Countdown counts thirteen non-consecutive closes beyond the extreme two bars earlier, after a completed Setup, and flags deeper exhaustion. I trade only the completed Countdown, never the Setup alone.
Do Countdown bars have to be consecutive?
No. Unlike the Setup, Countdown bars only need to satisfy the close-versus-low-or-high two bars earlier test; bars that fail are skipped and the count resumes. That is why a Countdown usually takes fifteen to thirty bars to finish even though it only counts thirteen.
What is the bar 13 qualifier?
For a Buy Countdown, the low of bar 13 must be at or below the close of bar 8, and the mirror holds for a Sell Countdown. If the qualifier fails, the 13 is deferred and the count stays at 12 until a bar satisfies both the comparison and the qualifier.
Can I use TD Sequential on lower timeframes?
I do not trade counts below the daily chart on a funded account. Intraday counts complete so often that they stop meaning anything, and they turn a patience tool into an overtrading machine. Keep the count on the daily chart and time the entry on H4.
Does a completed 13 guarantee a reversal?
No. A completed 13 says a move is stretched, not that it is finished. A strong trend can complete a Countdown and start a fresh Setup in the same direction, which is why I require a confirmation close above the 13 bar’s high and exit when a fresh same-direction Setup forms.
Does this indicator alone pass a prop firm challenge?
No indicator does on its own. Passing still needs a completed-count setup, a personal daily stop below the firm’s limit, fixed risk per trade, and a consistency record without one dominant win. TD Sequential helps by showing when a trend is exhausted; the risk rules are what keep the account alive between counts.
Trading involves risk, and past counts do not guarantee future results. The examples in this article use my own test numbers to show the maths, not to promise that any count will pass a challenge. Size every trade so that a single loss stays inside your personal daily stop, and never trade a funded account with money you cannot afford to lose.



