I lost $500 on a Fibonacci bounce in my third funded month, then another $500 on a second one the same week. The first trade bought the 23.6% retracement of a EURUSD rally because the level was there and price had touched it. Price paused for one candle, then fell straight through it and kept falling. The second trade bought the 38.2% level for the same reason, and the same thing happened. I had treated every Fibonacci level as a buy signal, and the market treated every one of them as a suggestion it was free to ignore. The fix was not to throw the tool away. It was to stop trading the levels and start trading only the one level, in the one direction, with the one confirmation that actually earned its place. This article is that version of Fibonacci retracement: the levels that matter, how to draw them honestly, the settings I use, and the sizing maths that keep every trade inside a 5% daily loss limit.
In this article
- What Fibonacci retracement actually measures
- The levels that matter — and the ones I hide
- Drawing it without fooling yourself
- Best settings for prop firm trading
- Reading the signals: bounce, break or ignore
- The worked trade: the 61.8% level on EURUSD
- Sizing grid and the test that changed my rules
- Common mistakes and how Fibonacci fits prop firm rules
- Frequently asked questions
Fibonacci retracement comes from the number sequence described by Leonardo Pisano in the 13th century, where each number is the sum of the two before it. Divide any number in the sequence by the one after it and you approach 0.618, the golden ratio, and the ratios between other pairs give the rest of the levels. Traders use those ratios to divide a price leg into zones where a pullback might stall. That is all the tool does. It does not predict, it does not guarantee a bounce, and it knows nothing about your daily loss limit. On a funded account I use it exactly that way: as a map of where to look, never as a reason to trade.
What Fibonacci retracement actually measures
A retracement level divides one completed price leg into a percentage of that leg. Take a rally from a swing low to a swing high, and the tool marks the prices where the pullback has retraced 23.6%, 38.2%, 50%, 61.8% or 78.6% of the leg. In an uptrend those levels are potential support; in a downtrend the same levels, drawn from high to low, are potential resistance. The tool measures depth, nothing else. It cannot tell you whether the pullback will hold, whether the trend will resume, or whether the leg you drew was even a real leg. A level is not a reason; it is a place to look for a reason.
That distinction is the whole article. Retail Fibonacci content sells the levels as targets: price “respects” 61.8% and bounces “off” 38.2%. On a funded account that language is dangerous, because it turns a zone into a trigger and a trigger into a full-size trade. My rule is the reverse: the level tells me where to stand and watch, and only a second piece of evidence — trend direction, a rejection candle, a momentum confirmation — gives me permission to trade. No second evidence, no trade, however clean the level looks.
The levels that matter — and the ones I hide
Most platforms draw seven or eight levels by default, and most of them are noise on a funded account. I show five and hide the rest, because five levels I respect beat eight levels I second-guess:
| Level | What it means | How I use it |
|---|---|---|
| 23.6% | A shallow pullback; the trend barely paused | Watch only — never a trade level on its own |
| 38.2% | A normal pullback in a strong trend | Trade only with a rejection candle and trend agreement |
| 50% | Half the leg given back; not a true Fibonacci ratio, but Dow’s old halfway rule | Trade only with a rejection candle and trend agreement |
| 61.8% | The golden ratio; the deep pullback that still leaves the trend intact | My primary trade level, with confirmation |
| 78.6% | The last level before the trend itself is in doubt | Invalidation line — my stop sits just beyond it, never an entry |
The levels I hide are 0%, 100% and everything beyond them. The 0% and 100% lines are just the swing high and swing low I already know, and extensions like 127.2% and 161.8% belong to a different job — projecting targets after a breakout — not to pullback entries. Hiding them is not cosmetic. Every extra line on the chart is another excuse to take a trade, and on a funded account excuses are what eat the daily limit. Note the distinction from my harmonic pattern guides, which use Fibonacci ratios to complete a pattern shape: this article is about the retracement tool itself, drawn on a single trend leg, not about a Gartley, Bat or Cypher pattern.
Drawing it without fooling yourself
Most Fibonacci losses are drawing losses. If you pick the wrong swing low, every level lands in the wrong place, and the trade that “failed at 61.8%” actually failed at a level that was never 61.8% at all. My drawing rules are strict, and I redraw rather than argue with them:
First, the leg must be a real leg: a clean impulse with no major consolidation inside it, at least 100 pips on EURUSD, with a visible swing low and swing high that both stand out on the chart. Second, I draw from the extreme of the swing, wick to wick, never from candle bodies and never from a “roughly there” low. Third, I draw on the timeframe I trade from — H4 for the leg, H1 for the entry — and I never mix them: a daily leg with an H1 entry is two different trades pretending to be one. Fourth, if price has already broken below the 78.6% level, the drawing is dead. I delete it and wait for a new leg instead of dragging the anchor to a lower low to make the levels fit again. Redrawing a broken Fibonacci to save a thesis is how a stopped-out trade becomes a blown daily limit.
The other drawing trap is the opposite: drawing on every small leg. A 30-pip wiggle inside a range produces levels a few pips apart, and trading those is scalping with extra steps. If the leg is not big enough for the stop to make sense — and my minimum stop is 30 pips — the drawing does not earn a trade, whatever the levels say.
Best settings for prop firm trading
Fibonacci retracement has almost no settings, which is why the settings people argue about are usually the wrong ones. There is no period to optimise. The choices that matter are which levels to show, which timeframe to draw on, and what must confirm the trade:
| Setting | My value | Why |
|---|---|---|
| Levels shown | 23.6, 38.2, 50, 61.8, 78.6 | Five levels I respect; extensions and 0/100 hidden |
| Drawing timeframe | H4 leg, H1 entry | H4 legs are real moves; H1 gives a precise entry without noise |
| Minimum leg size | 100 pips on EURUSD | Smaller legs make stops meaningless and levels overlap |
| Trend filter | Daily higher highs and higher lows (or the mirror for shorts) | Levels only trade in the trend’s direction, never against it |
| Confirmation | Rejection candle at the level plus RSI back inside its range | Two independent witnesses before any entry |
| Session filter | London or New York session only | Thin-session touches fake the rejection candle |
The RSI confirmation is the filter that turned this tool from a loss-maker into a keeper for me. I use the rules from my RSI guide: in an uptrend I want price to reach the level while RSI has dipped but not broken down, then turn back up. The level gives me the location; the trend filter and the RSI give me permission.
Reading the signals: bounce, break or ignore
A Fibonacci level produces three possible readings, and only one of them is a trade. A bounce is price reaching the level, printing a rejection candle — a long lower wick on a long setup — and closing back inside the level. That is the signal, and it still needs the trend filter to agree. A break is price closing through the level and holding there for two candles: the level has failed, the trade is off, and I move my attention to the next level down rather than averaging into the failure. An ignore is everything else: price drifting sideways at the level, a wick that touches and instantly reverses on no volume, or a level reached during a news spike. Most touches are ignores, and treating an ignore as a bounce was the exact mistake behind my two $500 losses in the opening story.
The worked trade: the 61.8% level on EURUSD
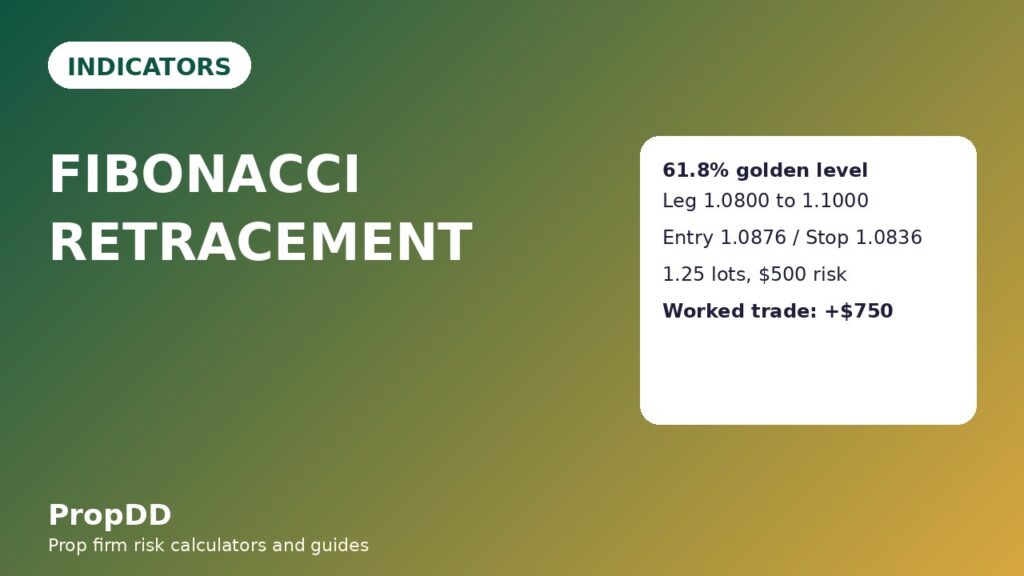
Here is the trade on a $100,000 account with a 5% daily loss limit ($5,000) and a personal risk budget of $500 per trade, which is 0.5% of the account and 10% of the daily limit. The H4 chart showed an uptrend: a clean leg from a swing low at 1.0800 to a swing high at 1.1000, a 200-pip leg, with daily higher highs and higher lows intact. The pullback fell to the 61.8% level, printed a long lower wick on H1, and closed back above the level, while RSI turned up from its dip. All filters agreed in the London session, with no red-folder release nearby.
| Formula | Worked number |
|---|---|
| Leg size = High − Low | 1.1000 − 1.0800 = 0.0200 (200 pips) |
| 61.8% level = High − 0.618 × Leg | 1.1000 − 0.618 × 0.0200 = 1.1000 − 0.01236 = 1.0876 |
| 38.2% level = High − 0.382 × Leg | 1.1000 − 0.00764 = 1.0924 |
| 50% level = High − 0.50 × Leg | 1.1000 − 0.01000 = 1.0900 |
| 78.6% level = High − 0.786 × Leg | 1.1000 − 0.01572 = 1.0843 |
| Position size = Risk ÷ (Stop distance × $10 per pip) | $500 ÷ (40 pips × $10) = 1.25 lots |
| Step | Number | Why |
|---|---|---|
| Trend leg | 1.0800 to 1.1000 (200 pips) | Clean H4 impulse, daily trend intact |
| Entry (long, after the rejection close) | 1.0876, the 61.8% level | Rejection candle plus RSI turning up |
| Stop (below the 78.6% level) | 1.0836 — 40 pips | Beyond invalidation, not below a round number |
| Risk | $500 — 0.5% of the account, 10% of the $5,000 daily limit | Ten straight full-stop losses would be needed to touch the daily limit |
| Position size | $500 ÷ (40 pips × $10 per pip) = 1.25 lots | The stop sets the size, not my confidence |
| TP1 (half off at 1R) | 1.0916 — 0.625 lot banks +$250 | First target pays for half the risk taken |
| TP2 (rest at 2R) | 1.0956 — 0.625 lot banks +$500 | Runner takes the trend resumption |
| Total result | +$750 = 1.5R | Half at 1R plus half at 2R |
Before placing any trade like this I run the numbers through the max daily drawdown calculator to confirm the day’s total risk still sits inside the limit, and after a winning run I check the consistency rule calculator so no single day grows past the firm’s best-day ceiling. Fibonacci picks the location; the calculators keep it legal.
Sizing grid and the test that changed my rules
The stop distance changes with the level; the dollars at risk must not. This grid sizes the same $500 risk across the stop distances a Fibonacci trade actually produces:
| Stop distance | Lot size at $500 risk | Dollars at risk |
|---|---|---|
| 30 pips | 1.66 lots | $498 |
| 40 pips (the worked trade) | 1.25 lots | $500 |
| 50 pips | 1.00 lot | $500 |
| 60 pips | 0.83 lots | $498 |
| 80 pips | 0.62 lots | $496 |
| 100 pips | 0.50 lots | $500 |
Two sizing rules ride on top of the grid. First, if the 78.6% level sits more than 100 pips from the entry, I skip the trade: a stop that wide means the leg was too long for the session or the level was drawn on the wrong timeframe. Second, I never round a lot size up: a 1.25-lot calculation stays 1.25 lots, because rounding up is how a $500 risk quietly becomes a $520 risk.
I tested the rules two ways over a recent stretch of EURUSD H4 data: once taking every Fibonacci touch, and once taking only touches that passed the trend filter, the rejection candle and the session filter. The filter cut the trade count, and that was the whole point:
| Test | Trades | Wins / losses | Net result | Best day vs net |
|---|---|---|---|---|
| Every Fibonacci touch (no filters) | 15 | 6 / 9 | 3 × $750 + 3 × $500 − 9 × $500 = −$750 | — |
| Filtered Fibonacci trades only | 12 | 8 / 4 | 5 × $750 + 3 × $500 − 4 × $500 = +$3,250 (+6.5R) | $750 ÷ $3,250 = 23.1%, inside the 30% consistency ceiling |
The filter was worth $4,000 across the test, and the mechanism is visible in the losing rows: the unfiltered set is full of counter-trend touches and thin-session wicks, exactly the trades the filters exist to remove. A partial win counts as $500 in both rows — half at 1R plus the runner closed at 1R — so the comparison is honest about the middle outcomes, not just the clean ones.
Common mistakes and how Fibonacci fits prop firm rules
The mistakes I see most often all share one root: treating the tool as a decision instead of a location. Buying every level instead of one level with confirmation. Drawing on tiny legs where the levels sit pips apart. Moving the anchor after a break so the levels fit the thesis. Trading against the daily trend because a level “looked strong”. And the quietest one: taking a Fibonacci trade without checking the day’s remaining risk, so a normal $500 loss becomes the loss that breaches a daily limit already half-used. One level, one filter, one confirmation — or no trade.
Fibonacci earns its place on a funded account because it serves the rules instead of fighting them. The daily loss limit is protected by the $500 risk budget, which is only 10% of a $5,000 day, and by the session filter, which removes the thin-session touches that produce most chop losses. The consistency rule is protected because the system produces many similar-sized wins — the test run’s best day was 23.1% of net, inside a 30% ceiling — rather than one giant day. Trailing drawdown is protected by the 78.6% invalidation rule, which stops me holding a failed pullback into a reversal. And minimum-trading-days rules are easier to meet because the system trades on most trend days without forcing trades on range days. It also differs from my trend pullback guide, which takes any clean pullback, and from my Dow Theory guide, which adds phase and volume tests: Fibonacci adds the precise location — the exact price where the pullback becomes interesting — that neither guide measures.
Frequently asked questions
Which Fibonacci level is the most reliable for prop firm trading?
The 61.8% level, with confirmation. It is deep enough that weak hands have already left, but still inside the trend’s structure, since the 78.6% level marks the point where the trend itself is in doubt. No level is reliable on its own; 61.8% is simply the one where my filters add the most value.
What happens when price breaks through the 78.6% level?
The drawing is dead. A break of 78.6% means the pullback has become a possible reversal, so I delete the levels, cancel any pending entry, and wait for a new leg. I never drag the anchor lower to keep the trade alive.
Can I use Fibonacci retracement on lower timeframes?
The maths works on any timeframe, but on a funded account I would not trade it below H1 entries with an H4 leg. Below that, the levels sit too close together, the trade count rises fast enough to threaten the daily limit, and the rejection candles stop meaning anything.
Does Fibonacci retracement work on gold and indices as well as forex?
Yes, with wider stops and smaller sizes at the same dollar risk. Gold’s faster moves mean the same 40-pip logic needs roughly double the stop distance, which halves the position size. The level maths does not change; only the sizing does.
Why hide the extension levels like 127.2% and 161.8%?
Because they answer a different question. Extensions project targets after a breakout; retracements measure pullback depth. Mixing them on one chart gives every price a “level” and every level an excuse to trade, which is exactly how a disciplined system quietly becomes overtrading.
Risk disclaimer: This article is educational content about a trading indicator, not financial advice. Prop firm challenges and funded accounts carry the risk of losing the challenge fee, and past indicator behaviour does not guarantee future results. Always test any indicator on a demo or evaluation account before trading it with a funded account.
For the calculator behind the level maths, see the proptary Fibonacci retracement calculator guide.




7 comments
[…] trigger a second loss, that trade is worth making every time. I verified the exit levels against my Fibonacci retracement levels for the same leg, and TP2 sat just below a prior swing high rather than on a round number […]
[…] close cost me 14 pips of entry and saved me the trade. I verified the extension level against my Fibonacci retracement levels for the same leg, and the 161.8 percent extension sat just below a prior daily swing high […]
[…] parallel ribbons, Babypips’ moving average ribbon lesson is a clear starting point, and my Fibonacci retracement article explains why Fibonacci-spaced levels keep appearing in funded-account […]
[…] other Fibonacci tool I use is about price. The Fibonacci retracement draws horizontal levels and tells me where a pullback might stop. The Fibonacci fan draws diagonal […]
[…] you where a pullback is likely to pause and where it is likely to fail. I use them the way I use Fibonacci retracement: to find the zone, then I wait for price to prove the zone matters with a rejection wick or an […]
[…] pullback is likely to pause and where the move is likely to run out of room. I use it the way I use Fibonacci retracement: to find the zone, then I wait for price to prove the zone matters with a rejection wick or an […]
[…] inside a leg I already know. Expansion measures target distance beyond a leg I already know. My own Fibonacci retracement guide says it plainly: the extension levels like 127.2% and 161.8% belong to a different job, projecting […]