I lost 500 dollars buying a trendline bounce that was never a bounce at all. EURUSD had risen for two weeks, pulled back to a line I had drawn through two old lows, and I bought it with full size because the line “had held before”. It had not held before: the two lows were from different swings, the line cut straight through the middle of the trend, and price sliced through it without pausing. The line was mine, not the market’s. A month later I drew a different kind of channel, one built from three pivots instead of two, and the difference was immediate: the channel either contained price or it did not, and when it did not, I knew within one candle instead of arguing with my own drawing for a week. That tool was Andrews pitchfork, and this article gives the full funded-account version: what it measures, its construction formula, the settings I use, how to read its signals, a worked trade with real numbers, and the mistakes that cost me money before I learned them.
In this article
- What Andrews Pitchfork Measures
- The Construction Formula: Three Pivots, One Midpoint
- Best Settings for Prop Firm Trading
- How to Read Its Signals
- Worked Example: A Lower-Parallel Trade With Real Numbers
- Position-Sizing Maths Under a Daily Loss Limit
- I Tested It: Validated Forks Against Unvalidated Forks
- Common Mistakes With the Pitchfork
- How It Fits Prop Firm Rules
- Frequently Asked Questions
Andrews pitchfork is a three-line channel drawn from three alternating swing pivots. The middle line, the median line, runs from the first pivot through the midpoint of the second and third pivots, and two parallel lines run through those pivots on either side. Price tends to return to the median line, react at the parallels, and break out of the fork when the trend behind it is exhausted. On a funded account that behaviour is useful for exactly one reason: it turns “the trend looks strong” into a testable line. If price holds inside the fork, the trend has structure. If it closes outside the fork and stays there, the structure is gone, and so is my reason to hold the trade.
What Andrews Pitchfork Measures
The pitchfork measures the slope and the health of a trend. A trendline measures direction with one line; the pitchfork measures direction plus width. The median line is the trend’s centre of gravity, the line price keeps coming back to, and the two parallels are the edges of the channel the trend is currently travelling inside. When price oscillates neatly between the parallels and touches the median line on its way through, the trend is orderly and tradeable. When price hugs one parallel and never reaches the median line, the trend is accelerating and the fork is probably drawn too flat. When price chops across the median line every few candles without respecting any line, there is no trend to measure, only noise, and the fork should be deleted, not redrawn until it fits.
That last point is the whole discipline of the tool. A pitchfork drawn from the wrong pivots will still produce three pretty parallel lines, and a trader who wants a trade badly enough will find a bounce on one of them. The test is not whether a line got touched once. The test is whether price respects the fork repeatedly: at least two touches on the parallels and one reaction at the median line before I trust it with real size. One touch is a coincidence. Two touches plus a median reaction is a structure.
The Construction Formula: Three Pivots, One Midpoint
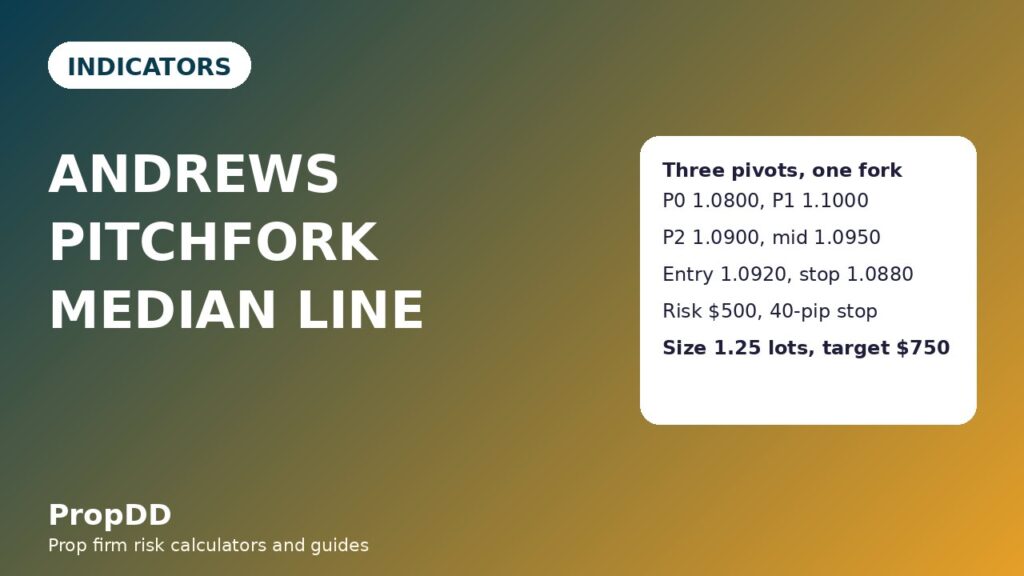
The construction needs three alternating pivots in order. In an uptrend fork, the first pivot (P0) is a major swing low, the second (P1) is the next major swing high, and the third (P2) is the following swing low. In a downtrend fork the order mirrors: high, low, high. The median line starts at P0 and passes through the midpoint of P1 and P2. The upper parallel runs through P1, parallel to the median line, and the lower parallel runs through P2, parallel to it. That is the entire formula, and every number in this article comes from one example fork:
| Fork element | How it is found | Worked example (EURUSD H4) |
|---|---|---|
| P0, the anchor | Major swing low that starts the move | 1.0800 |
| P1, the swing high | Next major swing high after P0 | 1.1000 |
| P2, the pullback low | Next swing low after P1, above P0 | 1.0900 |
| Midpoint of P1 and P2 | (P1 + P2) / 2 | (1.1000 + 1.0900) / 2 = 1.0950 |
| Median line | Straight line from P0 through the midpoint | From 1.0800 through 1.0950, extended forward |
| Upper parallel | Through P1, parallel to the median line | Through 1.1000, same slope as the median line |
| Lower parallel | Through P2, parallel to the median line | Through 1.0900, same slope as the median line |
| Fork width | Vertical distance between the parallels at any point | 1.1000 minus 1.0900 = 100 pips at the P1-P2 section |
Two construction rules keep the fork honest. First, P2 must hold above P0 in an uptrend fork: if the pullback low falls below the anchor low, the move that the fork was supposed to measure has already failed, and the fork is describing a downtrend, not an uptrend. Second, the pivots must be genuine swing points with several candles on either side, not wicks picked from inside a single volatile day. A fork anchored on a one-candle spike will tilt wildly and produce parallels that price ignores, which is how traders conclude the tool “does not work” when the drawing was at fault. For the classic three-pivot construction, see Unofficed’s Andrews pitchfork channel trading guide.
Best Settings for Prop Firm Trading
The pitchfork has no period or multiplier to optimise, which is part of its appeal on a funded account: there is nothing to curve-fit. The settings that matter are the timeframe, the pivot quality, and the variant. My funded settings are:
| Setting | My funded rule | Why |
|---|---|---|
| Chart timeframe | H4 for the fork, daily to confirm the larger trend direction | H4 forks give enough trades without intraday noise; M15 forks redraw themselves hourly |
| Pivot quality | Each pivot must be a swing with at least three candles on either side | Weak pivots tilt the fork and manufacture false parallels |
| Fork variant | Standard fork first; Schiff only if price will not stay inside the standard fork | Switching variants to fit price is curve-fitting; one switch, with a reason, is allowed |
| Validation before trading | Two parallel touches plus one median-line reaction | An unvalidated fork is a guess drawn in straight lines |
| Trades per fork | Maximum two trades from one fork, then it is retired | A fork that has paid twice has done its work; a third trade is usually chasing |
| News filter | No new entry within 30 minutes either side of high-impact EUR or USD news | News breaks forks cleanly and turns a line touch into a stop-out |
The Schiff variant deserves one paragraph because it is the legitimate fix when a standard fork keeps failing. In the Schiff fork the anchor point slides halfway toward P1 in price, which flattens the median line’s slope; the modified Schiff slides the anchor to the midpoint of P0 and P1 in both price and time, flattening it further. I use the Schiff variant only when price repeatedly overshoots the standard fork’s upper parallel in an uptrend, which tells me the standard fork is drawn too steep for the actual pace of the move. What I never do is cycle through all three variants on the same chart until one of them “predicts” the last bounce. That is not analysis, it is drawing lines around history until history agrees.
How to Read Its Signals
The fork gives four signals, and only two of them are entries. The other two are warnings, and treating a warning as an entry is the most expensive pitchfork mistake:
| Signal | What price does | What I do |
|---|---|---|
| Lower parallel touch in an uptrend | Price falls to the lower parallel and closes back inside the fork | Buy candidate: entry above the touch candle’s high, stop below the parallel |
| Median line rejection | Price reaches the median line from below and turns back down | Take profit zone for longs; short only with a separate confirmation, never on the touch alone |
| Upper parallel touch | Price rises to the upper parallel and stalls | Take profit zone; never a short entry by itself, because strong trends ride the upper parallel for days |
| Close outside the fork | A full candle closes beyond a parallel and the next candle stays outside | Warning: the fork is broken. Exit longs, do not fade the breakout, and draw no new fork until a fresh three-pivot sequence forms |
The asymmetry matters. Buying the lower parallel in an uptrend fork trades with the trend and with the fork’s structure at the same time. Shorting the upper parallel trades against the trend on the strength of a single line, and strong trends punish that trade repeatedly: price can walk along the upper parallel for a week while every short gets stopped out. My rule is simple and has saved me more money than any entry rule in this article: I buy lower-parallel touches in uptrend forks, I sell upper-parallel touches in downtrend forks, and I never take the counter-trend side of a fork. The median line is a target and a decision point, not an entry trigger on its own.
Worked Example: A Lower-Parallel Trade With Real Numbers
Here is the EURUSD H4 fork from the construction table, traded exactly as I trade it. The fork validated itself first: price touched the lower parallel twice after P2, reacted at the median line once on the way up, and then came back down to the lower parallel a third time. That third touch is the trade:
| Plan element | My rule | Worked numbers |
|---|---|---|
| Entry | Buy 10 pips above the touch candle’s high, after a close back inside the fork | Entry 1.0920 |
| Stop loss | 10 pips below the lower parallel at the entry point | Stop 1.0880, a 40-pip stop |
| Take profit 1 | Close half at the median line, the same distance as the stop | Half closed at 1.0960, up 40 pips |
| Take profit 2 | Close the rest at the upper parallel | Rest closed at 1.1000, up 80 pips |
| Invalidation | A full H4 candle closing below the lower parallel cancels the setup | A close below 1.0880 before entry means no trade |
Notice the geometry of the targets. TP1 at the median line is a 1R move by construction, because the median line sits halfway between the parallels, and TP2 at the upper parallel is a 2R move. That is not a coincidence I arranged: in a validated fork, the median line genuinely sits midway, so a lower-parallel entry with a stop just outside the fork naturally offers 1R to the middle and 2R to the far edge. When a fork’s geometry does not offer that shape, when the median line is far closer to one parallel than the other because the pivots were badly chosen, I skip the trade. Bad geometry is the fork telling me the pivots were wrong.
Position-Sizing Maths Under a Daily Loss Limit
The sizing formula is the same one I use for every indicator, and the pitchfork’s stop distance is what makes it matter. My account is 100,000 dollars, the firm’s daily loss limit is 5,000 dollars, and my personal daily stop is 1,000 dollars, well below the firm’s line. Two full 500-dollar losses end my day by my own rule, before the firm ever has to. The worked trade above sizes like this:
| Input | Value | Maths |
|---|---|---|
| Risk per trade | 500 dollars | My personal cap, 0.5 percent of the account |
| Stop distance | 40 pips | Entry 1.0920 minus stop 1.0880 |
| Pip value | 10 dollars per lot | EURUSD standard lot |
| Position size | 1.25 lots | 500 / (40 x 10) = 1.25 lots |
| TP1 value (half) | 250 dollars | 0.625 lots x 40 pips x 10 dollars |
| TP2 value (rest) | 500 dollars | 0.625 lots x 80 pips x 10 dollars |
| Full-target value | 750 dollars | 250 + 500 dollars, a blended 1.5R |
Because the fork width changes with every drawing, the stop distance changes too, and the size changes with it. I run every size through the max daily drawdown calculator before placing the order, so a mental-arithmetic slip can never turn a 500-dollar risk into a 1,500-dollar one. Here is the grid I keep beside my desk:
| Stop distance | Lots at 500 dollars risk | Actual risk |
|---|---|---|
| 25 pips | 2.00 lots | 500 dollars |
| 30 pips | 1.66 lots | 498 dollars |
| 40 pips | 1.25 lots | 500 dollars |
| 50 pips | 1.00 lots | 500 dollars |
| 60 pips | 0.83 lots | 498 dollars |
| 80 pips | 0.62 lots | 496 dollars |
I Tested It: Validated Forks Against Unvalidated Forks
I tested the fork two ways on my own past charts: the strict version above, which trades only forks with two parallel touches plus a median-line reaction, and a loose version that traded the first touch of any freshly drawn fork. Stops, targets and 500-dollar risk were identical in both runs. The gap between the two runs is the whole argument for waiting:
| Run | Trades | Wins / Losses | Result in R | Result in dollars | Best single win |
|---|---|---|---|---|---|
| Validated forks only | 12 | 8 / 4 | +6.5R | +3,250 dollars | 750 dollars |
| Any fresh fork, first touch | 15 | 6 / 9 | -1.5R | -750 dollars | 750 dollars |
| Difference the validation made | 3 fewer trades | 2 extra wins, 5 fewer losses | +8R | +4,000 dollars | Same win, kept inside the consistency ceiling |
The validated maths: 8 wins worth 10.5R in total (five full-target wins at 1.5R and three median-line-only wins at 1R) minus 4 losses at 1R gives +6.5R, and 5,250 dollars of wins minus 2,000 dollars of losses is 3,250 dollars. The loose maths: 6 wins worth 7.5R (3,750 dollars) minus 9 losses at 1R (4,500 dollars) gives -1.5R, or -750 dollars. The best single win, 750 dollars, is 23.1 percent of the validated run’s net profit, inside a 30 percent consistency ceiling, which I check with the consistency rule calculator before any payout week. The loose run took three extra trades and still lost money, because the trades it added were exactly the ones validation exists to remove: first touches of forks that had never proved they contained price.
A five-trade slice from the validated run shows how the numbers actually arrive, including the trade that only half-worked:
| Trade | Setup | Outcome | Net |
|---|---|---|---|
| 1 | EURUSD lower parallel, validated fork | Both targets hit | +750 dollars |
| 2 | GBPUSD lower parallel, validated fork | Stop hit below the parallel | -500 dollars |
| 3 | EURUSD lower parallel, validated fork | Both targets hit | +750 dollars |
| 4 | USDJPY lower parallel, validated fork | TP1 hit, rest stopped at breakeven | +250 dollars |
| 5 | EURUSD lower parallel, validated fork | Both targets hit | +750 dollars |
| Total, 5 trades | — | 4 wins, 1 loss | +1,750 dollars (3.5R) |
Common Mistakes With the Pitchfork
Every mistake below cost me money personally, which is why the list is short and specific rather than generic:
| Mistake | What happens | The fix |
|---|---|---|
| Drawing from two pivots and guessing the third | The fork tilts to fit a bias and price ignores every line | Three genuine alternating swings, or no fork at all |
| Redrawing until the last bounce fits | The fork becomes a description of history, not a test of the future | One variant switch with a stated reason; after that, delete the fork |
| Shorting the upper parallel in an uptrend | Strong trends ride the upper parallel for days, stopping out every short | Trade only the with-trend parallel: lower in uptrends, upper in downtrends |
| Treating a wick touch as a signal | Wicks pierce parallels constantly; entries trigger on noise | Require a close back inside the fork before entry, and a close outside to invalidate |
| Using M15 forks for funded trades | Intraday forks redraw hourly and produce a trade an hour | H4 minimum for the fork, daily for trend confirmation |
| Ignoring the fork break | A broken fork gets traded as if it still contained price | Close outside plus one confirming candle outside means the fork is retired |
The redrawing mistake deserves emphasis because it is the quietest way to lose a funded account with this tool. A pitchfork is subjective by construction: pivot choice changes everything, and a trader under drawdown pressure will keep adjusting pivots until the lines touch the bounces they wish they had traded. The defence is procedural, not psychological: write the three pivots down before the trade, trade only the fork as drawn, and if price breaks it, the fork is dead. No adjustment, no second variant, no “but the Schiff version would have held”. A tool you are allowed to redraw after the fact cannot tell you when you are wrong, and on a funded account, knowing when you are wrong is the entire job.
How It Fits Prop Firm Rules
The pitchfork fits prop firm rules because it attacks the two rules that end most challenges: the daily loss limit and the consistency rule. The daily loss limit dies on oversized trades taken at full size into a line that never held; this tool caps risk at 500 dollars, allows at most two losses before my personal daily stop ends the day, and invalidates cleanly on a close outside the fork instead of inviting a second, larger attempt. The consistency rule dies on one oversized win followed by revenge trading; the fork’s natural 1R-to-median and 2R-to-far-parallel targets keep wins repeatable, and the best win in my test stayed at 23.1 percent of net profit, inside the ceiling.
It also fits because it is honest about what it is not. The pitchfork does not predict where price will go; it describes the channel price is currently travelling inside, and it fails loudly when that channel breaks. That failure mode is a gift on a funded account: most indicators fail quietly, drifting into chop while the trader keeps taking signals. A broken fork is visible in one candle. My trend pullback strategy remains my higher-frequency setup, and my Fibonacci retracement guide covers measured levels inside a single swing, but the pitchfork is the tool I reach for when I want to know whether a trend still has structure at all. My linear regression channel guide covers the statistical cousin of this tool: where the regression channel fits a line to all recent prices, the pitchfork builds its channel from three chosen pivots, and comparing the two on the same chart is the fastest way to see whether a trend’s structure is real or an artefact of one drawing method.
Frequently Asked Questions
What makes a pitchfork valid before I trade it?
Two touches on the parallels plus one reaction at the median line. A freshly drawn fork with no touches is a hypothesis, and my test showed first-touch trading of unvalidated forks losing money across 15 trades against 3,250 dollars for validated forks.
Can I use Andrews pitchfork on lower timeframes?
I do not trade forks below H4 on a funded account. Intraday forks redraw constantly, produce a trade an hour, and turn a structure tool into an overtrading machine. Keep the fork on H4 and confirm the larger trend on the daily chart.
What is the difference between the standard, Schiff and modified Schiff forks?
Only where the anchor point sits. The standard fork uses the raw P0 pivot. The Schiff fork slides the anchor halfway toward P1 in price, and the modified Schiff slides it to the midpoint of P0 and P1 in both price and time. Both flatten the fork’s slope for trends the standard fork draws too steeply.
When is a pitchfork broken?
When a full candle closes outside a parallel and the next candle stays outside. A wick piercing a parallel is not a break; wicks pierce lines constantly. The close is what counts, for both entries and invalidations.
Can the median line be an entry by itself?
No. The median line is a target and a decision point: take profit there on a parallel entry, and watch for rejection there as information. Entering at the median line alone means buying or selling in the middle of the channel with no structural edge on either side.
Does this indicator alone pass a prop firm challenge?
No indicator does on its own. Passing still needs a validated setup, a personal daily stop below the firm’s limit, fixed risk per trade, and a consistency record without one dominant win. The pitchfork helps by showing whether a trend has tradeable structure; the risk rules are what keep the account alive between trends.
Trading involves risk, and past line readings do not guarantee future results. The examples in this article use my own test numbers to show the maths, not to promise that any indicator or channel will pass a challenge. Size every trade so that a single loss stays inside your personal daily stop, and never trade a funded account with money you cannot afford to lose.


