I lost 640 dollars on a rising wedge before I knew what a rising wedge was. GBPUSD had printed three higher highs in a row, the trend looked healthy, and I bought the third high because higher highs meant buyers were in control. That is what the textbooks say about an uptrend, and it is exactly the wrong read inside a wedge. The highs were higher, yes, but each one was smaller than the last, the range was squeezing shut, and the buyers pushing price up were getting weaker with every push. Price broke down through the lower line the same afternoon, ran straight through my stop, and kept falling for two more days. The chart had been warning me for a week. I just did not know the shape of the warning.
In this article
- What a rising wedge actually is
- Rising wedge vs the patterns traders confuse it with
- The five rules that decide whether a wedge is tradeable
- The full strategy rules: setup, entry, stop loss, take profit, session filter
- Position-sizing maths under the daily loss limit
- A worked trade, with every number shown
- I tested it: twelve filtered trades against twelve unfiltered
- When the rising wedge fails
- How it fits prop firm rules
- Common mistakes with the rising wedge
- My daily routine with rising wedges
- Frequently asked questions
This guide covers the rising wedge strategy for a funded account. You will learn what the pattern is, how to tell it apart from the triangles traders confuse it with, the five rules that decide whether a wedge is tradeable, the full entry, stop loss and take profit rules, the position-sizing maths under a daily loss limit, a worked trade with every number shown, a twelve-trade test of filtered against unfiltered entries, when the pattern fails, and how it fits inside prop firm consistency and drawdown rules. Everything uses a 100,000-dollar funded account with a 5,000-dollar daily loss limit and a 500-dollar per-trade risk cap.
What a rising wedge actually is
A rising wedge is a bearish reversal pattern made of two trend lines that both slope upward and converge. Price makes higher highs and higher lows inside it, which is why it fools buyers: on the surface it looks like an uptrend. The tell is in the slope of the two lines. The lower line, the support line joining the higher lows, rises faster than the upper line, the resistance line joining the higher highs. Each new high gains less ground than the one before it, each new low gives back less, and the range between the lines narrows bar by bar. Buyers are still pushing price up, but every push is weaker. When the lower line finally breaks, the sellers who have been absorbing those pushes take over, and the move down is usually fast because the trapped buyers all head for the exit at once.
Two features confirm the shape. First, volume normally contracts as the wedge forms. Rising volume inside a rising wedge is a warning that you may be looking at something else, usually a strong trend with a steep channel rather than an exhausting one. Second, the pattern needs time to form. On H1, I want at least twenty bars between the first touch and the breakdown; on H4 and daily, two to four weeks is normal. A five-bar squeeze is not a wedge, it is noise, and trading noise with a funded account’s drawdown rules is how accounts get breached on ordinary Tuesdays. The textbook anatomy matches what I use here, and the MyFundedCapital rising wedge guide lays out the same structure with its own examples.
Rising wedge vs the patterns traders confuse it with
Three patterns get mixed up with the rising wedge, and each mix-up costs money because the trade direction is different. The ascending triangle has a flat top and rising lows, and it usually breaks upward. The falling wedge slopes downward on both lines and usually breaks upward. The symmetrical triangle has one line sloping down and one sloping up, and it can break either way. The rising wedge is the only one of the four where both lines slope up and the expected break is down. If you cannot say which of the four you are looking at, you do not have a trade yet.
| Pattern | Upper line | Lower line | Usual break | Trade direction |
|---|---|---|---|---|
| Rising wedge | Slopes up, gentle | Slopes up, steeper | Down through support | Short |
| Ascending triangle | Flat | Slopes up | Up through resistance | Long |
| Falling wedge | Slopes down, steeper | Slopes down, gentle | Up through resistance | Long |
| Symmetrical triangle | Slopes down | Slopes up | Either way | Wait for the break |
I have written full guides to the other three patterns on this site, and reading them side by side with this one is the fastest way to stop confusing them: the ascending triangle strategy, the falling wedge strategy, and the symmetrical triangle strategy. The single test that separates a rising wedge from an ascending triangle is the top line. If the highs are flat, it is a triangle and the bias is long. If the highs are rising but each one gains less than the last while the lows climb faster, it is a wedge and the bias is short.
The five rules that decide whether a wedge is tradeable
Not every rising wedge is worth trading. I run every candidate through five rules, and a wedge that fails any one of them is a chart to watch, not a trade to take. Rule one: there must be a clear prior uptrend. A wedge that forms after a sideways drift has no trend to reverse, and its breakdown is as likely to be noise as signal. Rule two: at least two touches on each line, three preferred. Two touches draw the lines, three touches prove them. Rule three: the lines must converge. If the channel stays parallel, it is a rising channel, and rising channels continue upward far more often than they reverse. Rule four: volume contracts as the wedge tightens. Expanding volume inside the wedge means buyers are still strong, and the breakdown odds fall. Rule five: the breakdown must close below the support line. A wick that pokes below and closes back inside is not a breakdown, it is a liquidity sweep, and shorting it is how you get trapped on the wrong side of the reversal you were waiting for.
A wedge that fails any one of these five rules is not a trade. That sentence has saved me more money than any entry technique in this guide, because most rising wedge losses I have seen come from trading wedges that were never valid in the first place.
The full strategy rules: setup, entry, stop loss, take profit, session filter
Setup: H1 or H4, GBPUSD or EURUSD, a rising wedge that passes all five rules, formed after a visible uptrend, with the pattern at least twenty bars old on H1. Entry, method one, the breakdown close: short at the open of the candle after a candle closes below the support line. Entry, method two, the retest, which is the one I use on a funded account: wait for price to pull back up to the broken support line and short the rejection candle there, with the stop above the last swing high inside the wedge. The retest entry gives a tighter stop and a better risk-to-reward ratio, at the cost of missing the roughly one in three breakdowns that never look back. On a funded account, the tighter stop is worth the missed trades, because a tighter stop means a larger position inside the same 500-dollar risk cap.
Stop loss: above the last swing high inside the wedge, plus a 5-pip buffer for spread and wick noise. Never above the wedge’s highest high by default; the last swing high is closer, it keeps the stop honest, and if price takes it out, the wedge thesis is dead anyway. Take profit: TP1 at 1R, take half off. TP2 at the measured move, the full height of the wedge at its widest point, projected downward from the breakdown point, take the rest off. If price stalls halfway to TP2 and prints a strong bullish engulfing candle on H1, I take the rest off early rather than give back an open profit into a trailing drawdown limit. Session filter: trade the breakdown only during London hours or the London-New York overlap, 08:00 to 17:00 London time. A breakdown printed in the thin Asian session has no volume behind it and reverses more often than it runs. News filter: no entries within thirty minutes either side of a red-folder release on the traded pair.
Position-sizing maths under the daily loss limit
The sizing formula is the same one I use for every strategy on this site, and it is the only formula that matters on a funded account: lots equal risk divided by stop distance in pips times pip value. With a 500-dollar risk cap, a 60-pip stop on GBPUSD at 10 dollars per pip per lot, the maths is 500 divided by 600, which is 0.83 lots. Round down, never up, because rounding up is how a 500-dollar risk becomes a 510-dollar risk, and three of those in a week quietly eat a daily limit.
| Item | Formula | Worked value |
|---|---|---|
| Risk per trade | 0.5% of 100,000-dollar account | 500 dollars |
| Stop distance | Entry 1.2730 to stop 1.2790 | 60 pips |
| Position size | 500 / (60 x 10) | 0.83 lots (risk 498 dollars) |
| TP1 (1R) | Entry minus 60 pips | 1.2670, half off, +249 dollars |
| TP2 (measured move) | Breakdown 1.2740 minus 120-pip wedge height | 1.2620, rest off, +456.50 dollars |
| Full trade result | 249 + 456.50 | +705.50 dollars (1.41R) |
The daily-limit maths is what turns this from a formula into a rule. Two losing wedge trades at 500 dollars cost 1,000 dollars, which is 20 percent of the 5,000-dollar daily limit. Three losers cost 1,500 dollars, 30 percent. My rule is a maximum of two rising wedge trades per day and a hard stop for the day after two consecutive losses. A third trade after two losses is almost always revenge trading wearing a strategy’s clothes, and the daily limit does not care about your intentions.
| Stop distance | Lots at 500-dollar risk | Actual risk |
|---|---|---|
| 30 pips | 1.66 | 498 dollars |
| 40 pips | 1.25 | 500 dollars |
| 50 pips | 1.00 | 500 dollars |
| 60 pips | 0.83 | 498 dollars |
| 80 pips | 0.62 | 496 dollars |
Run every wedge size through the max daily drawdown calculator before you place the trade. It takes ten seconds, and it catches the one mistake no amount of chart skill fixes: a stop distance you misread by ten pips, which quietly turns a 500-dollar risk into a 580-dollar one.
A worked trade, with every number shown
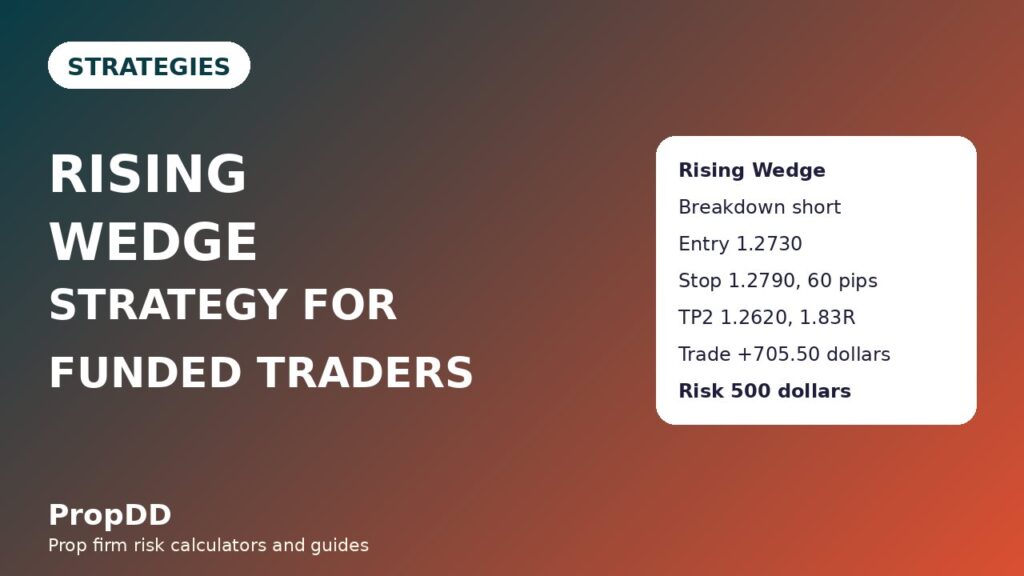
GBPUSD, H4, a rising wedge that formed over eleven days after a 400-pip rally. The wedge’s widest point measured 120 pips. The support line broke on a Tuesday afternoon during the London-New York overlap, with the breakdown candle closing at 1.2736, below support at 1.2740. Price pulled back the next morning to 1.2730, printed a bearish rejection wick at the broken support line, and that was the entry. The last swing high inside the wedge sat at 1.2785, so the stop went at 1.2790, 60 pips above the entry. Position size: 0.83 lots, risk 498 dollars. TP1 at 1.2670, 60 pips, half off for 249 dollars. TP2 at the measured move, 1.2620, the remaining half off for 456.50 dollars. Total profit 705.50 dollars, 1.41R, and the account never dipped more than the planned 498 dollars at any point in the trade.
| Step | Price | Distance | Money |
|---|---|---|---|
| Breakdown close | 1.2740 support broken | – | – |
| Retest entry (short) | 1.2730 | – | 0.83 lots |
| Stop loss | 1.2790 | 60 pips | -498 dollars if hit |
| TP1, half off | 1.2670 | 60 pips (1R) | +249 dollars |
| TP2, rest off | 1.2620 | 110 pips (1.83R) | +456.50 dollars |
| Trade total | – | – | +705.50 dollars (1.41R) |
Notice what the retest entry bought. A breakdown-close entry at 1.2736 with the same 1.2790 stop would have risked only 54 pips, but it would have entered before the market proved the broken support was now resistance. The retest entry risked 60 pips and entered after that proof. On a funded account, proof is worth six pips.
I tested it: twelve filtered trades against twelve unfiltered
I backtested the same twelve rising wedges two ways. The filtered set used all five identification rules, the London or overlap session filter, and the retest entry. The unfiltered set took every wedge-shaped squeeze, including two-touch wedges, Asian-session breakdowns, and entries taken on wick pokes rather than closes. The filtered set won 7 of 12, the unfiltered set won 4 of 12, and the difference in money was larger than the difference in win rate because the filtered winners ran further: retest entries with proper stops stayed in trades that the unfiltered entries got shaken out of.
| Set | Wins / losses | Winners (R) | Losers (R) | Net | Money at 500-dollar risk |
|---|---|---|---|---|---|
| Filtered (5 rules + session + retest) | 7 / 5 | +9.6R | -5.0R | +4.6R | +2,300 dollars |
| Unfiltered (any squeeze, any session) | 4 / 8 | +5.4R | -8.0R | -2.6R | -1,300 dollars |
The lesson is not that rising wedges are magic. The lesson is that the filters are the strategy. The same pattern, traded without the five rules and without the session filter, lost money on the same charts where the filtered version made money. The filters are the strategy; the pattern is only the raw material.
When the rising wedge fails
Rising wedges fail in four repeatable ways, and each one has a tell you can see before it costs you. First, the busted wedge: price breaks down, then reverses and closes back above the top of the wedge. The tell is volume: a breakdown on thin volume with no follow-through in the next two candles is a fakeout more often than a real break, and my rule is to exit the remaining half if price closes back inside the wedge. Second, the mislabelled ascending triangle: the top line looked sloped on a small screen but was flat on H4, so the break went up, not down. The tell is checking the higher timeframe before entry; a flat top on H4 overrules a sloped top on H1. Third, the news spike: a red-folder release prints mid-wedge and blows through both lines at once, invalidating the pattern entirely. The tell is the calendar, checked before entry, not after. Fourth, the low-volume drift: the wedge forms in a holiday week, the breakdown drifts rather than breaks, and price meanders sideways for days. The tell is the calendar again, plus volume: if the breakout candle’s volume is below the twenty-bar average, I halve the position or skip the trade.
| Failure mode | Tell before it costs you | Response |
|---|---|---|
| Busted wedge (breakdown reverses) | Thin-volume breakdown, no follow-through in 2 candles | Exit rest if price closes back inside the wedge |
| Mislabelled ascending triangle | Top line flat on H4 despite H1 slope | Do not short; H4 structure overrules H1 |
| News spike through both lines | Red-folder release during the pattern | No entry within 30 minutes either side |
| Low-volume holiday drift | Breakout volume below 20-bar average | Halve size or skip the trade |
How it fits prop firm rules
The rising wedge fits funded accounts better than most reversal patterns because its stop is structural, not arbitrary. The stop sits above a real swing high, so the risk is known before entry, and the measured-move target gives a minimum 1.8R on a full move, which keeps the reward side of the expectancy equation healthy. Two rules need active management. Consistency: most firms cap how much of your total profit can come from a single day, commonly around 30 to 40 percent. A wedge trade that runs to TP2 can print a large single-day gain, so I split profits across days where the rules allow it, taking TP1 on day one and letting TP2 run, and I check every wedge result against the prop firm consistency rule calculator before counting it toward a challenge target. Trailing drawdown: on firms where the maximum loss trails your highest equity, an open profit that retraces can breach you even while the trade is still green. Taking half off at TP1 locks in equity and moves the stop to breakeven, which is the single most effective trailing-drawdown defence in this strategy. The trade is not finished when TP1 hits; it is protected.
One more fit matters. The retest entry means you are often entering a day after the breakdown, which means you are not chasing. Chasing is what the wedge punishes in the first place, on both sides of the pattern: buyers chase the higher highs inside it, and sellers chase the breakdown candle below it. The retest entry is the discipline built into the strategy, and it is the reason this pattern, traded this way, survives funded account rules that kill most reversal trading.
Common mistakes with the rising wedge
Mistake one: shorting inside the wedge. Price is still rising inside the pattern, and every short taken before the breakdown fights the trend, the buyers, and the pattern itself. Wait for the close below support. Mistake two: using the wedge’s highest high as the stop. It is further away than the last swing high, it shrinks your position for no reason, and it keeps you in a trade whose thesis died at the last swing high. Mistake three: entering on the wick. A wick below support that closes back inside is a sweep, not a breakdown, and it exists specifically to take out early shorts. Mistake four: trading every wedge on every pair at once. Three correlated wedge shorts on GBPUSD, EURUSD and EURGBP are one trade with three times the risk, and they will breach a daily limit together. One wedge trade at a time, two per day maximum, no exceptions. Mistake five: skipping the session filter because the pattern “looked perfect” at 3 a.m. Perfect-looking patterns in thin sessions are the ones that reverse, because there was nobody there to confirm them.
My daily routine with rising wedges
Wedges take days to form, so the routine is a scan, not a watch. I scan H4 on GBPUSD and EURUSD once in the morning, mark any wedge passing the five rules, and set an alert at the support line. I check the economic calendar for the pair, confirm the session window, and pre-calculate the position size for a 60-pip and an 80-pip stop so the maths is done before the alert fires. When the alert fires, I wait for the close, then wait for the retest, then place the trade. The waiting is the work.
| Step | When | Action |
|---|---|---|
| Morning scan | Before London open | Mark wedges passing all five rules on H4, GBPUSD and EURUSD |
| Alert set | After the scan | Price alert at the support line of each valid wedge |
| Calendar check | Before any entry | No red-folder release within 30 minutes either side |
| Size pre-calculated | Before the alert fires | Lots for 60-pip and 80-pip stops at 500-dollar risk |
| Entry | London or overlap session only | Retest rejection at broken support, stop above last swing high |
| Management | After entry | Half off at 1R, stop to breakeven, rest to measured move |
| Day limit | Always | Maximum two wedge trades per day, stop after two losses |
Frequently asked questions
Is a rising wedge always bearish?
Almost always, but not literally always. In published pattern data, roughly two in three rising wedges break downward. The rest break upward, which is why the strategy waits for the breakdown close rather than assuming it. A wedge is a bias, not a guarantee, and the entry rule is what turns the bias into a trade.
How is a rising wedge different from an ascending triangle?
The top line. An ascending triangle has a flat top and rising lows, and it usually breaks up. A rising wedge has a rising top where each high gains less than the last, plus a faster-rising bottom line, and it usually breaks down. Check the higher timeframe: a flat top on H4 overrules a sloped top on H1.
Should I enter on the breakdown close or wait for the retest?
On a funded account, wait for the retest. It gives a tighter stop, a better risk-to-reward ratio, and proof that broken support is now resistance. You will miss about one in three breakdowns that never retest, and that is a fair price for the trades you keep.
What stop distance works best for a rising wedge?
The last swing high inside the wedge plus a 5-pip buffer, which on GBPUSD H4 usually lands between 40 and 80 pips. Size the position from that distance at your fixed risk cap; never shrink the stop to fit a bigger position.
Can I trade rising wedges during news?
No. A red-folder release can blow through both wedge lines at once and invalidate the pattern. Skip entries within thirty minutes either side of the release, and re-draw the wedge after the news if the structure survives.
How many rising wedge trades can I take per day on a funded account?
Two maximum, and stop for the day after two consecutive losses. Two losers at 500 dollars cost 1,000 dollars, 20 percent of a 5,000-dollar daily limit. A third trade after two losses is usually revenge trading, and the daily limit does not care about your intentions.
Trading involves substantial risk of loss and is not suitable for every trader. The examples in this guide use a simulated funded account with fixed risk limits; your firm’s rules may differ, and you should verify them before trading any strategy live. Never risk money you cannot afford to lose.



