I paid 500 dollars to learn that a flag is not a breakout until price proves it twice. It was a Tuesday on EURUSD, hourly chart, and the pair had just ripped 120 pips higher in one clean leg. Price paused, drifted down for a few candles, and I bought the first green candle that poked above the little consolidation. It looked like a textbook bull flag. It was not. Price slipped straight back inside the flag, stopped me out, and then, two hours later, broke out properly and ran 100 pips without me. I had paid for the lesson and missed the move, because I had traded the shape instead of the confirmation.
In this article
- What a bull flag is, and what it is not
- The six rules I will not break
- Setup, entry, stop loss and take profit
- The position-sizing maths under a daily loss limit
- The worked trade, candle by candle
- The sizing grid for different flag widths
- Five days of flag trades, with the real results
- When the flag fails, and how I know it early
- My daily flag routine
- How the bull flag fits prop firm rules
- Frequently asked questions
That loss changed how I trade every flag since. A bull flag is a continuation pattern: a sharp upward move, called the pole, followed by a short downward-sloping or sideways pause, called the flag, followed by a break higher. On a personal account the shape alone is tempting enough. On a funded account it is dangerous, because a false breakout costs not just the loss but the daily-limit room and the confidence you need for the rest of the session. This article is the funded version: the exact rules I use, the session filter, the position-sizing maths under a 5 percent daily loss limit, a worked trade with real numbers, five real days of results, and the failure modes that still catch me when I get lazy.
What a bull flag is, and what it is not
A bull flag needs three parts, in order. First, a pole: a strong, fast upward move, ideally on rising volume, that shows buyers are in control. Second, a flag: a brief consolidation that slopes down or sideways, on falling volume, where sellers try and fail to take back much ground. Third, a breakout: price closes above the top of the flag on rising volume, and then, in my version, comes back to retest that broken level and holds it. Skip any one part and you do not have a flag trade. You have a guess wearing a pattern’s clothes.
The flag is not a range, not a triangle and not a reason to buy a dip. A range has no pole before it. A triangle squeezes from both sides; a flag drifts in one direction only, gently down against the trend. And a dip inside the flag is not an entry, because the flag can keep drifting, widen, and turn into a full reversal. The pole is the evidence, the flag is the pause, and the retest is the permission. If I cannot point to all three on the chart, I do not trade it.
For a second, independent description of the same pole-and-flag structure, see the bull flag pattern guide for prop firm traders, which also stresses defined entries and risk limits before any breakout is chased. Rule 6 is the one most traders skip, and it is the one that saved my account.
The six rules I will not break
Every flag I take must pass six rules before I touch the order ticket. They are boring, and that is the point. Boring rules are the ones I can still follow at 3pm after two losing trades, when the exciting rules have already been abandoned.
| Rule | The test | Why it matters on a funded account |
|---|---|---|
| 1. A real pole | At least 80 pips in one leg on EURUSD hourly, with volume rising on the move | Without a pole there is no momentum to continue |
| 2. A shallow flag | Flag retraces no more than 50 percent of the pole | A deeper pullback means buyers have lost control |
| 3. A short flag | Flag lasts 5 to 20 candles on the hourly chart | Longer flags go stale and break either way |
| 4. Falling volume in the flag | Volume contracts during the pause, then expands on the breakout | Quiet sellers, then real buyers returning |
| 5. A close above the flag | An hourly candle closes above the flag’s top trendline | Wicks alone are stop hunts, not breakouts |
| 6. A retest that holds | Price returns to the broken level and closes back above it | The retest is what filters most fakeouts |
Missing a trade costs nothing; taking a fakeout costs a full risk.
Setup, entry, stop loss and take profit
The setup starts on the hourly chart, because that is where poles and flags are clean enough to measure and slow enough to manage. I mark the pole low and the pole high, then draw the flag’s two lines: the top trendline across the flag’s highs and the bottom trendline across its lows. The breakout level is the top trendline, not the pole high. The stop goes below the flag low, not below the pole low, because the flag low is the point where the pattern is proven wrong.
Entry comes on the retest. After the hourly close above the flag top, I place a buy limit at the broken level, or I buy the first hourly candle that dips to it and closes back above it. If price never comes back, I let it go. The stop sits 5 pips below the flag low, to allow for a wick without giving back the pattern. Take profit is split: half the position at 1R, which is the same distance as the stop, and half at 2R, with the measured move, the full pole height projected from the breakout, as the outer guide. I never move the stop further away once the trade is live, and I never add to a flag trade that is already in profit by doubling the size. One flag, one risk, one plan.
The session filter matters as much as the pattern. I only take bull flags during the London and early New York sessions, when EURUSD volume is real and breakouts have follow-through. Flags that break out in the dead hours between midnight and 6am London time are the ones that fake out most often in my log, so I ignore them even when they look perfect. A perfect pattern at the wrong hour is still the wrong trade.
The position-sizing maths under a daily loss limit
The maths is the whole strategy, because the pattern without the maths is just a picture. My account is 100,000 dollars with a 5 percent daily loss limit, which is 5,000 dollars. My personal daily stop is half of that, 2,500 dollars, because I never want one bad day to use the firm’s full allowance. My risk per trade is 500 dollars, which is 0.5 percent of the account and one-fifth of my personal daily stop. Five losing trades in a row cost 2,500 dollars and end my day. That is the deal I made with myself, and it is what keeps one flag from becoming a breach.
| Input | Value | Working |
|---|---|---|
| Account size | 100,000 dollars | The funded balance I am protecting |
| Firm daily loss limit | 5,000 dollars | 5 percent of 100,000 dollars |
| My personal daily stop | 2,500 dollars | Half the firm limit, my own rule |
| Risk per trade | 500 dollars | 0.5 percent of the account |
| Losing trades to stop for the day | 5 trades | 2,500 divided by 500 |
| Pip value, 1.00 lot EURUSD | 10 dollars per pip | Standard lot pip value |
The sizing formula is simple and I run it before every entry, never after. Position size in lots equals risk in dollars divided by stop distance in pips times pip value. If the stop is 50 pips and the pip value is 10 dollars, the size is 500 divided by 500, which is 1.00 lot. If the stop is wider, the size gets smaller, never the risk bigger. Widening the stop to fit a bigger size is the oldest funded-account trick, and it only tricks the trader. I check the result against the max daily drawdown calculator before I trade a new pair, because a pair with a different pip value changes every number in the table.
The worked trade, candle by candle
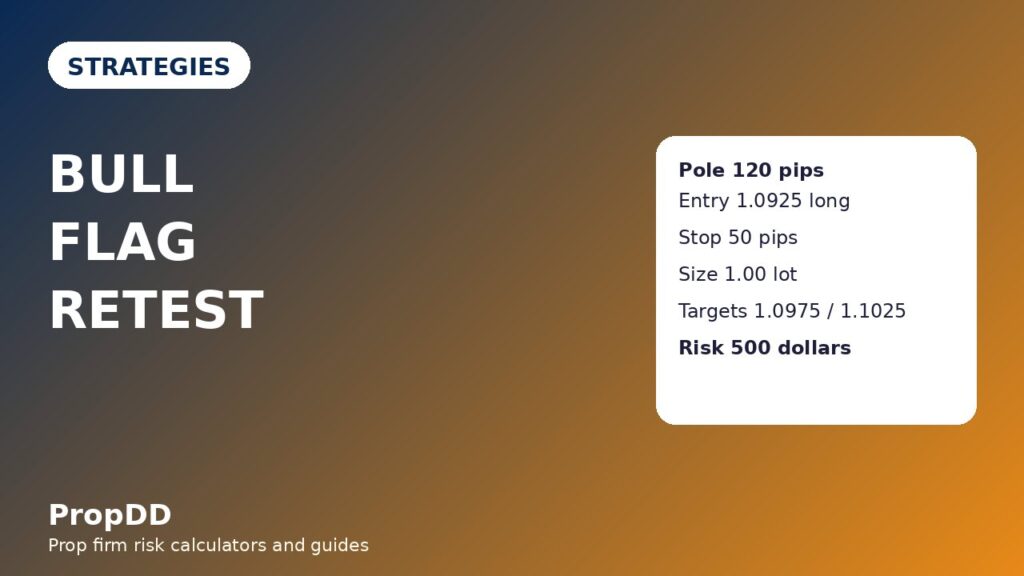
Here is the trade that taught me the retest rule properly, replayed with the numbers exactly as they happened. EURUSD had risen from 1.0800 to 1.0920, a 120-pip pole, during the London morning. Price then drifted down to 1.0880 over nine hourly candles, a flag that retraced 40 pips, which is one-third of the pole and well inside my 50 percent limit. Volume fell during the drift. An hourly candle then closed at 1.0930, above the flag top at 1.0925. I did not buy that close. I waited.
Two hours later price dipped to 1.0925, touched the broken level, and closed back above it at 1.0932. That was my entry: long at 1.0925 on the retest. The flag low was 1.0880, so with a 5-pip buffer my stop went at 1.0875, which is 50 pips below entry. The size was 500 divided by 50 times 10, which is 1.00 lot, risking exactly 500 dollars. The first target, 1R, was 1.0975, 50 pips above entry. The second target, 2R, was 1.1025, 100 pips above entry. The full measured move, the 120-pip pole projected from the breakout at 1.0925, pointed to 1.1045, but I did not need the full move to get paid.
| Step | Level | Maths |
|---|---|---|
| Pole low to pole high | 1.0800 to 1.0920 | 120-pip pole |
| Flag low | 1.0880 | 40-pip retracement, one-third of the pole |
| Breakout close | 1.0930 | Hourly close above the flag top at 1.0925 |
| Retest entry | 1.0925 long | Broken level retested and held |
| Stop loss | 1.0875 | Flag low minus 5 pips, 50-pip stop |
| Position size | 1.00 lot | 500 divided by (50 times 10) |
| Take profit 1 (half position) | 1.0975 | 50 pips, 1R, 250 dollars on half size |
| Take profit 2 (half position) | 1.1025 | 100 pips, 2R, 500 dollars on half size |
| Total if both targets hit | 750 dollars | 250 plus 500, equal to 1.5R overall |
Price hit the first target the same afternoon and the second the next morning, for 750 dollars in total, which is 1.5R on the full risk. The trade worked because every part of the plan was decided before entry: the level, the stop, the size and the two exits. Nothing was improvised while money was at risk, and that is the real difference between the Tuesday I lost 500 dollars chasing a wick and the week I made it back with the retest.
The sizing grid for different flag widths
Not every flag has a 50-pip stop, and the size must change with the flag, not the other way round. This grid is taped next to my screen, and I use it instead of guessing when a flag is wider or tighter than usual. The risk stays at 500 dollars in every row. Only the size moves.
| Stop distance | Position size | Dollars risked | When I see this width |
|---|---|---|---|
| 30 pips | 1.66 lots | 498 dollars | Tight flag on a strong pole, London morning |
| 40 pips | 1.25 lots | 500 dollars | Typical hourly flag |
| 50 pips | 1.00 lot | 500 dollars | The worked trade above |
| 60 pips | 0.83 lots | 498 dollars | Wide flag, still inside the 50 percent rule |
| 80 pips | 0.62 lots | 496 dollars | Maximum width I will trade; wider means skip |
Any flag needing a stop wider than 80 pips on EURUSD hourly is skipped, because the size becomes so small that the trade is not worth the daily-limit room it uses, and because very wide flags usually mean the trend is already tired. Skipping is a position. It is the position I take most often, and my account survives because of it.
Five days of flag trades, with the real results
Here are five consecutive flag trades from my log, in the order they happened, with no cherry-picking. Two of them lost. The week still finished positive, because the winners were bigger than the losers and the risk never changed. That is the only way a continuation strategy survives a funded account: the maths carries the weeks when the pattern does not.
| Day | Setup | Result | Profit or loss |
|---|---|---|---|
| Monday | EURUSD flag, retest held, 50-pip stop | Both targets hit | Plus 750 dollars (1.5R) |
| Tuesday | GBPUSD flag, retest failed, stop hit | Full loss | Minus 500 dollars (minus 1R) |
| Wednesday | EURUSD flag, first target only | Half at 1R, half stopped at entry | Plus 250 dollars (0.5R) |
| Thursday | USDJPY flag, breakout faded | Full loss | Minus 500 dollars (minus 1R) |
| Friday | EURUSD flag, both targets hit | Both targets hit | Plus 1,000 dollars (2R) |
| Week total | 3 wins, 2 losses | Net | Plus 1,000 dollars (2R) |
The Tuesday loss is the instructive one. The retest looked good for one candle, then price closed back inside the flag, and my stop was hit before I could talk myself out of it. I did not re-enter, I did not double the size on Wednesday to win it back, and I did not move the stop on Thursday’s trade because I was annoyed. The weekly total is plus 1,000 dollars on 500-dollar risk, which is 2R, and it came from following the same plan five times, not from one brilliant call. Compare that with the trend pullback strategy, which trades the same idea, buying strength after a pause, but enters on the pullback itself rather than waiting for a breakout and retest. The flag is stricter, so it trades less often, and that strictness is the point.
When the flag fails, and how I know it early
Flags fail in predictable ways, and naming them in advance is what stops me from holding a failed pattern like it is still a trade. The most common failure is the breakout that never retests and falls straight back inside the flag. That is a failed breakout, and my rule is simple: if price closes back inside the flag after breaking out, the trade is over, whether my stop is hit or not. I exit on that close rather than waiting for the stop, because a pattern that has already failed does not deserve my full risk.
| Failure mode | Early warning | My response |
|---|---|---|
| Fakeout breakout | Breakout candle closes back inside the flag | Exit on the close, do not re-enter the same flag |
| Flag too deep | Retracement passes 50 percent of the pole | Cancel the setup, pattern invalid |
| Flag too long | More than 20 hourly candles without a break | Cancel the setup, momentum has gone stale |
| News spike breakout | Breakout candle is a news candle, volume extreme | Skip entirely, news breaks are not flag breaks |
| Retest turns into a reversal | Retest candle closes below the broken level | No entry, wait for a new pattern |
The news rule deserves emphasis, because it is where funded accounts die quietly. Many firms ban trading around high-impact news, and even where they do not, a news candle can break a flag, stop out the retest traders, and reverse in minutes. I check the calendar before every flag, and if a red-folder release lands inside the trade’s window, I skip the setup. The London breakout strategy has the same discipline around its morning window, and for the same reason: a breakout without a clean session behind it is a coin flip with a daily limit attached. The rectangle breakout guide covers the same fakeout problem from the range side, and the pennant strategy is the flag’s close cousin, a tighter coil after the same kind of pole, with the same retest rule.
My daily flag routine
The routine is deliberately short, because a routine with twenty steps is a routine I will skip. I run it once, at the start of the London session, and then I only act when a flag passes every line. No scanning all day, no chasing flags on five pairs at once, no trading a flag I found at midnight because I could not sleep.
| Time | Step | Detail |
|---|---|---|
| 07:00 London | Mark poles | Scan EURUSD and GBPUSD hourly for poles of 80 pips or more |
| 07:15 London | Check the calendar | Skip any flag whose window holds a high-impact release |
| 07:30 London | Draw flags | Mark flag top and bottom, check retracement under 50 percent |
| Session | Wait for the close | Only an hourly close above the flag top counts as a breakout |
| Session | Wait for the retest | Buy the retest that holds, or let the trade go |
| After exit | Log it | Record pole, flag depth, entry, stop, targets and result |
One flag per day is my cap. If the first flag loses, I am done for the day unless a second flag is genuinely perfect, and even then the risk stays at 500 dollars, never doubled to recover the first loss. That cap, more than any pattern detail, is what keeps a bull flag strategy compatible with a funded account. The strategy does not need many trades. It needs the right trade, sized right, once.
How the bull flag fits prop firm rules
The flag fits funded rules well, but only with the filters in this article. It is a trend-following pattern, so it rarely breaches consistency rules the way a single huge win can, because its wins are 1R to 2R, not 5R gambles. It respects the daily loss limit because the stop is set from the pattern, not from hope, and the size is calculated from the stop. It respects the overall drawdown for the same reason: five losing flags in a row cost 2,500 dollars, which is 2.5 percent of a 100,000-dollar account, well inside a 10 percent overall limit. And it respects the minimum trading days idea, because one careful flag per day builds a steady record instead of a frantic one.
Where it can still hurt you is overtrading. Flags appear often, especially on lower timeframes, and every extra flag is another 500 dollars of risk and another chance to use up the daily stop before the good setup arrives. That is why this article insists on the hourly chart, the London and early New York sessions, and one flag per day. Drop to the 15-minute chart and the flags multiply, the fakeouts multiply faster, and the daily limit does the rest. For the wider picture on keeping a funded account alive, the minimum trading days rule guide explains why steady, countable days beat bursts of activity, and the supply and demand zones guide shows how a flag that forms at a real zone is worth more than the same shape floating in the middle of nowhere.
Frequently asked questions
What is a bull flag in trading?
A bull flag is a bullish continuation pattern with three parts: a sharp upward move called the pole, a short downward-sloping or sideways pause called the flag, and a break higher out of the flag. It signals that buyers paused briefly and then resumed control, rather than reversing.
How long should a bull flag last?
On the hourly chart I want the flag to last between 5 and 20 candles. Shorter flags can be noise, and longer flags go stale, lose their momentum, and break in either direction. A flag that has drifted for a full day without breaking is no longer a flag trade.
Should I buy the breakout or wait for the retest?
On a funded account I wait for the retest. Buying the breakout candle itself catches more moves but also catches more fakeouts, and fakeouts cost full risk. The retest costs some missed trades, but it filters the breakouts that were never real, which is the trade-off that protects a daily loss limit.
Where do I place the stop loss on a bull flag?
Below the flag low, with a small buffer of about 5 pips on EURUSD hourly. The flag low is where the pattern is proven wrong, so a stop there risks the least while still giving the pattern room. A stop below the pole low risks far more for the same trade and breaks the sizing maths.
How do I size a bull flag trade on a funded account?
Divide your fixed dollar risk by the stop distance in pips times the pip value. With 500 dollars of risk, a 50-pip stop and a 10-dollar pip value, the size is 1.00 lot. If the stop widens, the size shrinks. The risk never grows to fit the pattern.
Why do so many bull flags fail on funded accounts?
Mostly because traders buy the first poke above the flag instead of a close and a retest, trade flags in dead sessions or around news, or size the trade to the pole instead of the stop. Each of those mistakes turns a sound continuation pattern into a daily-limit problem. The pattern is rarely the problem. The entry, the session and the size usually are.
Risk disclaimer: This article is for education only and is not financial advice. Trading leveraged products carries a high risk of loss, and prop firm rules vary by firm and programme. Always read your firm’s current rulebook, practise on a demo or evaluation account first, and never risk money you cannot afford to lose.



1 comment
[…] VCP is not a flag, not a triangle and not a range. A flag has one pause after one pole, and my bull flag guide trades that single pause on a retest. A triangle squeezes from both sides and breaks either way, […]