I used to lose funded-account days to trends that were not trends at all. The chart would climb for an hour, I would buy the pullback, and price would slide sideways for the rest of the session, chewing through my stop one wick at a time. The direction had been right in the loosest sense — price ended the day roughly where it started — but nothing about the journey had been tradeable. What I was missing was a way to measure how much of a move was progress and how much was wasted motion, before I risked money on it.
In this article
- What the efficiency ratio measures, and what it does not
- The formula, worked by hand on ten EURUSD closes
- Best settings for prop-firm trading
- How to read its signals
- How the ratio fits prop firm rules
- A worked trade: the 0.60 reading that earned its risk
- Twelve trades with the filter, and twelve without it
- Common mistakes with the efficiency ratio
- My daily routine with the efficiency ratio
- Frequently asked questions
Perry Kaufman’s Efficiency Ratio gave me that measurement, and it is now the first filter I check before any trend trade. It is a single number between 0 and 1: 1 means price moved in a straight line, 0 means it ended exactly where it started after wandering everywhere. It does not tell me which way price will go — that is the one misunderstanding to clear up first — but it tells me whether the market is moving efficiently enough to deserve my daily loss limit. This guide works the formula by hand, sets the thresholds I actually use, and shows one worked trade with the sizing maths that keeps it inside a funded account’s rules.
What the efficiency ratio measures, and what it does not
The efficiency ratio answers one question: of all the distance price travelled over the last N bars, how much of it was useful progress? Imagine two ten-bar stretches on EURUSD. In the first, price climbs 60 pips with only small pullbacks. In the second, price zigzags up and down 100 pips in total but ends just 2 pips from where it started. Both stretches were busy. Only the first was efficient, and only the first is worth trading with trend rules.
That distinction is exactly what a funded trader needs, because funded rules punish wasted motion twice over. Every chop trade that stops out costs real drawdown against a 5,000-dollar daily limit, and every sideways afternoon spent in a trade that goes nowhere costs the consistency and patience a challenge measures. The ratio is a gate, not a signal: a high reading does not say buy, it says the market is trending cleanly enough that a buy signal from something else — a pullback, a breakout, a moving-average cross — is worth taking. A low reading does not say sell, it says stand aside, because any signal fired in chop is likely to be noise.
Two common confusions are worth clearing up before the formula. First, the efficiency ratio is not the same as the Kaufman Adaptive Moving Average, even though KAMA uses the efficiency ratio inside its own maths to speed up in trends and slow down in chop. KAMA is a moving average; the ratio on its own is a pure regime filter, and this article treats it that way. Second, the ratio is not directional, in the same way that ADX is not directional: a reading of 0.80 on a falling market means a clean downtrend, not a buying opportunity. Direction always comes from price structure or another indicator; the ratio only votes on quality.
The formula, worked by hand on ten EURUSD closes
Kaufman’s formula, as described in his own work and in the MQL5 Kaufman Efficiency Ratio manual, is simple enough to compute on a notepad. Over N bars:
| Step | Formula | What it means |
|---|---|---|
| 1. Net change (direction) | Absolute value of (Close now minus Close N bars ago) | How far price actually got |
| 2. Total movement (volatility) | Sum of the absolute bar-to-bar changes over the same N bars | How far price travelled to get there |
| 3. Efficiency ratio | Net change divided by total movement | A score from 0 (all noise) to 1 (a straight line) |
Here is a ten-bar EURUSD stretch worked in full. The closes run from 1.0800 ten bars ago to 1.0860 now, and the bar-to-bar changes are +10, -5, +15, -5, +15, -5, +15, -5, +15 and +10 pips:
| Bar | Close | Change from previous close | Absolute change |
|---|---|---|---|
| 10 bars ago | 1.0800 | — | — |
| 9 bars ago | 1.0810 | +10 pips | 10 |
| 8 bars ago | 1.0805 | -5 pips | 5 |
| 7 bars ago | 1.0820 | +15 pips | 15 |
| 6 bars ago | 1.0815 | -5 pips | 5 |
| 5 bars ago | 1.0830 | +15 pips | 15 |
| 4 bars ago | 1.0825 | -5 pips | 5 |
| 3 bars ago | 1.0840 | +15 pips | 15 |
| 2 bars ago | 1.0835 | -5 pips | 5 |
| 1 bar ago | 1.0850 | +15 pips | 15 |
| Now | 1.0860 | +10 pips | 10 |
| Total | Net change: 1.0860 – 1.0800 = 60 pips | — | 100 pips |
Efficiency ratio = 60 / 100 = 0.60. Sixty percent of everything price did was progress; forty percent was backtracking. That is a trending market by any honest definition, and it is the kind of market where a pullback entry earns its risk.
Now the contrast, because the contrast is the whole point. Take another ten-bar stretch with the same total activity — bar-to-bar moves of +12, -10, +11, -9, +10, -12, +9, -11, +10 and -8 pips, totalling 102 pips of travel — but a net change of only 2 pips, from 1.0800 to 1.0802. Efficiency ratio = 2 / 102 = 0.02. The market was just as busy and got nowhere. A trader who bought every pullback in the first stretch and every pullback in the second stretch took the same number of trades; only the first stretch paid. The ratio is how I tell them apart before the fact, not after.
Best settings for prop-firm trading
The lookback period is the only setting that matters, and it should match the timeframe you trade. On H1 and H4, which is where most funded-account trading happens, I use N = 10. Shorter than that — 5 bars — and a single strong bar inflates the score; longer — 20 or 30 bars — and the score lags so far behind the regime change that the trend is half over before the gate opens. On M15 I use the same 10-bar lookback but demand a higher threshold, because intraday noise is heavier. On D1, 10 bars is roughly two trading weeks, which suits swing trades but is too slow for a challenge account with a time limit.
| Timeframe | Lookback (N) | Trend gate (trade trend setups) | Chop floor (stand aside) |
|---|---|---|---|
| M15 | 10 bars | 0.65 or higher | Below 0.30 |
| H1 (my default) | 10 bars | 0.60 or higher | Below 0.25 |
| H4 | 10 bars | 0.55 or higher | Below 0.25 |
| D1 | 10 bars | 0.50 or higher | Below 0.20 |
Between the gate and the floor is a grey zone — 0.25 to 0.60 on H1 — where I take only the very best setups, half size, and only in the direction of the higher timeframe. The thresholds are deliberately asymmetric: it takes a strong reading to earn full size, but only a weak reading to keep me out entirely, because on a funded account the cost of a chop trade is not just the loss, it is the drawdown it consumes and the consistency percentage it distorts. I also never use the ratio alone on the trading timeframe; I check it on one timeframe higher as well, and both must agree before I take full size. A 0.60 reading on H1 inside a 0.15 reading on H4 is a counter-trend bounce, not a trend.
How to read its signals
Reading the ratio is a three-zone exercise, not a crossover system. There is no signal line to cross and no divergence to hunt, which is part of its appeal: it cannot whipsaw you the way an oscillator can, because it is not trying to time entries at all.
| Reading | What the market is doing | What I do on a funded account |
|---|---|---|
| 0.60 or higher | Clean trend, most movement is progress | Trade trend setups at full size (pullbacks, breakouts in trend direction) |
| 0.25 to 0.60 | Transitional, trend forming or fading | Half size only, best setups only, higher-timeframe direction only |
| Below 0.25 | Chop, almost all movement is wasted | No trend trades; range setups only, or stand aside entirely |
| Rising through 0.60 | Chop resolving into trend | Watch for the first pullback entry; do not chase the breakout bar itself |
| Falling through 0.25 | Trend dissolving into chop | Stop adding to trend trades; tighten or exit runners at the next level |
| High reading, wrong direction | Clean trend against my position | Exit, not average down — a high ratio means the move against me is real |
The last row is the one that saved my account more than once. When I am long and the ratio climbs while price falls, that is not a reason to hope; it is confirmation that the downtrend is efficient and my long is wrong. The ratio’s honesty cuts both ways, and funded traders who listen to the uncomfortable half of it keep their accounts longer than traders who only hear the half that agrees with them.
How the ratio fits prop firm rules
Three funded-account rules make the ratio more valuable than it is on a personal account. The daily loss limit means every chop trade is a direct tax on the day: three stopped-out chop trades at 500 dollars each is 1,500 dollars, 30 percent of a 5,000-dollar day, spent on a market that was never going anywhere. The consistency rule means a single lucky chop win cannot carry the account — my best day must stay under 30 percent of total profit — so the ratio’s habit of keeping me out of low-quality trades also keeps my profit distribution honest. And the trailing drawdown rule means a position held through chop that drifts against me can lock in a lower high-water mark even if it eventually recovers, so standing aside in chop is not passivity, it is drawdown defence.
I pair the ratio with two other tools on this site. Trend pullback supplies the entry rules once the ratio’s gate is open, and the Max Daily Drawdown Calculator sizes every trade so that even a full-size trend trade risks only 10 percent of the daily limit. The ratio decides whether to trade; the strategy decides how; the calculator decides how much. No single one of the three is enough on its own.
A worked trade: the 0.60 reading that earned its risk
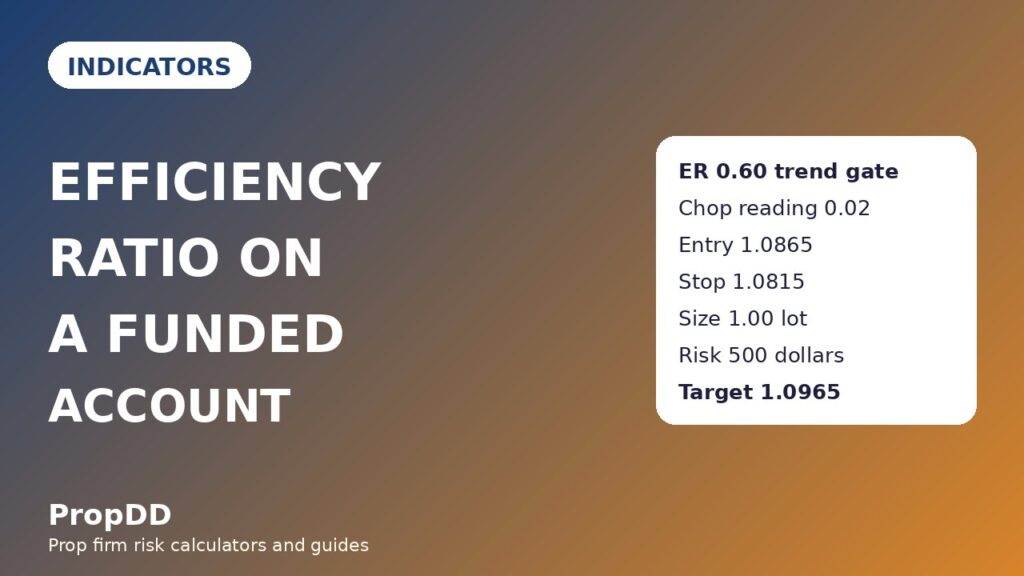
On a Tuesday London session, EURUSD printed the ten-bar stretch from the formula section above and the ratio stood at 0.60. Price had pulled back from 1.0860 to 1.0840, the higher-timeframe trend was up, and the ratio on H4 was 0.58 — just above my H4 gate. That was a green light, not a trade in itself: I still needed a pullback entry with a defined stop, and I still needed the size to fit my 500-dollar risk cap.
| Trade element | Level / value | Reason |
|---|---|---|
| Efficiency ratio (H1) | 0.60 | At the trend gate; trend setups allowed at full size |
| Efficiency ratio (H4) | 0.58 | Above the H4 gate; higher timeframe agrees |
| Entry (long) | 1.0865 | Break of the pullback high after the 1.0840 retracement held |
| Stop loss | 1.0815 | Below the pullback low, 50 pips of risk |
| Position size | 1.00 lot | 500 dollars / (50 pips x 10 dollars) = 1.00 lot |
| Target 1 (1R) | 1.0915 | +500 dollars; half the position closed here |
| Target 2 (2R) | 1.0965 | +1,000 dollars; remainder closed here |
The sizing formula is the same one I use on every trade: size = risk cap / (stop distance x pip value). Here 500 / (50 x 10) = 1.00 lot exactly, so the full position risked 500 dollars, 10 percent of the 5,000-dollar daily limit. Had the stop been 80 pips instead, the size would have been 500 / (80 x 10) = 0.63 lots, rounded down. The ratio never changes the size; it only decides whether the trade is taken at all, and that separation is deliberate. A filter that also sized positions would let a very high reading justify a very large trade, which is exactly how a funded account dies on one confident afternoon.
| Stop distance | Size at 500 dollars risk | Actual risk (rounded down) |
|---|---|---|
| 30 pips | 1.67 lots | 501 dollars — round down to 1.66 lots, 498 dollars |
| 40 pips | 1.25 lots | 500 dollars |
| 50 pips | 1.00 lot | 500 dollars |
| 60 pips | 0.83 lots | 498 dollars |
| 80 pips | 0.63 lots | 504 dollars — round down to 0.62 lots, 496 dollars |
Note the two rows where rounding down matters: at 30 pips, 1.67 lots would risk 501 dollars, one dollar over my cap, so I trade 1.66 lots; at 80 pips, 0.63 lots would risk 504 dollars, so I trade 0.62 lots. On a funded account a cap is a cap, and a one-dollar breach is still a breach of the discipline the cap exists to enforce.
Twelve trades with the filter, and twelve without it
I tested the filter the only honest way available to a retail trader: I took the same twelve setups, once with the ratio gate applied and once without, on the same pairs and the same weeks. The filtered set only took trades where the H1 ratio was 0.60 or higher and the H4 ratio agreed; the unfiltered set took every pullback signal regardless of regime.
| Set | Wins / losses | Gross result | Net result | Best single day |
|---|---|---|---|---|
| Filtered (ratio gate on) | 8 wins, 4 losses | Winners 13R, losers 4R | +9R = +4,500 dollars | 1,000 dollars = 22.2% of net, inside the 30% cap |
| Unfiltered (every signal) | 3 wins, 7 losses | Winners 5R, losers 8R | -3R = -1,500 dollars | — |
The filtered winners break down as five trades at 2R and three at 1R, which is 13R, minus four losing trades at 1R each, giving +9R. The average winner is 1.63R. The unfiltered set is the mirror image: the same market, the same signals, but with chop trades included the win rate collapses from 67 percent to 30 percent and the account loses 1,500 dollars. The difference is not a better entry technique; it is simply refusing to trade when the market is not moving efficiently. That is a lesson worth more than any entry refinement, because it costs nothing to apply and it works on every pair.
Common mistakes with the efficiency ratio
| Mistake | Why it hurts a funded account | The fix |
|---|---|---|
| Trading the ratio as a directional signal | A high reading on a falling market is a sell regime, not a buy signal | Use it as a gate only; direction comes from price structure |
| Using it on one timeframe only | H1 efficiency inside H4 chop is a counter-trend bounce | Require agreement on one timeframe higher before full size |
| Chasing the breakout bar when the ratio crosses 0.60 | The breakout bar is where slippage and fakeouts live | Wait for the first pullback after the gate opens |
| Confusing it with KAMA | KAMA smooths price; the ratio filters regimes — different jobs | Keep them separate: ratio gates, KAMA (if used) trails |
| Letting a high reading justify oversized trades | One confident trade can eat 30 percent of a daily limit | Size from the stop and the 500-dollar cap, never from the reading |
| Ignoring a falling ratio in an open trade | A trend dissolving into chop traps runners that never reach target | Exit or tighten runners when the ratio falls through 0.25 |
The mistake I made longest was the third one. When the ratio crossed 0.60 I treated it as an entry, bought the breakout bar, and watched price retrace into my stop while the trend later continued without me. The gate opening is the market telling me it is ready; the pullback is the market telling me where to get in. Waiting for both costs me the first few pips of the move and saves me the stop-outs, and on a funded account that trade is always worth making.
My daily routine with the efficiency ratio
| Step | When | Action |
|---|---|---|
| 1. Regime check | Before the London open | Record H1 and H4 ratios for EURUSD and GBPUSD; note which pairs are above 0.60 |
| 2. Gate decision | Before any trade | Full size only where both timeframes clear the gate; half size in the grey zone; nothing below 0.25 |
| 3. Entry | After the gate opens | Wait for a pullback entry per trend-pullback rules; never chase the breakout bar |
| 4. Sizing | Before placing the order | Size = 500 / (stop pips x 10); round down; check against the drawdown calculator |
| 5. Management | While in a trade | If the ratio falls through 0.25, tighten or exit runners at the next level |
| 6. Journal | End of session | Log the ratio at entry for every trade; review whether chop trades are creeping back in |
That journal step is what keeps the filter honest. If my log shows trades taken below 0.25, I am not following the system, and no indicator can fix a trader who ignores his own gate. Partial closes at 1R are how I bank the first target on filtered trades, and the Choppiness Index is the complementary read I check when the ratio sits in the grey zone — where the ratio says “not clearly trending”, choppiness confirms whether the market is genuinely ranging or merely pausing.
Frequently asked questions
Is the efficiency ratio a buy or sell indicator?
Neither. It measures how efficiently price is moving, not which way. A high reading on a rising market supports long trend trades; a high reading on a falling market supports short trend trades. Direction must come from price structure, a trendline, or another indicator.
What lookback period should I use on a funded account?
Ten bars on H1 or H4 is my default, because it balances responsiveness against noise. Five bars reacts too fast and inflates the score on a single strong candle; twenty or more lags so far that the trend is half over before the gate opens.
Can the efficiency ratio be 1 or 0 in practice?
Almost never exactly. A reading of 1 would require every bar to move the same direction with no pullback at all, and 0 would require price to end exactly where it started. Real readings live between 0.10 and 0.90, and the useful question is which zone they fall in, not whether they touch the extremes.
How is it different from ADX?
Both are non-directional regime measures, but ADX is built from directional movement and smoothed over 14 periods, while the efficiency ratio is a raw ratio of net change to total movement over 10 bars. The ratio reacts faster and is simpler to compute by hand; ADX is smoother and slower. I use the ratio for the daily gate and ADX as a slower confirmation.
Does it work on gold and indices as well as forex pairs?
Yes, with the same thresholds as a starting point, but re-check them: gold’s larger ranges and indices’ gap behaviour can push readings around, so I paper-trade any new market for two weeks before trusting the 0.60 gate on it.
What if the ratio is high but my trade still loses?
That is normal and expected — a clean trend still reverses, and a pullback entry still fails roughly a third of the time in my own log. The ratio improves the odds and keeps you out of chop; it does not remove losing trades, and no filter should be sized as if it did.
Risk disclaimer: Trading on a funded account involves substantial risk of loss, including the loss of challenge fees and funded status. The efficiency ratio is a regime filter, not a guarantee of profit, and past performance of any filter does not predict future results. Always size trades within your firm’s daily loss limit and never risk money you cannot afford to lose.


