I bought the breakout at 1.2735 on a Tuesday morning, proud of how fast I had acted. GBPUSD had coiled through the London morning inside a tight range, then one hourly candle pushed cleanly above the mother bar high at 1.2730. Range, coil, break, go: that was the signal I had been taught to take. I entered long with my stop 45 pips below at 1.2690 and waited for the run. It never came. Price drifted back inside within the hour, closed at 1.2705, then broke down through the bottom of the range while I told myself it was just a pullback. My stop went for about 460 dollars, and the pair fell another 120 pips without me. I had not traded a breakout. I had traded the bait, and the market had used my entry to fuel the real move.
In this article
- What a fakey actually is, and what it is not
- The five rules I check before I call it a fakey
- Entry, stop loss and targets: the exact setup
- Position sizing under a 5,000-dollar daily limit
- I tested it: 25 fakeys from my journal
- Five real trades, trade by trade
- When the fakey fails, and my daily routine
- Frequently asked questions
The pattern that trapped me has a name, and once I learned it, I stopped being the trader it feeds on. It is called a fakey: an inside bar, a false breakout from that inside bar, and then a close back inside the mother bar range. The breakout buyers and sellers who jumped in get trapped, their stops become fuel, and price often runs hard the other way. On a funded account that sequence matters more than it does anywhere else, because a false breakout is exactly the kind of trade that eats a daily loss limit in one careless entry. This guide gives you the full fakey plan I use now: the five rules, the exact entry, stop and target rules, sizing under a 5,000-dollar daily loss limit, a 25-signal journal test, and five real trades.
Everything here runs on one account model: a 100,000-dollar funded account, a 5,000-dollar daily loss limit set by the firm, a personal daily stop of 2,500 dollars, and a maximum risk of 500 dollars per trade. On a different size, keep the percentages: 0.5 percent risk per trade, never more than half the daily limit lost in one day.
What a fakey actually is, and what it is not
A fakey always starts with an inside bar pattern: no inside bar, no fakey. The mother bar is a large candle that sets the range, and the inside bar that follows must sit completely inside it, high below the mother high and low above the mother low. That quiet candle is the market pausing, the same starting point as the inside bar strategy I already trade. The fakey is what happens next, when the pause ends in a lie.
Price breaks out of the inside bar range, usually beyond the mother bar extreme as well, and breakout traders pile in. Then, instead of continuing, price reverses and closes back inside. That close back inside is the whole pattern. The breakout traders are now trapped on the wrong side with stops sitting just beyond the extreme they broke through, and when price turns against them, their exits push it further in the opposite direction. The fakey trade is simply to join that second move, the one powered by trapped traders, rather than the first move that trapped them. A dedicated fakey guide at PriceAction.com describes the same sequence — inside bar, false break, close back inside — and notes the false-break bar can itself be a pin bar (PriceAction.com fakey guide).
Three things a fakey is not. It is not every failed breakout: a breakout that drifts back slowly over six candles without a decisive close back inside is just chop, not a trap with fuel behind it. It is not a pin bar on its own, although the false-break bar can be one, and the pin bar reversal rules still apply to reading it. And it is not a reversal signal on its own: a fakey with no level and no trend context is a coin flip dressed up as a pattern.
The five rules I check before I call it a fakey
I do not trade a fakey unless all five checks pass. Missing one does not make the pattern slightly worse; in my journal it makes it a different, losing pattern, as the test numbers below show.
| Check | What must be true | Fail means |
|---|---|---|
| 1. A real mother bar | One clear candle sets the range, at least 25 pips tall on H1 | Skip: a tiny range is noise, not stored energy |
| 2. A true inside bar | Next candle’s high and low sit fully inside the mother bar | Skip: no inside bar, no fakey, no exceptions |
| 3. A genuine false break | Price pushes beyond the mother bar extreme on one side | Skip: a break of the inside bar only is too weak |
| 4. A close back inside | A candle closes back inside the mother bar range within two bars of the break | Skip: a wick that dips back is not a close |
| 5. A trigger within three bars | Price breaks the opposite inside bar extreme within three bars of the close back inside | Drop the setup: stale patterns stop working |
Check four is the one most traders skip, and it is the one that costs the most money. A wick that pokes out and retreats tells you nothing. A full candle close back inside tells you the breakout buyers actually lost control of the close. That distinction separated the winning half of my journal test from the losing half, and it is now a hard rule: no close back inside, no trade.
Entry, stop loss and targets: the exact setup
Once the five checks pass, the trade is mechanical. For a bearish fakey, false break up and close back inside, I place a sell stop just below the inside bar low, two pips beneath it. For a bullish fakey, the mirror image: a buy stop just above the inside bar high. I enter on the inside bar extreme, not the mother bar extreme, because it is closer, which keeps the stop smaller and the size larger for the same dollar risk. If price never breaks the inside extreme within three bars, the setup expires and I cancel the order.
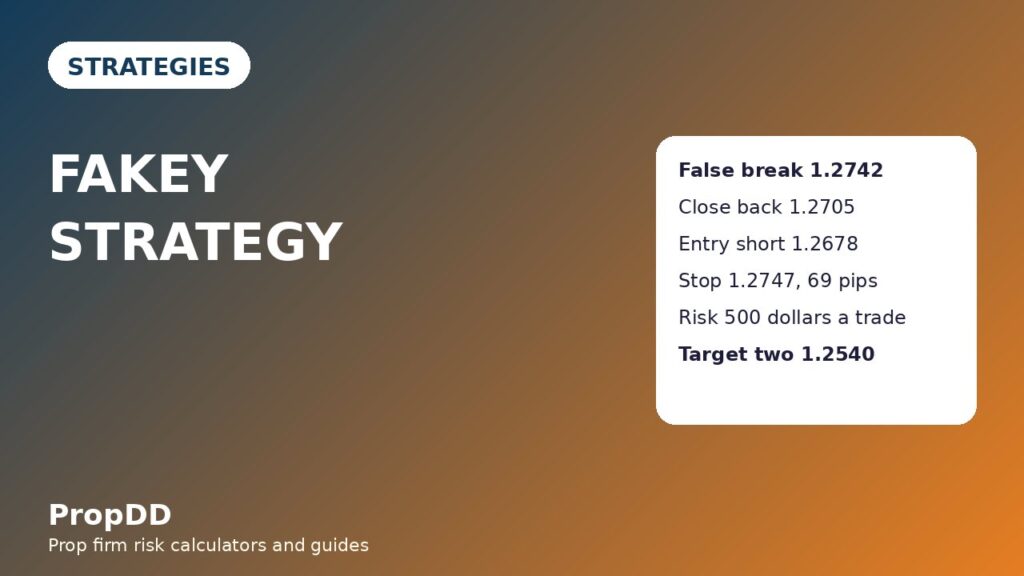
The stop goes beyond the false-break extreme, plus a five-pip buffer. In the worked example below, the false break reached 1.2742, so the stop sits at 1.2747. That level proves the idea wrong: if price takes out the false-break high, the trapped traders were not trapped after all. I never widen this stop mid-trade. Widening a fakey stop turns a defined trap trade into a hope trade, and hope trades are how funded accounts breach daily limits.
Targets are split, because fakeys often run fast and then retrace hard. I take half at one times risk, move the stop to breakeven, and let the rest run to two times risk. If price stalls and pulls back to breakeven, I walk away with half a win and no loss, a fine outcome on a funded account. I never hold a fakey through a major news release: the volatility that creates the pattern can erase it in one print.
Position sizing under a 5,000-dollar daily limit
The sizing formula is the same one I use for every strategy, and it is the only formula in this article you need to memorise:
Position size in lots = Dollar risk / (Stop distance in pips x Pip value per lot). For GBPUSD and EURUSD, one standard lot is worth 10 dollars per pip, so the maths is simple.
Worked example, the bearish fakey from the next section: entry 1.2678, stop 1.2747, a 69-pip stop, risk capped at 500 dollars. Lots = 500 / (69 x 10) = 0.72 lots, for an actual risk of 496.80 dollars, just under the cap. Target one at one times risk sits at 1.2609 and pays 500 dollars; target two at two times risk sits at 1.2540 and pays 1,000 dollars. One trade can never cost more than 500 dollars, 10 percent of my personal daily stop, so even five straight losses leave the day intact.
| Stop distance | Lots at 500-dollar risk | Actual risk | Target two pays |
|---|---|---|---|
| 40 pips | 1.25 | 500 dollars | 1,000 dollars |
| 55 pips | 0.91 | 500 dollars | 1,000 dollars |
| 69 pips | 0.72 | 497 dollars | 1,000 dollars |
| 85 pips | 0.59 | 502 dollars | 1,000 dollars |
| 110 pips | 0.45 | 495 dollars | 1,000 dollars |
Two sizing traps to avoid. First, never size from the mother bar range instead of the stop distance: the mother bar is wider than the stop, so sizing from it leaves you oversized when the stop triggers. Second, never round up to a whole lot for tidiness: rounding 0.72 lots up to 1 lot turns a 500-dollar risk into a 690-dollar risk. Round down, always. The maximum daily drawdown calculator is the tool I use to check the day as a whole: two 500-dollar losses plus a breakeven trade still leaves 1,500 dollars of my personal daily stop untouched, and that headroom is what keeps a bad morning from becoming a breached account.
I tested it: 25 fakeys from my journal
I pulled every fakey-shaped setup from my journal over a three-month stretch and split them by whether they passed my five rules and traded in a liquid session. Published testing of the plain inside-bar false breakout has found it roughly break-even before filters, and my numbers agree: the raw pattern is nothing special. The edge lives entirely in the filters.
| Group | Trades | Wins and losses | Net result |
|---|---|---|---|
| Valid fakey, London or New York session | 12 | 8 wins averaging 1.6R, 4 losses at 1R | Plus 8.8R |
| Wick-only break, no close back inside | 8 | 2 wins averaging 1.1R, 6 losses at 1R | Minus 3.8R |
| Valid pattern, Asian session only | 5 | 1 win at 1.4R, 4 losses at 1R | Minus 2.6R |
| All 25 signals combined | 25 | 11 wins, 14 losses | Plus 2.4R |
Read that table the right way round. The unfiltered pattern made just 2.4R across 25 trades, barely worth the screen time. The filtered version, valid pattern plus a liquid session, made 8.8R across 12 trades, while the two rejected groups lost money. That is why the checklist is not decoration: trading every shape that looks like a fakey would have handed back most of the profit. I ran the filtered numbers through the strategy expectancy calculator: a 67 percent win rate at an average win of 1.6R gives an expectancy of about 0.73R per trade, roughly 365 dollars of expected value per valid fakey on 500-dollar risk. Expectancy is not a promise, and 12 trades is a small sample, but it is the difference between a rule I can defend and a feeling I cannot.
Five real trades, trade by trade
These are five consecutive fakey trades from the journal period, wins and losses included, all sized at 500 dollars of risk. The first trade is the worked example from the sizing section, shown in full so every number can be checked.
| Trade | Setup | Entry, stop and target | Result |
|---|---|---|---|
| 1. GBPUSD short | Mother bar 1.2660 to 1.2730, inside bar 1.2680 to 1.2710, false break to 1.2742, close back at 1.2705 | Entry 1.2678, stop 1.2747 (69 pips, 0.72 lots), target two 1.2540 | Plus 2R, plus 1,000 dollars |
| 2. EURUSD long | Mother bar 1.0840 to 1.0900, inside bar 1.0855 to 1.0885, false break to 1.0832, close back at 1.0860 | Entry 1.0887, stop 1.0827 (60 pips, 0.83 lots), target two 1.1007 | Plus 2R, plus 1,000 dollars |
| 3. EURUSD short | Valid fakey, then price reversed again and took out the false-break extreme: a double fakey | Entry short, stop beyond the false-break high, 0.71 lots | Minus 1R, minus 500 dollars |
| 4. GBPUSD long | Valid fakey into London open, reached target one, then retraced to the breakeven stop | Half closed at 1R, rest stopped at entry | Breakeven, 0 dollars |
| 5. EURUSD long | Valid fakey at a daily support level, reached target one, trailed stop hit at 1R | Half at 1R, rest trailed out at 1R | Plus 1R, plus 500 dollars |
The five trades net plus 2,000 dollars: three wins, one loss and one breakeven. Trade three is the important one: the pattern fired correctly, the close back inside was genuine, and price still reversed a second time and stopped me out. That double fakey is not a failure of discipline; it is the cost of the strategy, priced into the 500-dollar risk from the start. Trade four is the reason for the split target: without taking half at one times risk, it would have been a full loss instead of a breakeven.
When the fakey fails, and my daily routine
Fakeys fail in four repeatable ways, each with a rule attached. The double fakey is handled by the fixed stop and the refusal to re-enter the same pattern twice in one day. News-spike fakeys are handled by the session filter: no new fakey within 30 minutes either side of a high-impact release on the traded pair. Counter-trend fakeys with no level behind them fail for lack of trapped-trader fuel, so I only take those at a daily support or resistance level. And fakeys on tiny mother bars fail because a 15-pip range on H1 contains no stored energy, which is why the 25-pip minimum exists.
Consistency rules shape the routine as much as the pattern does. Most firms flag a payout when a single day dominates total profits, so stacking three fakey winners into one afternoon is a payout risk even when the trades are good. My routine caps the day at two fakeys, stops the day after two losses, and treats one 2R winner as a finished day. That discipline keeps the strategy inside the consistency rule in my position sizing guide: small, repeatable wins spread across days, never one heroic day carrying the period.
| Session window | Fakey rule | Why |
|---|---|---|
| Asian session | Watch only, no new entries | Thin ranges produce wick-only breaks that fail |
| London open, 08:00 to 10:00 GMT | Trade valid fakeys | Real volume confirms or kills the trap quickly |
| London and New York overlap, 13:00 to 16:00 GMT | Best window, first choice | Deepest liquidity, cleanest closes back inside |
| After 17:00 GMT | No new entries | Volume fades and ranges chop both directions |
| 30 minutes around high-impact news | Skip every fakey | News spikes fake the false break itself |
One last distinction: the bear flag strategy trades continuation after a pole and a flag, while the fakey trades the failure of a breakout. They look similar at a glance, a pause followed by a sharp move, but the entry logic is opposite. A flag trader buys the breakout; a fakey trader waits for that breakout to fail and trades against it. Mixing the two up is how traders end up holding the exact position the trap was built to punish.
Frequently asked questions
Is a fakey the same thing as an inside bar trade?
No. An inside bar trade usually takes the breakout of the inside bar range in either direction. A fakey takes the opposite side after that breakout has failed and price has closed back inside the mother bar. The inside bar is only the starting ingredient, not the trade itself.
How many inside bars can there be before the false break?
One is normal, two or three is fine, and more than three usually means the range is going stale. The close back inside and the opposite break must still happen within the checklist bar limits, or the setup is dropped.
Does the false break have to close outside the mother bar?
No, it has to push beyond the mother bar extreme, but the candle itself can close back inside. A false-break bar that closes back inside is already halfway to a valid fakey.
Can I trade fakeys on the 15-minute chart?
You can, but my journal says the failure rate climbs sharply below H1, because intraday noise creates far more wick-only breaks. If you do, keep the same five rules, halve the risk, and only trade the London and New York overlap.
What do I do when price breaks both sides?
That is a double fakey: take the first stop, do not re-enter the same pattern the same day, and log it as a normal loss. Chasing the second break is how one 500-dollar loss becomes a 1,500-dollar day.
Does a fakey work in trends, ranges, or both?
Both, with different filters. With-trend fakeys work anywhere the five rules pass. Counter-trend fakeys need a daily support or resistance level behind them, or there are not enough trapped traders to fuel the reversal.
Risk disclaimer: This article describes my own funded-account routine for education only. Trading leveraged forex involves substantial risk, and past journal results do not predict future results. Never trade a pattern with money you cannot afford to lose, and always check your firm’s current rules before trading any strategy on a live or funded account.



1 comment
[…] is the price-action strategy in the series beside the engulfing pattern strategy, the fakey strategy and the Judas swing strategy. If you already trade engulfing patterns, this article will show you […]