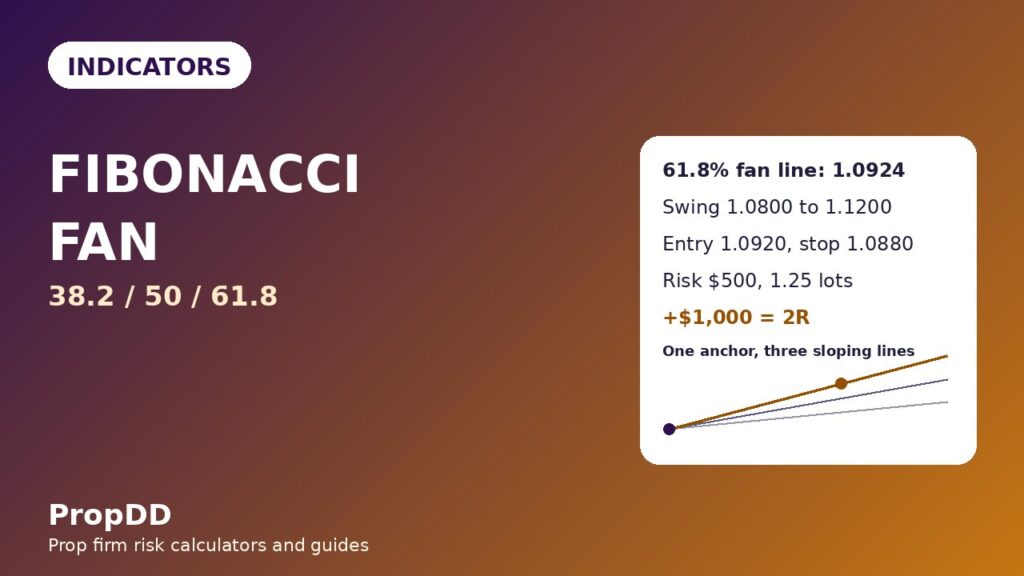
I lost $500 on a perfect Fibonacci retracement level. EURUSD had pulled back to the 61.8% line, the level every textbook calls the golden ratio, and I bought it with a tight stop and full confidence. Price sliced straight through, took my stop, and then bounced 30 pips higher from a line I had never drawn. That line was a Fibonacci fan line, sitting on the diagonal path price was actually travelling.
In this article
- What a Fibonacci fan actually is
- How to draw a Fibonacci fan in thirty seconds
- The best Fibonacci fan settings for a funded account
- How to read the fan lines: bounce, break and retest
- My worked trade: the 61.8 fan line that paid two R
- Fan versus retracement versus trendline: which one earns its place
- The five mistakes that cost me money on fans
- My weekly fan routine
- Frequently asked questions
I trade a $100,000 funded account with a $5,000 daily loss limit and a 10% maximum drawdown. The fan has been on my charts ever since, because it does a job no horizontal level can do: it tells me where support and resistance will be tomorrow, not just where they were yesterday.
What a Fibonacci fan actually is
A Fibonacci fan is three diagonal lines drawn from a single anchor point, spaced apart by Fibonacci ratios. You pick one swing, low to high in an uptrend, and the fan projects forward from the start of that swing. The three lines cross an invisible vertical line at the far end of the swing at 38.2%, 50% and 61.8% of the swing’s height. Babypips defines Fibonacci fans as trendlines plotted from a single point and spaced by Fibonacci ratios, used to predict future support and resistance. Where a retracement gives you flat levels that never move, the fan gives you sloping lines that rise or fall with time, which is exactly how a pullback behaves: it does not retrace to a fixed price, it slides down a slope.
A horizontal 61.8% level says price should find support at 1.0953 and stay there. But if the pullback takes three days instead of three hours, the level is stale. The 61.8% fan line says support is a moving target: 1.0924 today, 1.0953 in two days, 1.0980 next week. The fan respects time. A pullback is a move through time as well as price, and a level that ignores time is a level that gets run over.
How to draw a Fibonacci fan in thirty seconds
Every platform I have used, MT5 included, has a Fibonacci fan tool next to the retracement tool. Find a clean swing on H4 or daily: a low and a high with at least 150 pips between them on EURUSD, and no news spike in the middle. Click the swing low, then the swing high, and the tool fans three rays out from the low. Check the rays actually touch price: lines floating in empty space mean the wrong swing.
Take the swing from 1.0800 to 1.1200, a 400-pip move. The vertical line at the high runs from 1.0800 to 1.1200, and the fan lines cross it at 38.2%, 50% and 61.8%: 1.0953, 1.1000 and 1.1047. Those crossing points are fixed. What moves is where each line sits on any given bar, because each line runs from the anchor at 1.0800 to its crossing point. The swing took 40 H4 bars, and the pullback touched the fan 20 bars after the low, halfway along. Traders who read the crossing price instead of the line price buy 120 pips too high and wonder why the fan never works. Never redraw the fan after every wick either: the anchor is the swing low, and it does not change because price poked 5 pips lower for one bar. I redraw only when a new swing forms on the daily chart.
| Fan line | Crossing at the vertical | Price at the pullback bar | Role |
|---|---|---|---|
| 38.2% line | 1.0953 | 1.0876 | Shallow support |
| 50% line | 1.1000 | 1.0900 | Balance line |
| 61.8% line | 1.1047 | 1.0924 | Main entry line |
| Step | Formula | Worked number |
|---|---|---|
| 1. Swing height | High minus low | 1.1200 − 1.0800 = 0.0400, or 400 pips |
| 2. Line at the vertical | Low plus ratio times height | 61.8%: 1.0800 + 0.618 × 0.0400 = 1.1047 |
| 3. Line price at any bar | Anchor plus ratio times height times elapsed over total bars | Bar 20 of 40: 1.0800 + 0.618 × 0.0400 × 0.5 = 1.0924 |
| 4. Position size | Risk divided by stop distance per lot | 500 ÷ (40 pips × 10 dollars) = 1.25 lots |
The best Fibonacci fan settings for a funded account
The fan has no period setting like RSI or MACD, so the settings are choices: which swing, which ratios, which timeframe, and which confirmation.
I draw fans on H4 and daily swings only. A fan drawn on M15 looks precise and fails constantly, because the swings are noise and the lines get crossed by every London open wick. On H4, a 400-pip swing takes about a week to form and I get two or three clean touches a month per pair. I trade the H4 fan and use the daily fan as the filter: if the daily 61.8% line sits above my H4 entry, I skip the trade.
I use 38.2%, 50% and 61.8% and nothing else. The 23.6% line sits so close to the anchor that price touches it on every minor dip, and a line that signals everything signals nothing. I leave off the 78.6% line too: if price has retraced that far, the trend is probably dead. The minimum swing matters as well: at least 150 pips on EURUSD, 300 on daily. A 60-pip swing produces lines so close together that a normal spread crosses all three at once.
| Setting | My value | Why |
|---|---|---|
| Anchor timeframe | H4, daily filter | M15 fans are noise |
| Minimum swing | 150 pips H4, 300 daily | Small swings give unusable stops |
| Ratios | 38.2%, 50%, 61.8% | 23.6% signals everything; 78.6% means trend dead |
| Risk per trade | $500, or 0.5% | Ten losers still leaves the daily limit intact |
| Max fan trades | Two per day | Stops revenge-chasing |
| Session filter | London and New York only | Asian touches fake out twice as often |
| News filter | No entries near red news | A fan line cannot hold through a CPI spike |
How to read the fan lines: bounce, break and retest
A fan line gives you three signals, and only the first and third are trades. The bounce is the classic one: price falls to a fan line, prints an engulfing candle or a pin bar with its low on the line, and the next candle closes higher. That is my entry. I enter on the close of the confirmation candle, never on the touch itself, because a touch with no confirmation is just price passing through.
The break is the second signal, and it is a warning, not an entry. When a candle closes through the 61.8% fan line, the pullback has gone too deep and the trend is in doubt. I do not short the break, because breaks through fan lines fail as often as they hold. I stand aside, delete the fan, and wait for a new swing.
The retest is the third signal and the best one. After price breaks a fan line and comes back to it, the old support becomes new resistance, and a rejection there is a clean short with a stop just above the line. This is the same logic as my trend pullback rules, only the line is diagonal instead of horizontal. I take retests only on the 50% and 61.8% lines, because the 38.2% line gets retested by noise all day long.
Confluence is what turns a fan touch into a trade I actually size. A touch on the 61.8% fan line that also lands on a horizontal Fibonacci retracement level and a round number is a different trade from a touch in empty space. My rule is two out of three: fan line plus one other factor, either a retracement level, a round number, or a previous swing high or low. A lone fan touch gets a quarter of my normal risk or no trade at all. A fan line alone is a suggestion. A fan line with confluence is a setup.
My worked trade: the 61.8 fan line that paid two R
The trade happened on EURUSD in late October. The H4 swing ran from 1.0800 to 1.1200, a clean 400-pip rise with no news spike in the middle. Price topped, rolled over, and fell for six sessions. The 38.2% line got touched and ignored, with no confirmation and no confluence. The 50% line held for one bar, then failed. Then price reached the 61.8% fan line at 1.0924, with the daily fan’s 38.2% line just below it as a second layer of support.
The confirmation came as a bullish engulfing candle that closed at 1.0935, its low kissing the fan line at 1.0924. I entered long at 1.0920, stop at 1.0880, forty pips below entry and below the fan line with a small buffer. My risk was $500, so the size was 1.25 lots: 40 pips times $10 per pip per lot is $400 per lot, and $500 divided by $400 is 1.25. The target was 1.1000, the 50% retracement of the whole swing, eighty pips above entry. Before I clicked buy I checked the size against the maximum drawdown calculator, because a stop-out here plus the two losers I already had that day would have put me at $1,500 of the $5,000 daily limit.
| Trade detail | Value |
|---|---|
| Pair and timeframe | EURUSD, H4 fan, daily filter |
| Swing | 1.0800 to 1.1200, 400 pips, 40 H4 bars |
| Entry line | 61.8% fan line at 1.0924, engulfing close |
| Entry price | 1.0920 |
| Stop loss | 1.0880, 40 pips, below the line |
| Position size | 1.25 lots, risk $500 |
| Take profit | 1.1000, 80 pips, the 50% retracement |
| Result | Hit next session, plus $1,000, or 2R |
| Daily limit used | $500 of $5,000 if it loses |
The target hit the next session and banked $1,000, exactly 2R. The number that matters more is the consistency one. My best day that fortnight was that $1,000 day, and the fortnight netted $3,500 across ten fan trades, seven wins and three losses, so the best day was 28.6% of the total, inside the 30% ceiling in my consistency rule guide. If I had taken the same trade at twice the size, the best day would have been $2,000 out of a $4,500 fortnight, or 44%, and the firm would have flagged the account even though I was profitable. On a funded account, a winning trade at the wrong size is still a losing trade.
Fan versus retracement versus trendline: which one earns its place
I use all three tools, but they do different jobs. The retracement is best in a slow, grinding pullback, where price drifts down and the levels act like shelves. The trendline is best in a clean, steep trend, where two swing points define the slope and the third touch is the trade. The fan is best in a pullback that moves through time, where the support level needs to rise as the days pass.
The honest comparison is that the fan is the hardest of the three to draw well and the easiest to draw badly. A retracement needs two clicks and cannot be drawn wrong. A fan needs the right swing, and the wrong swing gives you lines that look beautiful and mean nothing. That is why I only draw fans on H4 and daily, and only on swings with no news spike in the middle. If I could only keep one of the three, I would keep the fan, because it is the only one that tells me where support will be on Thursday when I am planning on Monday. The retracement tells me where support was.
The five mistakes that cost me money on fans
The first mistake is drawing the fan on the wrong swing. A swing with a news spike in the middle, or two swings joined by a consolidation, gives you lines that price ignores completely. I lost $500 twice to this before I made the minimum-swing rule.
The second mistake is entering on the touch instead of the confirmation candle. A fan line gets touched a dozen times a week, and half of those touches are just price passing through. The engulfing candle is the market telling you buyers showed up. Without it you are guessing, and guessing with a $500 risk is how evaluations end early.
The third mistake is redrawing the fan after every wick. I did this for a month, chasing the lines around the chart until every touch looked like a signal. The fix was a rule I now keep taped to my monitor: the anchor only moves when a new daily swing forms. A tool you redraw until it agrees with you is not a tool, it is a mirror.
The fourth mistake is trading the fan in a range. Fans are trend tools. In a sideways market the lines cross price constantly and every touch looks like a signal. My filter is simple: if the daily chart has no clear swing, there is no fan and no trade.
The fifth mistake is ignoring the session. A fan touch at 03:00 in the Asian session, on thin volume, fails twice as often as the same touch at 10:00 in London. My own log says it: my Asian-session fan trades won 31% of the time, my London-session ones 58%. Same lines, same rules, different liquidity. Now I only take fan trades in London and New York.
My weekly fan routine
Sunday evening is fan night. I open EURUSD, GBPUSD and XAUUSD on the daily chart, find the current swing on each, and draw the fans. Then I drop to H4, draw the working fans, and write down the three fan-line prices for the coming week. That note is my plan. If price never reaches a line, there is no trade, and that is a good week, not a wasted one.
During the week I check the fans twice a day, at the London open and the New York open, and never in between. Checking every fifteen minutes is how you talk yourself into a touch with no confirmation. At each check I ask three questions: has price touched a line, is there a confirmation candle, and is there confluence? Two yeses is a trade at half risk, three yeses full risk, one yes a note in the journal. I also keep my personal daily stop in mind: two losing fan trades in a day and I am done.
| Day | Routine | Time |
|---|---|---|
| Sunday | Draw daily and H4 fans; note the three line prices | Evening, 30 minutes |
| Monday to Friday | Check fans at London and New York open only | Two 10-minute checks |
| On a touch | Wait for confirmation, check confluence, size from the stop | Before entry, every time |
| After a loss | One trade left; two losses and I stop | Immediate |
| Friday close | Log touches, trades, win rate by session | 20 minutes |
Frequently asked questions
What is a Fibonacci fan in trading?
A Fibonacci fan is three diagonal lines drawn from one anchor point on a swing, spaced by the 38.2%, 50% and 61.8% ratios. The lines project forward in time, showing where support and resistance will be on future bars.
Is the Fibonacci fan better than Fibonacci retracement?
Neither is better in general. Retracement suits slow, horizontal pullbacks where the levels act like shelves. The fan suits pullbacks that move through time, because its lines rise or fall with the trend.
Which timeframe works best for Fibonacci fans on a funded account?
H4 for the working fan and daily as the filter. M15 fans fail constantly because the swings are noise. A fan needs a swing of at least 150 pips on H4 or 300 pips on daily, otherwise the stop is too small to size safely.
What is the best Fibonacci fan setting?
There is no period setting, so the settings are choices: H4 and daily swings, the 38.2%, 50% and 61.8% ratios only, a minimum 150-pip swing, 0.5% risk per trade, two fan trades a day at most, London and New York sessions only, and no entries within 30 minutes of red-folder news.
Can I trade every touch of a fan line?
No. A touch without a confirmation candle is just price passing through, and a touch with no confluence is a weak setup. I wait for an engulfing candle closing off the line, plus one other factor such as a retracement level or a round number.
Does the Fibonacci fan work on gold and indices?
Yes, with wider stops. Gold moves faster than EURUSD, so the minimum swing is bigger and the stop wider, which means a smaller position for the same $500 risk. The fan works on any market with clean swings; it fails in a range, whatever the symbol.
Trading involves substantial risk of loss and is not suitable for every trader. This article is educational content based on my own funded-account experience, not financial advice. Never risk money you cannot afford to lose.




2 comments
[…] Fibonacci fan […]
[…] Fibonacci fan […]