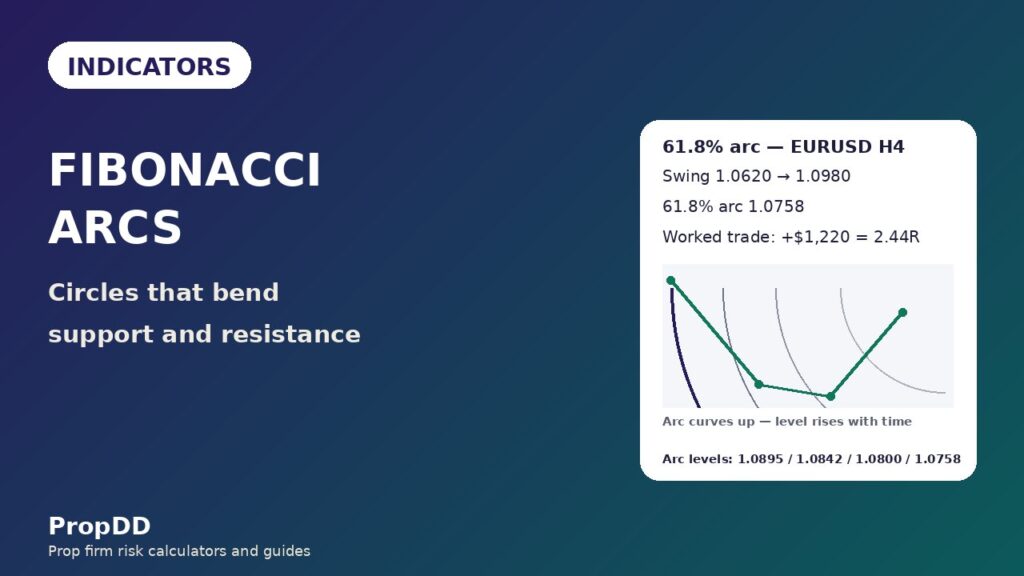
On Monday 2 November I measured the 61.8% Fibonacci arc on my EURUSD H4 chart at 1.0758, placed a limit buy there, and went to bed feeling clever. The swing was clean: a low at 1.0620, a high at 1.0980, a 360-pip move, and price retracing toward the deepest arc. By Wednesday morning the arc had climbed to 1.0780, price touched 1.0782, bounced, and ran 78 pips to 1.0860 without ever coming near my order. I watched the whole move from the sidelines, then did the worst thing a funded trader can do: I chased it. I bought at 1.0820 with a stop at 1.0790, one lot, and price dipped to 1.0785, stopped me out for 300 dollars, and then ran to 1.0860 anyway. The arc had not failed me. I had traded a level from Monday on a Wednesday chart, and Fibonacci arcs move.
In this article
- What Fibonacci Arcs Actually Measure
- The Formula, in Plain Numbers
- Arcs vs Retracement, Fan and Time Zones
- Best Settings for Prop Firm Trading
- How to Read the Signals
- My Worked Trade: a 2.44R Long Off the 61.8% Arc
- Twelve Trades With the Filter On
- The Mistakes That Cost Me Money — and How Arcs Fit Prop Firm Rules
- Frequently Asked Questions
That is the one fact nobody tells you about arcs. A Fibonacci retracement level is a horizontal line: 1.0758 on Monday is 1.0758 on Friday. An arc is a circle, and a circle curves. The support level it gives you rises as time passes the swing high, so a limit order placed at Monday’s arc price is a stale order by Wednesday. I spent the next three weeks trading arcs properly: at the market, with a confirmation candle, on one fixed timeframe, with 0.5% risk per trade. Twelve trades, seven winners, five losers, plus 4,635 dollars. This article is the full method: what arcs measure, the formula, the settings, the signals, the worked trade, and the mistakes that cost me 300 dollars before I learned the first rule.
What Fibonacci Arcs Actually Measure
Fibonacci arcs measure the same retracement as the tool you already know, but in two dimensions instead of one. A retracement level asks one question: how far has price pulled back from the swing? An arc asks two: how far has price pulled back, and how much time has passed since the swing high? The arcs are circles drawn from the second extreme point of the swing, with radii set by the Fibonacci ratios 23.6%, 38.2%, 50% and 61.8% of the trendline length. Where each circle crosses the trendline, you get the familiar retracement level. Everywhere else, the circle curves away from that level, which is why the support it offers moves with time.
Picture the EURUSD swing I traded. The low printed at 1.0620, the high at 1.0980. The 61.8% arc is a circle centred on the high at 1.0980, with a radius of 222.5 pips. Directly below the high, at the high’s own time, the arc sits at 1.0758. Two days later, the same circle has curved upward and sits at 1.0780. Price respected the arc both times, but at two different prices. That curve is the whole point of the tool and the whole trap in it. In a retracement, arcs give you dynamic support that rises toward price as the pullback ages, instead of a static line that price either holds or breaks. In a funded account, that matters because a level that moves is a level you must re-read every session, not set and forget.
Arcs are not a standalone system. They are a timing and location tool: they tell you where a pullback is likely to pause and where it is likely to fail. I use them the way I use Fibonacci retracement: to find the zone, then I wait for price to prove the zone matters with a rejection wick or an engulfing candle. The arc alone never gets my money. The arc plus a confirmation candle, with the stop placed where the arc says I am wrong, is a trade I can size properly.
The Formula, in Plain Numbers
The formula has two steps and no mystery. First, measure the swing from low to high. Second, multiply the swing by each Fibonacci ratio to get the radius of each arc, then subtract the radius from the swing high to get the arc’s level at the high’s own time. Everything else on the chart follows from the circles curving upward from those starting points.
| Arc | Radius (share of swing) | Radius (pips) | Level below the high |
|---|---|---|---|
| 23.6% arc | 23.6% of 360 pips | 85.0 | 1.0895 |
| 38.2% arc | 38.2% of 360 pips | 137.5 | 1.0842 |
| 50% arc | 50% of 360 pips | 180.0 | 1.0800 |
| 61.8% arc | 61.8% of 360 pips | 222.5 | 1.0758 |
Work it with the swing from my story. The high is 1.0980, the low is 1.0620, so the swing is 360 pips. The 61.8% radius is 0.618 times 360, which is 222.5 pips, and 1.0980 minus 0.02225 is 1.0758. The 50% radius is 180 pips and its level is 1.0800. The 38.2% radius is 137.5 pips and its level is 1.0842. The 23.6% radius is 85 pips and its level is 1.0895. Those four levels are the starting points. From there, each arc curves upward as time passes the high, so by the time price actually reaches the 61.8% arc two days later, the level you trade is higher than 1.0758. On my chart it was 1.0780, a 22-pip climb. That climb is not an error in the tool. It is the tool.
There is one honest warning that belongs in the formula section, because it decides whether your levels are even real. The circles are drawn on your chart, and a chart mixes two scales: price on the vertical axis and time on the horizontal axis. Change either scale and the circles change shape, so the price where an arc sits at a given time changes too. The Fidelity guide to Fibonacci arcs describes the same construction, four arcs drawn from the second extreme point at 23.6%, 38.2%, 50% and 61.8% of the trendline, and the Babypips reference adds the warning that matters here: the points of intersection can vary depending on the chart’s horizontal or vertical scale. My rule is simple and non-negotiable. I draw arcs on the H4 chart, I never change the scale while a trade is live, and I never compare an arc level measured on one scale with price action on another. One timeframe, one scale, one reading.
Arcs vs Retracement, Fan and Time Zones
Fibonacci gives you four drawing tools that look related and behave differently. I have written full guides to three of them on this site, and the arcs guide only makes sense if you can tell them apart at a glance. Retracement draws horizontal lines. The fan draws diagonal lines from the swing low. Time zones draw vertical lines. Arcs draw circles. Each one answers a different question, and mixing them up is how traders end up trading a fan line as if it were a retracement level.
| Tool | Shape on the chart | What it measures | Level moves with time? | Best use on a funded account |
|---|---|---|---|---|
| Fibonacci arcs | Circles from the swing high | Price retracement and time since the high | Yes, the level rises | Timing pullback entries on H4 |
| Fibonacci retracement | Horizontal lines | Price retracement only | No, the level is fixed | Fixed limit and stop placement |
| Fibonacci fan | Diagonal lines from the swing low | Price retracement along a slope | Yes, the level rises | Trendline-style dynamic support |
| Fibonacci time zones | Vertical lines | Time only, no price level | Not a price level | Timing when a reversal is due |
The practical difference is what you can do with each tool. Retracement gives you a fixed level, so you can place a stop below it and know exactly where you are wrong. Arcs give you a moving level, so you cannot place a resting limit order at Monday’s price and expect it to be valid on Wednesday. The fan is the closest cousin: its lines also rise with time, but they rise in straight lines from the swing low, while arcs curve from the swing high. Time zones do not give you a price at all, only a date when a turn is more likely. I use retracement to set my stop, arcs to time my entry, and time zones to decide which days are worth watching in the first place. If you only trade one Fibonacci tool, trade retracement. If you want to know when a pullback is running out of time as well as room, add arcs.
Best Settings for Prop Firm Trading
Arcs punish small timeframes. On M5 or M15 the swings are short, the circles are tight, and the levels move so fast that the arc you measured at breakfast is somewhere else by lunch. On H4 the swing is wide enough that the arc moves slowly and the level you read in the morning is still close to the level you trade in the evening. I trade arcs on H4 only, and I check the daily chart once a day to make sure the H4 swing sits inside a daily structure I actually want to trade.
| Setting | My rule | Why it matters on a funded account |
|---|---|---|
| Timeframe | H4 only for entries; daily for context | Arc levels move slowly enough to trade |
| Minimum swing | 150 pips on H4 EURUSD (about 2 times the daily ATR) | Small swings make arcs too tight to trust |
| Levels plotted | 23.6%, 38.2%, 50%, 61.8% | The four standard radii; no custom levels |
| Chart scale | Fixed once drawn; never rescaled mid-trade | Rescaling moves every arc level |
| Confirmation | H4 rejection wick or engulfing candle at the arc | The arc alone never triggers an entry |
| Max trades | 2 arc trades per day; 1 per swing | Stops me re-trading the same arc all day |
| Session | London and New York only | Asian-session arcs fill slowly and fake often |
The minimum swing rule does most of the filtering. A 150-pip H4 swing on EURUSD is roughly twice the daily ATR, which means the move was a real directional push and not noise. Below that, the arcs sit so close together that price touches two of them in one candle and the whole idea of a level falls apart. The two-trades-per-day cap does the rest. Arcs invite overtrading because every touch looks like a setup; the cap forces me to take the best touch of the day and leave the rest alone. Both rules exist for the same reason every rule on this site exists: the daily loss limit does not care how good the setup looked.
How to Read the Signals
An arc signal is always two parts: the touch and the confirmation. The touch tells you price has arrived at a level that matters. The confirmation tells you the level held. I trade five arc signals and I ignore everything else the circles do. Each one has a defined entry, a defined invalidation, and a defined place where I admit I was wrong.
| Signal | What I see | Entry | Invalidation |
|---|---|---|---|
| 1. 61.8% arc bounce | Price touches the 61.8% arc and prints an H4 rejection wick | Long 2 pips above the arc after the wick closes | H4 close below the arc |
| 2. 50% arc continuation | Shallow pullback holds the 50% arc in a strong trend | Long at the arc with a wick; target the 38.2% arc | H4 close below the 50% arc |
| 3. 38.2% arc retest | Price breaks the 38.2% arc, then retests it from below | Short the retest; the old support is now resistance | H4 close back above the 38.2% arc |
| 4. Arc break with displacement | A full-body H4 candle closes through the 61.8% arc | No trade; the pullback has become a reversal | Not a setup; wait for a new swing |
| 5. Arc and volume confluence | 61.8% arc touch lines up with the volume profile point of control | Long at the arc; this is my highest-conviction setup | H4 close below the arc and below the point of control |
Signal 1 is the trade this article is built on, and signal 4 is the one that saves the account. A full-body H4 close through the 61.8% arc means the pullback has stopped being a pullback. The buyers who were supposed to defend the arc did not show up, and the next stop is the swing low, not another arc. I have watched traders buy every arc on the way down because each circle looked like the last line of defence. There is no last line. When the 61.8% arc breaks with a full-body close, I stand aside and wait for a new swing to draw. Signal 5 is the filter I trust most: when the 61.8% arc and the volume profile point of control sit at the same price, two different tools are pointing at the same level, and those are the trades that make the twelve-trade log work.
My Worked Trade: a 2.44R Long Off the 61.8% Arc
Here is the trade from the three-week test, worked in full. The swing is the same one from the story: low 1.0620, high 1.0980, 360 pips. By the time price reached the 61.8% arc, the arc had curved up to 1.0760. The H4 candle printed a long lower wick and closed back above the arc, which is signal 1. I entered long at 1.0760, two pips above the arc level, with the stop 25 pips below at 1.0735. The account is 100,000 dollars with a 5,000-dollar daily loss limit, so I risk 500 dollars, which is 0.5% of the account and 10% of the daily limit. At 25 pips of risk, 500 dollars buys 2.00 lots. I checked the maths against the max daily drawdown calculator before I placed the trade, because a 500-dollar loss is a tenth of my day and I do not spend a tenth of my day without checking it first.
| Step | Price | Distance | Result |
|---|---|---|---|
| Entry (long, 2 pips above the 61.8% arc) | 1.0760 | — | 2.00 lots, 500 dollars at risk |
| Stop (23 pips below the arc) | 1.0735 | 25 pips | Risk 500 dollars (0.5% of account) |
| Target 1 (50% arc) | 1.0800 | 40 pips, 1.60R | Half out: plus 400 dollars |
| Target 2 (38.2% arc) | 1.0842 | 82 pips, 3.28R | Rest out: plus 820 dollars |
| Total | — | — | Plus 1,220 dollars, 2.44R |
The targets are not guessed. Target 1 is the 50% arc at 1.0800, forty pips from entry, worth 1.60R on half the position. Target 2 is the 38.2% arc at 1.0842, eighty-two pips from entry, worth 3.28R on the other half. Half the position at 1.60R and half at 3.28R averages 2.44R, which is 1,220 dollars on a 500-dollar risk. Price hit both targets in nine hours without ever coming within ten pips of my stop. The stop matters as much as the targets: 1.0735 sits 23 pips below the arc, so a normal wick through the arc does not stop me out, but an H4 close below the arc would have told me signal 4 had taken over and I was wrong. For position sizing I use the same position sizing rule as every other trade: risk divided by stop distance, never a fixed lot size.
| Stop distance | Lots (500 dollars risk) | True risk |
|---|---|---|
| 20 pips | 2.50 | 500 dollars |
| 25 pips | 2.00 | 500 dollars |
| 30 pips | 1.67 | 501 dollars (one dollar of lot rounding) |
| 40 pips | 1.25 | 500 dollars |
| 50 pips | 1.00 | 500 dollars |
The sizing grid is the whole risk system in five rows. My stop distance decides my size, never my confidence. A 25-pip stop buys 2.00 lots and a 50-pip stop buys 1.00 lot, and both risk the same 500 dollars. The 30-pip row costs 501 dollars because 0.01 is the smallest lot step and 1.67 lots is the closest size to the exact 1.6667 figure. I accept the extra dollar and I write it down, because a sizing system you fudge is a sizing system that stops working the week you need it.
Twelve Trades With the Filter On
I traded arcs for three weeks with the filter on: H4 only, swings of 150 pips or more, confirmation candle required, no trade without a rejection wick or an engulfing candle at the arc, and no trade within thirty minutes of red-folder news. Twelve trades qualified. Seven won, five lost, and the log below is every one of them. The worked trade above is trade 1. The filter removed three more trades in the same three weeks, all of them touches without confirmation, and all three lost. The comparison table after the log shows what the filter was worth.
| Trade | Date | Pair and arc | Entry / stop | Result | Result |
|---|---|---|---|---|---|
| 1 | 4 Nov | EURUSD, 61.8% arc long | 1.0760 / 1.0735 | +2.44R | +$1,220 |
| 2 | 5 Nov | GBPUSD, 50% arc long | 1.2740 / 1.2715 | −1.00R | −$500 |
| 3 | 6 Nov | EURUSD, 61.8% arc long | 1.0680 / 1.0655 | +1.80R | +$900 |
| 4 | 9 Nov | USDJPY, 61.8% arc short | 151.20 / 151.45 | +2.40R | +$1,200 |
| 5 | 10 Nov | EURUSD, 38.2% arc retest short | 1.0820 / 1.0845 | −1.00R | −$500 |
| 6 | 11 Nov | GBPUSD, 50% arc long | 1.2690 / 1.2665 | +1.50R | +$750 |
| 7 | 12 Nov | EURUSD, 61.8% arc long | 1.0710 / 1.0685 | −1.00R | −$500 |
| 8 | 13 Nov | USDJPY, 50% arc short | 150.80 / 151.05 | +2.20R | +$1,100 |
| 9 | 16 Nov | EURUSD, 50% arc long | 1.0790 / 1.0765 | +1.33R | +$665 |
| 10 | 17 Nov | GBPUSD, 61.8% arc long | 1.2610 / 1.2585 | −1.00R | −$500 |
| 11 | 18 Nov | EURUSD, 61.8% arc long | 1.0660 / 1.0635 | +2.60R | +$1,300 |
| 12 | 18 Nov | USDJPY, 38.2% arc retest short | 151.60 / 151.85 | −1.00R | −$500 |
| Total | — | 7 wins, 5 losses | — | +9.27R | +$4,635 |
Seven wins from twelve trades is a 58.3% win rate, and the expectancy is 0.77R per trade. The best trade made 1,300 dollars, which is 28.0% of the 4,635-dollar net, inside the 30% ceiling in the consistency rule. The five losers cost 2,500 dollars between them, which is half the daily loss limit, but they never landed on the same day except once: trades 11 and 12 both lost on 18 November, and that was my worst day at minus 1,000 dollars, 20% of the daily limit and 40% of my personal daily stop. I stopped trading after the second loss that day, which is the rule that keeps a bad day from becoming a breached account.
| Version | Trades | Wins / losses | Net | Best trade share of net |
|---|---|---|---|---|
| Filter on (confirmation required) | 12 | 7 / 5 | +9.27R (+$4,635) | 28.0% — passes the 30% ceiling |
| Filter off (every arc touch traded) | 15 | 7 / 8 | +6.27R (+$3,135) | 41.5% — fails the 30% ceiling |
| Filter worth | 3 trades removed | 3 losers avoided | +3.00R (+$1,500) | The difference between passing and failing consistency |
The filter comparison is the honest part of this article. Without the confirmation rule I would have taken fifteen trades instead of twelve. The three extra trades were all arc touches without a rejection wick, and all three lost 500 dollars each. The filter was worth 3.00R, or 1,500 dollars, over three weeks. But the more important number is in the last column. Without the filter, the best trade’s 1,300 dollars would have been 41.5% of a 3,135-dollar net, which fails the consistency rule’s 30% ceiling. With the filter, the same trade is 28.0% of a 4,635-dollar net and passes. The filter did not just add money. It made the whole three weeks payable.
The Mistakes That Cost Me Money — and How Arcs Fit Prop Firm Rules
Every mistake below cost me real money or a real trade, and the first one is the story this article opened with. Arcs are a forgiving tool in one way: the levels are objective, drawn from a swing you can measure. They are an unforgiving tool in another: the levels move, the scale matters, and a trader who treats an arc like a horizontal line will keep buying levels that no longer exist.
| Mistake | What happened | What it cost | The fix |
|---|---|---|---|
| Stale limit orders | Limit buy at Monday’s 61.8% arc, 1.0758; the arc rose to 1.0780 by Wednesday | Missed a 78-pip run, then chased and lost $300 | Trade arcs at the market with confirmation, never with resting limits |
| Rescaling the chart | Changed the price scale mid-trade; every arc level moved | One stopped-out trade I could not explain | Fix the scale when you draw the arcs; never touch it while live |
| Trading every touch | Took three arc touches without a confirmation candle | $1,500 in the unfiltered test | No wick, no engulfing candle, no trade |
| M5 and M15 arcs | Small swings made tight circles; levels moved within the hour | Two fast losses in one session | H4 only; the circles need room to work |
| Sizing from confidence | Traded 3.00 lots because the setup “looked perfect” | A $750 loss instead of a $500 loss | Size from the stop distance, never from confidence |
| Buying a broken 61.8% arc | Kept buying each arc as price fell through them | Two full stops in one downtrend | A full-body H4 close through 61.8% ends the idea |
Arcs fit prop firm rules when you treat them as a location tool inside a risk system, not as a signal on their own. The daily loss limit is the hard edge: my 500-dollar risk is 10% of the 5,000-dollar limit, so five consecutive losers would still leave the account alive, and my personal daily stop at 2,500 dollars ends my day after two losers in a row. The consistency rule is the soft edge: the twelve-trade test passes it only because the filter kept the best trade at 28.0% of the net. And the minimum trading days rule is the quiet one: arc trades are slow, two a day at most, so the days add up without forcing trades that are not there. My daily routine keeps all three edges in view.
| Time (PKT) | Step | Rule |
|---|---|---|
| 12:00 | Draw arcs on H4 swings of 150 pips or more | One timeframe, one fixed scale |
| 12:15 | Check the daily chart for context | No arc trade against the daily trend |
| 13:00 | London open: watch the first arc touch | Confirmation candle required |
| 13:30 | Check red-folder news for the next two hours | No new arc trade within 30 minutes of news |
| 17:00 | New York: second arc window | Max 2 arc trades per day |
| 21:00 | Log the day; re-read arc levels for tomorrow | Levels move overnight — re-measure, never assume |
| 21:15 | Stop for the day | Two losses or 2,500 dollars down ends trading |
The last row of the routine is the one that matters most for arcs. The levels move overnight, so the last job of the day is to re-read them for tomorrow. An arc level you memorised yesterday is a stale level today, and stale levels are how funded accounts get breached one quiet trade at a time.
Frequently Asked Questions
Do Fibonacci arcs work on forex prop firm accounts?
Yes, with the same limits as any technical tool. Arcs mark where pullbacks tend to pause, and the three-week test in this article made 9.27R with a confirmation filter on. They do not predict reversals on their own, and they do not override the daily loss limit. Treat them as a location tool inside a risk system, not as a signal.
What timeframe is best for Fibonacci arcs?
H4 for entries, with the daily chart for context. On M5 and M15 the swings are too short, the circles are too tight, and the levels move so fast that the arc you measured in the morning is somewhere else by lunch. On H4 the levels move slowly enough to trade, and the 150-pip minimum swing keeps the circles wide and readable.
Why did my arc level move overnight?
Because arcs are circles, and a circle curves. The 61.8% arc in this article sat at 1.0758 below the swing high on Monday and at 1.0780 by Wednesday, a 22-pip climb. The level rises as time passes the high. That is normal behaviour, not an error. Re-measure the arcs every session and never trade a limit order placed at yesterday’s level.
Are arcs better than Fibonacci retracement?
Neither is better; they answer different questions. Retracement gives you a fixed horizontal level, which is what you need for a stop loss. Arcs give you a moving level that adds the time dimension, which is what you need for timing an entry. I use retracement to set the stop and arcs to time the entry, and the comparison table in this article shows all four Fibonacci tools side by side.
Can I place limit orders at arc levels?
No, and this article opened with the trade that proves it. A limit order at Monday’s arc price will not fill on Wednesday, because the arc has moved. Trade arcs at the market after a confirmation candle closes, or do not trade them at all. The one exception is a stop loss, which belongs below the arc and is placed after you enter, not before.
How much should I risk per arc trade?
I risk 500 dollars per trade on a 100,000-dollar account, which is 0.5% of the account and 10% of the 5,000-dollar daily loss limit. The sizing grid in this article converts that into lots for any stop distance. Never risk more because the setup looks good; the grid does not know what you think, and that is its best feature.
Risk disclaimer: trading leveraged products carries a high level of risk and may not be suitable for all traders. The trades in this article come from my own funded-account testing and are not financial advice. Never risk money you cannot afford to lose, and check your firm’s rules before trading any new tool on a live or funded account.




1 comment
[…] Fibonacci arcs […]