I blew up my second $100,000 evaluation on a Tuesday that looked perfect. EURUSD had rallied 120 pips into the London open, my entry rules fired three clean signals, and I took all three — 0.5% risk each, textbook entries, stops behind structure. By the New York open I was down $1,840, all three trades stopped out, and the pair had gone exactly nowhere: it ended the day eleven pips from where it started. My entries were fine. The market simply was not trending. A month later I replayed that Tuesday with one extra line on the chart — the 14-period Average Directional Index. It had printed 14.2 at my first entry, 13.6 at my second, 12.9 at my third. The market had been screaming “there is no trend here” in a number I had never bothered to read, and I had traded three trend entries into a dead range.
In this article
- What ADX actually measures (and the one thing it never tells you)
- The ADX formula, worked by hand on a real GBPUSD day
- Best ADX settings for prop firm trading
- How I read ADX signals: my four rules
- My worked week: eight trades under a ,500 personal stop
- Five mistakes that nearly cost me the account
- How ADX fits prop firm rules: daily loss, consistency, news
- Frequently asked questions
That is what ADX is: not a buy/sell indicator, but a bouncer for your signals. ADX answers one question — how strong is the trend right now — and it answers it with a number between 0 and 100. It never tells you direction; the +DI and -DI lines do that. On a prop firm account, where the daily loss limit punishes chop-trading more brutally than any bad entry, that one number is the cheapest insurance I own. This guide is the full treatment: what ADX measures, the formula worked by hand on a real GBPUSD day, the settings I actually use on funded accounts, my four-rule signal filter, an eight-trade worked week sized under my personal daily stop, the mistakes that cost me money, and exactly how ADX fits inside daily loss, consistency and news rules.
What ADX actually measures (and the one thing it never tells you)
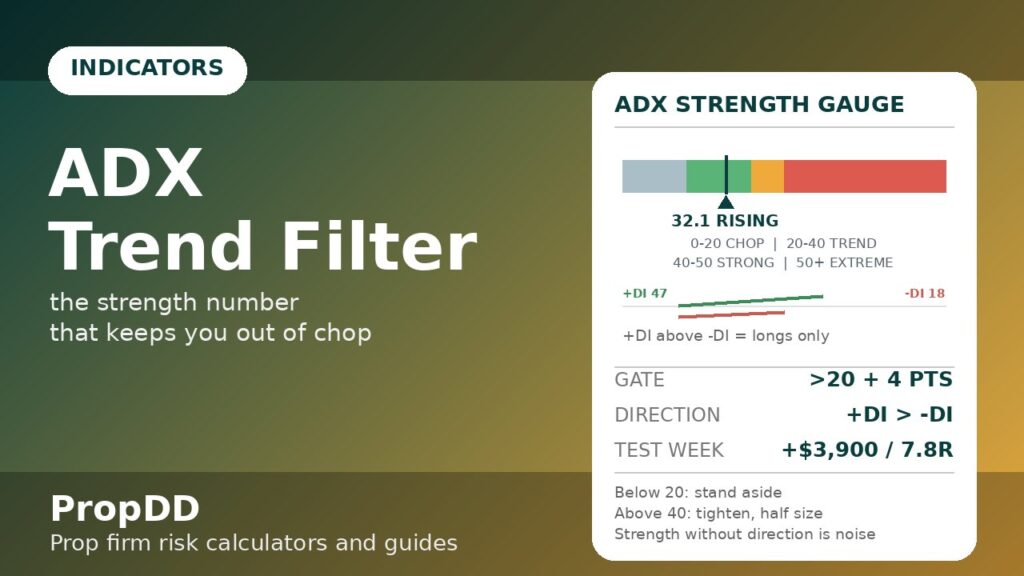
ADX — the Average Directional Index, built by J. Welles Wilder in 1978 — measures trend strength only. It is computed from two directional lines, +DI (positive directional indicator) and -DI (negative directional indicator). When one line clearly dominates the other, ADX is high; when they are tangled together, ADX collapses toward zero. The elegant part for a prop trader: ADX rises in a strong downtrend exactly as it rises in a strong uptrend. Direction comes from which DI line is on top; strength comes from the ADX line itself. Here is how I read the number:
| ADX reading | What the market is doing | What I do on a funded account |
|---|---|---|
| Below 20 | Chop — no tradeable trend exists | Stand aside or trade half size with mean-reversion plans only |
| 20 to 25 | A trend is trying to form | Wilder’s +4 rule: only trade if ADX has risen 4+ points from its low |
| 25 to 40 | Healthy, tradeable trend | My entries live here — pullbacks with the dominant DI line |
| 40 to 50 | Strong, extended trend | Trade it, but tighten stops — late entries get punished |
| Above 50 | Exhaustion territory | No fresh entries; manage or exit — this is where reversals start |
The one thing it never tells you is direction, and misunderstanding that is how traders get hurt. An ADX of 38 on a falling market is not a buy signal — it is a confirmed strong downtrend. Every signal rule in this guide pairs the ADX number with the +DI/-DI verdict, because strength without direction is a loaded gun with no sights.
The ADX formula, worked by hand on a real GBPUSD day
I work this by hand once or twice a year, because seeing the numbers move teaches you what the line is really saying. The calculation runs in four steps, from two GBPUSD daily bars:
| Step | What it is | My worked numbers |
|---|---|---|
| 1. Directional movement | +DM = today’s high minus yesterday’s high (if it beats the down move), -DM = yesterday’s low minus today’s low (if it beats the up move) | Day 1 H 1.2720 / L 1.2650, Day 2 H 1.2760 / L 1.2680: +DM = 0.0040, -DM = 0 (down move was negative) |
| 2. True range | TR = largest of (H-L), |H – prev close|, |L – prev close| | TR = max(0.0080, 0.0060, 0.0020) = 0.0080 |
| 3. The DI lines | +DI = 100 x Wilder-smoothed +DM / smoothed TR; -DI the same with -DM | With smoothed +DM 0.0430, -DM 0.0167, TR 0.0916: +DI = 46.96, -DI = 18.25 |
| 4. DX then ADX | DX = 100 x |+DI – -DI| / (+DI + -DI); ADX = Wilder 14-period average of DX | DX = 100 x 28.71 / 65.21 = 44.03; prior ADX 31.20 gives new ADX = 31.20 – 2.23 + 3.15 = 32.1 |
Two things fall out of the arithmetic that matter on a funded account. First, the double smoothing (Wilder average of a Wilder average) makes ADX deliberately slow — it confirms a trend only after directional movement has persisted for several bars, which is why I use it as a filter and never as an entry trigger. Second, the verdict on this worked day is unambiguous: ADX 32.1 and rising, +DI above -DI — a confirmed uptrend, and the only trade type I would take here is a long on a pullback.
Best ADX settings for prop firm trading
The default is 14 periods, and on a funded account I keep it there for H1 and above. Shorter settings react faster but add exactly the noise that breaches daily limits; longer settings smooth the line but confirm so late the move is half over. The real adjustment is the timeframe, not the length:
| My profile | Timeframe | ADX length | Entry threshold | Why it works on a prop account |
|---|---|---|---|---|
| Day trader (my style) | H1 entries, H4 context | 14 | ADX > 20 and rising | H1 filters the M15 chop that kills daily limits; H4 keeps me out of counter-trend trades |
| Scalper | M15 entries, H1 context | 10 | ADX > 25 and rising | Faster length reacts to intraday regime shifts; the higher threshold compensates for noise |
| Swing trader | H4/D1 entries | 14 | ADX > 25 | Daily trends are the cleanest regime a prop trader can own — few signals, fat moves, no chop bleed |
One more setting note: keep the +DI/-DI length identical to the ADX length. Platforms split them into two inputs and it is tempting to “optimise” one against the other; all that does is desynchronise the strength verdict from the direction verdict, and you end up trading a strong trend reading against a stale direction.
How I read ADX signals: my four rules
ADX generates no entries on my charts. It grants permission for entries my price-action rules already fired. The filter is four rules, applied in order, and a setup must pass all four:
Rule 1 — the Wilder +4 gate. I only consider trend entries when ADX is above 20 AND has risen at least 4 points from its recent low. If ADX bottomed at 16, I need 20. This single rule would have deleted all three of my doomed Tuesday trades (14.2, 13.6, 12.9 — not even close).
Rule 2 — direction from the DI cross. +DI above -DI means longs only; -DI above +DI means shorts only. ADX strength without this check once had me buying into a confirmed ADX-38 downtrend because “the trend is strong”. It was. It was strongly against me.
Rule 3 — the extension brake. ADX above 40 means the trend is extended, not confirmed. I trade it only with tightened stops and half size, and I never add. Fresh full-size entries above 40 are how you buy the top of the move your own filter identified.
Rule 4 — below 20 means stand down. When ADX sits under 20, I do not take trend trades at all — this is the chop zone that manufactured my $1,840 Tuesday. Range-fade plans are allowed at half size; everything else waits.
My worked week: eight trades under a $2,500 personal stop
The context: a $100,000 account, a firm daily loss limit of 5% ($5,000), and my own rule of a $2,500 personal daily stop — half the firm’s limit, set every morning before I trade (my personal daily stop routine). Risk per trade is 0.5% ($500), and position sizes come from my max daily drawdown calculator so every entry’s worst case is pre-mapped against the limit. Every trade below passed all four ADX rules — two more setups that week failed Rule 1 and were never taken:
| # | Pair + direction | ADX at entry | DI verdict | Result (R) | $ |
|---|---|---|---|---|---|
| 1 | EURUSD long | 24.3, rising | +DI > -DI | +1.2R | +$600 |
| 2 | GBPUSD long | 31.7, rising | +DI > -DI | +2.1R | +$1,050 |
| 3 | EURUSD short | 18.4, flat | — (Rule 1 fail) | Skipped | $0 |
| 4 | USDJPY long | 22.9, +4.6 from low | +DI > -DI | -1.0R | -$500 |
| 5 | XAUUSD long | 36.2, rising | +DI > -DI | +1.6R | +$800 |
| 6 | EURGBP short | 19.8, falling | — (Rule 4 fail) | Skipped | $0 |
| 7 | GBPUSD short | 28.4, rising | -DI > +DI | +1.9R | +$950 |
| 8 | EURUSD long | 44.1 (extension) | +DI > -DI | +1.4R at half size | +$350 |
| 9 | US30 long | 26.6, rising | -DI > +DI | -1.0R | -$500 |
| 10 | EURUSD short | 33.9, rising | -DI > +DI | +2.3R | +$1,150 |
Totals: 8 trades taken, 6 winners, 2 losers, +$3,900 net (+7.8R), worst single day -$500 — one-fifth of my personal stop, one-tenth of the firm’s limit. The two skipped setups (rows 3 and 6) are the point of the whole exercise: both were entries I would have taken in my pre-ADX life, and both pairs chopped sideways for the rest of the session. The filter’s job is not to find winners — it is to delete the losers that never had a trend behind them. Note the extension row (trade 8): ADX 44.1 said the trend was real but late, so Rule 3 cut the size in half — the trade still paid, but the sizing is what kept the risk honest.
Five mistakes that nearly cost me the account
Mistake 1 — trading the ADX line like an entry signal. Early on I bought every time ADX crossed above 25. ADX crossing 25 is a regime announcement, not an entry — the price-action trigger still has to fire. I now let my pullback and breakout rules pick the entry and let ADX veto the trade, never the other way round.
Mistake 2 — ignoring the lag on news days. After a CPI print, ADX can take two to four H1 bars to confirm the new trend — and by then the funded-account-killing part of the move is often done. On red-news days I trade the first hour off my trend pullback rules with wider stops or not at all; ADX confirms the aftermath, it does not protect the event.
Mistake 3 — chasing above 50. My worst single ADX-era trade was buying GBPUSD with ADX at 54 because “the trend is strong”. Strong and exhausted are neighbours. The pair reversed 130 pips into my stop within the session. Above 50, I manage — I never open.
Mistake 4 — M15 ADX without H1 context. The 14-period ADX on M15 whipsaws through 20 during every London lunch lull. I took four counterfeit “confirmed trends” in one week before I made the H1/H4 context check mandatory. On a funded account, timeframe discipline is a drawdown control, not a preference.
Mistake 5 — forgetting ADX has no memory of my risk. ADX can be perfectly right — 38, rising, +DI dominant — and the trade can still lose its full 0.5%. The indicator manages regime; the risk-of-ruin calculator manages survival. I run both numbers before every session, because a correct trend read with suicidal sizing still breaches the daily limit.
How ADX fits prop firm rules: daily loss, consistency, news
| The firm rule | How ADX keeps me compliant |
|---|---|
| Daily loss limit (5%) | Chop is where daily limits die — small losses stacking on zero-trend trades. Rule 4 (stand down below 20) deletes the exact trade type that bled my $1,840 Tuesday |
| Consistency rule | Firms cap how much of total profit can come from one day. ADX-confirmed trends produce steady, repeatable +1R to +2R days instead of one lottery spike — my test week spread +$3,900 across six winning trades |
| Trailing/maximum drawdown | The extension brake (Rule 3) keeps me from adding size at the top of moves, which is precisely where trailing-drawdown breaches happen on reversals |
| News trading restrictions | ADX lags news events by design. Knowing that lag exists stops me from trusting a “confirmed” ADX reading during the first hour of a red-news print — the one window firms watch hardest |
| Minimum trading days | On dead-ADX days I still log valid no-trade sessions toward my day count instead of forcing entries. A skipped day counts the same as a traded one, and costs nothing |
The theme across all five: prop firm rules punish the same behaviour ADX filters out — overtrading dead markets, oversized late entries, and trading events the indicator cannot see in time. Pair the filter with the EMA trend context I use on the same charts, and the two together decide most of my trading days before London opens.
Frequently asked questions
What is the best ADX setting for prop firm trading?
The classic 14 on H1/H4 for day trading — it is the default for a reason, and funded-account trading rewards defaults over optimisation. Scalpers can drop to 10 on M15 with a higher 25 threshold to compensate for noise; swing traders keep 14 on the daily. Change the timeframe to match your style, not the length to chase sensitivity.
Can ADX be used alone to generate buy and sell signals?
No, and this is the most expensive misunderstanding in this guide. ADX measures trend strength, not direction — an ADX of 40 on a falling market confirms the downtrend, not a buying opportunity. Use +DI/-DI for direction, price action for the entry trigger, and ADX purely as the permission filter.
Why does my ADX stay below 20 for days at a time?
Because the market is ranging, which it does most of the time — especially on majors between news events. A flat sub-20 ADX is the indicator working correctly, not a broken setting. Log the day, trade nothing or fade the range at half size, and wait. The trend days pay for the waiting days.
Does ADX work on gold and indices or just forex pairs?
It works on anything with a price history, and the thresholds transfer directly — XAUUSD and US30 trend beautifully, and my test week’s gold and index trades used the same 20/25/40/50 levels as the forex ones. The only adjustment is sizing: gold moves roughly ten times the pips of EURUSD, so run every entry through the drawdown calculator before you click.
Should I use ADX or ATR for prop firm risk management?
Both, for different jobs. ATR sizes the stop — it tells you how far price normally moves, so your stop lives outside the noise. ADX decides whether the trade deserves to exist at all — it tells you whether a trend is present to carry the trade to target. ATR without ADX gives you well-sized trades in dead markets; ADX without ATR gives you confirmed trends with stops that get hunted. For the deeper read, see Babypips’ ADX primer.
How long does it take ADX to confirm a new trend?
Typically 3 to 8 bars on your trading timeframe after the move starts, because of the double Wilder smoothing — that is the price of reliability. On H1 that means three to eight hours of confirmation lag, which is why ADX filters entries but never triggers them. If you need faster confirmation, you are describing a different indicator (and a different risk profile).
Risk disclaimer: trading leveraged forex and CFD products on prop firm evaluations carries a substantial risk of loss, including the loss of challenge fees. Nothing here is financial advice — I write about what I do on my own accounts, and your rules, limits and risk tolerance are your own. Never risk money you cannot afford to lose.




4 comments
[…] tool for that reason: the Choppiness Index decides whether I trade, and a trend tool like the ADX indicator or a momentum tool like TRIX decides which way. If the index says chop, the direction tool does not […]
[…] simplicity is the point. Most indicators I have covered, from EMA to ADX, answer a different question: where is momentum, or how strong is the trend. Supertrend answers a […]
[…] and this article treats it that way. Second, the ratio is not directional, in the same way that ADX is not directional: a reading of 0.80 on a falling market means a clean downtrend, not a buying […]
[…] is not the only trend tool on my chart: my ADX guide reads the same strength score on its own, my EMA guide sets the bigger-picture bias, and the […]