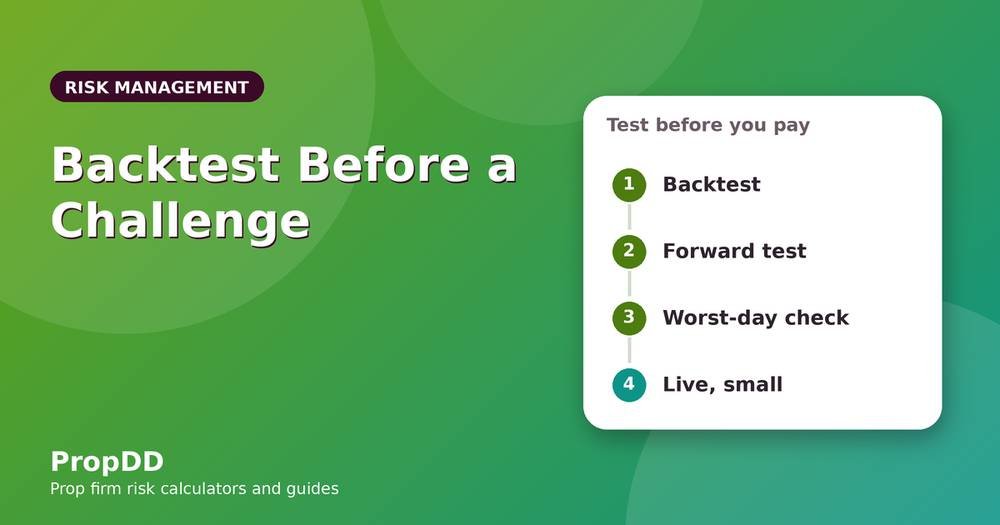
If you want the short answer before you pay for a prop firm challenge: write your rules down, test them on at least a hundred trades with costs included, check them on data you didn’t use to design them, forward-test on a demo for a few weeks, and then compare the worst day and the longest losing streak with the loss limits of the firm you’re about to buy. That sequence won’t promise a pass. It will show you whether your intended risk per trade is even compatible with how your strategy behaves.
In this article
- What testing can and can't tell you
- Step 1: write the rules before you look at any chart
- Step 2: backtest with costs and a sensible sample
- Experiment 1: how easily noise looks like an edge
- Step 3: keep some data unseen
- Step 4: forward-test on a demo
- Which numbers to record
- Step 5: check the worst day and the longest streak against the limits
- Experiment 2: ten thousand challenge attempts
- Test the firm's rules too
- Common traps
- A checklist before you pay for a challenge
- How we ran the simulations, and their limits
- Frequently asked questions
- The short version
The rest of this article walks through each step and backs the key points with two small experiments we ran ourselves, because most advice on this topic is repeated without anyone checking it. One experiment shows how easy it is to “find” a profitable strategy in pure noise. The other simulates ten thousand challenge attempts to see how risk per trade changes the outcome. The method is described in full near the end, so you can reproduce it. If you’d like to see your own daily limit while you read, the drawdown calculator is on the home page.
What testing can and can’t tell you
Testing tells you whether a set of rules would have made or lost money on past data, how long the losing streaks were and how deep the drawdowns went. It cannot tell you that the future will resemble the past, and it cannot tell you how you’ll behave with real money at stake. Think of it as a filter. It removes ideas that clearly don’t work and gives realistic expectations for the ones that might. For a plain definition, see Investopedia’s page on backtesting.
Step 1: write the rules before you look at any chart
A strategy can only be tested if its rules are mechanical. When exactly do you enter? Where is the stop, and why there? Where do you take profit or exit? Which instruments and hours? What makes you skip a trade? If a friend couldn’t follow your rules and arrive at the same trades, you can’t test them. Any result would simply reflect hindsight. Write the rules first, date the document and don’t edit it while you test.
Step 2: backtest with costs and a sensible sample
Go through historical charts one trade at a time and record each result in R, where 1R is the amount you risk. You can do this by manual replay on a charting platform such as TradingView, or with a platform’s strategy tester if your rules can be coded. Manual testing is slow and teaches you what the setup looks like in real time. Automated testing is quick but needs precise rules. Many traders do a manual pass first and an automated pass second.
Two things matter more than the tool. First, include costs in every trade: the spread at the hours you’d actually trade, any commission and an allowance for slippage. A gross result isn’t a result. Second, sample size. Thirty trades say very little, a hundred begins to say something and several hundred across trending, ranging, quiet and volatile periods is better. How a handful of trades can mislead is covered in expectancy and risk of ruin for prop traders.
Experiment 1: how easily noise looks like an edge
Here’s the trap in numbers. We generated 300 completely random price series, 5,200 bars each, with no pattern in them by construction. On each one we tested 54 versions of a simple moving-average crossover strategy (six fast averages, nine slow ones) over the first 3,000 bars and picked the version that looked best. Then we ran that same version on the remaining 2,000 bars it had never seen.
| Measure (300 random series) | First 3,000 bars (design) | Last 2,000 bars (unseen) |
|---|---|---|
| Average Sharpe-style score of the “best” setting | 0.35 | 0.01 |
| Share of series where the best setting looked profitable | 94% | 51% |
| Share of series where it scored above 0.5 | 25% | about 0 on average |
On pure noise, picking the best of 54 settings produced something that looked profitable 94% of the time. On fresh data it was a coin flip, 51%, with an average of essentially zero. Nothing was wrong with the strategy’s maths. We simply gave it enough chances to fit the past. That’s what overfitting looks like, and it’s why a backtest you tuned until it looked good is the weakest kind of evidence.
Step 3: keep some data unseen
The defence is simple and rarely followed. Design the rules on one stretch of data, then test them once on a different stretch you haven’t looked at. If results hold, that’s encouraging. If they collapse, the design was fitted to the first sample. It’s easy to cheat by peeking, so decide in advance which period is for design and which for the test, and don’t go back and tweak after seeing the second result. Be suspicious of any setting that works at a value of 17 but fails at 16 and 18. A robust idea works across a neighbourhood of similar settings.
Step 4: forward-test on a demo
When the backtest survives, trade the same written rules on a demo account in real time for at least several weeks, logging every trade. Forward testing reveals what a backtest hides: how the platform behaves, how fast you actually react, what spreads look like at your hours and how you feel when a setup appears at an awkward moment. If the live-demo results roughly match the tests, you have a basis for trust. If they’re much worse, find out why before spending money. Demo can’t reproduce the emotions of real risk, so plan to start any live account at a smaller size than you intend to end up with.
Which numbers to record
Average result per trade in R (the expectancy), win rate, average winner and average loser in R, the longest losing streak, the deepest drawdown in R and the worst single day in R. For a prop trader the last three matter most, because loss limits are about bad stretches, not averages. A good average with a terrible worst day is a poor fit for a tight daily limit. A trading journal with the same columns for tests and live trades keeps the numbers comparable.
Step 5: check the worst day and the longest streak against the limits
This is the check most people skip, and it takes ten minutes. Convert your worst tested day and your longest losing streak into percentages at the risk per trade you plan to use. If your worst day was −4R and you risk 0.5% per trade, that’s −2%, comfortably inside a 5% daily limit. At 1% it’s −4%, close to the wall, and at 1.5% it’s a breach. If your longest streak was nine losses, 0.5% means 4.5%, fine against a 10% overall limit, while 1.5% means 13.5%, which ends the account. Add a margin, because the real future can contain a worse streak than your sample. The method for choosing the number itself is in how much to risk per trade.
Experiment 2: ten thousand challenge attempts
To see how much the risk per trade changes the outcome, we simulated challenges with these rules: an 8% profit target, a 5% daily loss limit, a 10% static overall limit, three trades per day, up to 60 trading days and a cost of 0.05R per trade. Each setting was run 10,000 times. The first strategy has a real, modest edge: it wins 45% of the time with 1.8R winners, which is +0.26R per trade before costs.
| Risk per trade | Pass | Daily breach | Overall breach | Unfinished in 60 days |
|---|---|---|---|---|
| 0.25% | 71% | 0% | 0% | 29% |
| 0.50% | 93% | 0% | 1% | 6% |
| 1.00% | 91% | 0% | 8% | 0% |
| 1.50% | 85% | 0% | 15% | 0% |
| 2.00% | 57% | 43% | 0% | 0% |
Three things stand out. Very small risk is safe but slow: at 0.25%, 29% of attempts hadn’t finished in 60 days, which matters if your challenge has a deadline. The best result came at 0.5%. And risk above 1% starts to cost you through the overall limit even though the strategy is good. The 2% row is dominated by the daily limit: three losses in a row is about 6%, so 43% of attempts breached it.
One detail is easy to miss. At 1.5% the daily breach rate is 0%, but only because the simulation caps trades at three a day, and three straight losses cost about 4.7%, just under the 5% limit. That’s the value of a trade-count cap, a simple rule that does real work. It’s also why a personal stop below the firm’s limit is worth having; see how to set a personal daily stop.
What a strategy with no edge does
We ran the same challenge with a strategy that has no edge after costs: it wins 40% of the time with 1.5R winners, which breaks even before costs and loses 0.05R per trade after them.
| Risk per trade | Pass | Daily breach | Overall breach | Unfinished |
|---|---|---|---|---|
| 0.25% | 2% | 0% | 4% | 94% |
| 0.50% | 17% | 0% | 38% | 45% |
| 1.00% | 39% | 0% | 58% | 3% |
| 1.50% | 44% | 0% | 56% | 0% |
| 2.00% | 33% | 66% | 1% | 0% |
A strategy with no edge still passed up to 44% of the time at higher risk. Luck can carry a trader across an 8% target. This is the most important lesson in the article: passing a challenge does not prove you have an edge, and failing one doesn’t prove you lack one. Only a large, honest sample of trades does. It’s also why testing before you pay is worth the effort.
Test the firm’s rules too
A strategy has to live inside a rulebook. Does it rely on news trading that the firm restricts, or on weekend holding that it bans? Does it need many trades a day, so costs and a trade cap collide? Does the reset time or the daily base change how a day is counted? Treat these as testable questions, and mark any rule that conflicts with how the strategy really trades. The checklist in daily drawdown rules: what to check before you buy covers them one by one, and daily versus overall drawdown explains how the two limits interact.
Common traps
Look-ahead bias means using information that wasn’t available at the moment of the decision, such as a candle that hadn’t closed. Cherry-picking means testing only the stretches that look good. Ignoring slippage hurts most on tight stops and around news. Overtrusting a lucky run is what Experiment 2 warns about. And changing rules after seeing results quietly turns your test data into design data.
A checklist before you pay for a challenge
The rules are written and dated. The backtest has at least a hundred trades, with costs. The rules survived data you hadn’t seen. A demo forward-test of several weeks looks broadly similar. The worst tested day and the longest streak fit inside the firm’s limits at your planned risk, with a margin. The firm’s rules don’t conflict with your style. You have a one-page plan; the risk management plan template gives a layout. If any line is missing, the cheapest next step is more testing, not a purchase. Our plan for the challenge itself is in how to pass a prop firm challenge with small daily risk.
How we ran the simulations, and their limits
Both experiments used Python with NumPy. Experiment 1 used normally distributed random returns, 300 series, 54 moving-average combinations and a 3,000/2,000 split. Experiment 2 used independent trades with fixed win probability and payoff, risk set as a percentage of the starting balance, closed-trade equity only (no floating losses), three trades a day, a static overall limit and a fixed cost per trade. These simplifications matter. Real trades can be correlated, floating losses can breach a limit earlier, and real risk per trade isn’t constant. Treat the tables as an illustration of how the pieces interact, not as pass rates for any real firm. The core of the challenge simulation is short enough to reproduce:
import numpy as np
def challenge(win_p, win_r, risk, cost=0.05, trades_per_day=3,
              days=60, target=8, daily=5, overall=10, n=10000, seed=1):
    g = np.random.default_rng(seed)
    bal = np.zeros(n); status = np.zeros(n, int)  # 0 run, 1 pass, 2 daily, 3 overall
    for d in range(days):
        start = bal.copy()
        for t in range(trades_per_day):
            running = status == 0
            pnl = np.where(g.random(n) < win_p, risk*win_r, -risk) - risk*cost
            bal = np.where(running, bal + pnl, bal)
            status[(status == 0) & (start - bal >= daily)] = 2
            status[(status == 0) & (bal <= -overall)] = 3
            status[(status == 0) & (bal >= target)] = 1
    return [(status == k).mean()*100 for k in (1, 2, 3, 0)]
Frequently asked questions
How many trades do I need in a backtest?
At least a hundred, and more if you can get them. Thirty trades can’t separate skill from luck, as Experiment 2 shows. Spread the sample across different market conditions.
How long should I forward-test on a demo?
A few weeks at the least, long enough to see varied conditions and at least thirty or so trades. What matters most is logging every trade honestly, including the ones you skipped against your rules.
Is demo trading realistic enough?
It’s good for checking rules, platform behaviour and spreads. It can’t reproduce the pressure of real money, so start any live account smaller than you plan to end up.
What if my backtest and demo results disagree?
Look for causes: costs you left out, slippage, rules that drifted or a design fitted to the past. Don’t pay for a challenge until you understand the gap.
Do I need to code to backtest?
No. Manual replay works well, especially at first. Coding helps once the rules are precise and you want more volume.
Can I rely on the pass rates in your simulation?
No. They illustrate how risk per trade, trade caps and loss limits interact under stated assumptions. They aren’t pass rates for any real firm, and real results will differ.
The short version
Write the rules first, test with costs on a real sample, keep data unseen, forward-test on a demo and check the worst day and longest streak against your limits before you spend a cent. Remember that a pass can be luck, and that smaller, steadier risk usually gives an honest edge more time to show. For the rule your numbers are measured against, read the prop firm max daily drawdown explained, and for neutral background on the ideas used here, see Investopedia’s pages on maximum drawdown and risk of ruin, and the free lessons at BabyPips.