Index CFDs have a certain appeal for prop traders. They trend nicely, they move on clear catalysts and a single position can make or lose a meaningful amount in a short time. That last part is the problem. If you’re not careful about how an index contract is sized, you can go from a calm morning to a breached daily limit in the time it takes to open a trade.
In this article
- What an index CFD is
- Read the contract specification
- Sizing from the stop, in points
- Why indices can eat your day quickly
- The cash open
- Gaps and overnight positions
- News and data releases
- Spreads and costs in points
- Correlation among indices
- Where to put the stop
- Risk per trade on indices
- A sample plan
- Practice drill
- Mistakes to avoid
- A stress table for a 100-point move
- Financing and CFD quirks
- The first move after the open
- Which index to trade
- Journal fields for index trading
- Plan for a fast day in advance
- Keep the contract spec in view
- Index trading and the overall limit
- Frequently asked questions
- The short version
This article is a practical look at trading indices such as the US30 and the NAS100 inside a daily drawdown rule: how contracts and point values work, how to size from the stop, what the cash open does to your equity and how to handle gaps and news. Contract details differ between brokers, so I’ll use round numbers to show the method, and you’ll need to substitute the figures from your own platform. The drawdown calculator will show your daily room while you work through the examples.
What an index CFD is
An index CFD lets you trade the price movement of a stock index, such as a group of large US companies, without owning the shares. You buy or sell a number of contracts, and your profit or loss is the price change in points times the value of a point per contract. The details, such as the contract size, the value of one point and the minimum lot, are set by the broker, and they vary.
Read the contract specification
This is the step people skip. Open the specification for the index symbol on your platform and note: the value of one point per lot (it might be $1, $10 or something else), the minimum lot and step, the typical spread in points, the trading hours and the swap or financing rates. Also note how the platform names the symbol, since the same index can appear under different names. Everything else in this article builds on those numbers. If you’ve never done this exercise, lot size basics for forex prop traders explains the same idea for currencies.
Sizing from the stop, in points
The formula is familiar: contracts equal dollar risk divided by stop distance in points times the value of a point. Suppose you risk $400, your stop is 60 points away and a point is worth $1 per contract. That’s $400 ÷ (60 × $1) = 6.67, so you’d use 6.6 or 6 contracts depending on the step. If the point value is $10 per contract, the same risk gives $400 ÷ (60 × $10) = 0.67 contracts. The same trade, a very different size, which is why you can’t copy a position size from one broker to another.
Wider stop, smaller size. The method is the one in position sizing for prop firm challenges.
Why indices can eat your day quickly
Index movements are often measured in tens or hundreds of points. A stop that’s 60 points away on one day can be hit within a minute on another. And because the point value per contract can be large, a modest-looking position can lose a lot per point. A quick check: if the index moves 100 points against you, what do you lose? Multiply your contracts by 100 and by the point value. If the answer is more than your planned risk by a wide margin, the size is wrong.
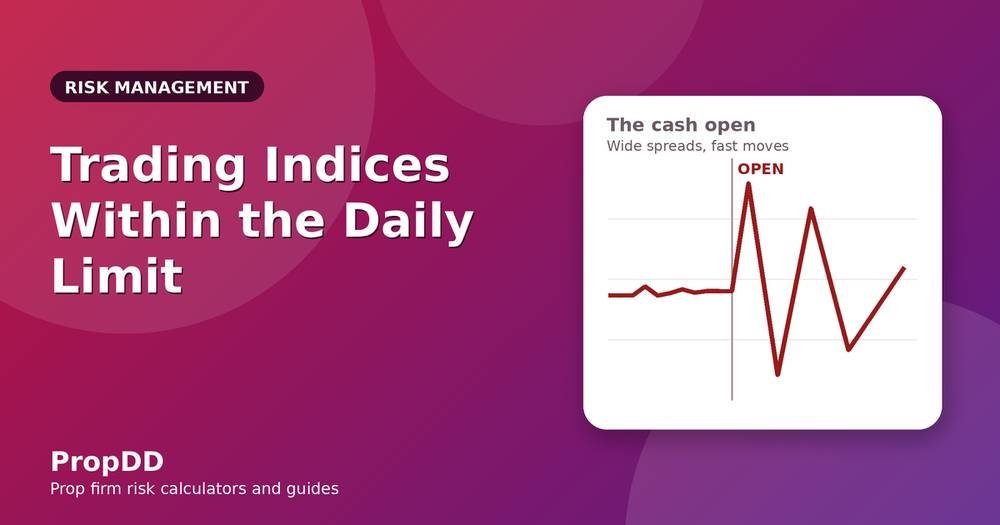
The cash open
When the major exchanges open, activity surges. The first minutes can bring fast moves in either direction, wide spreads and slippage on stops. Many traders avoid the first five to fifteen minutes, or trade at half size. If you’re holding a position through the open, remember that your equity can move sharply before you can react. Equity-based rules count that, as explained in floating losses and open trades.
Gaps and overnight positions
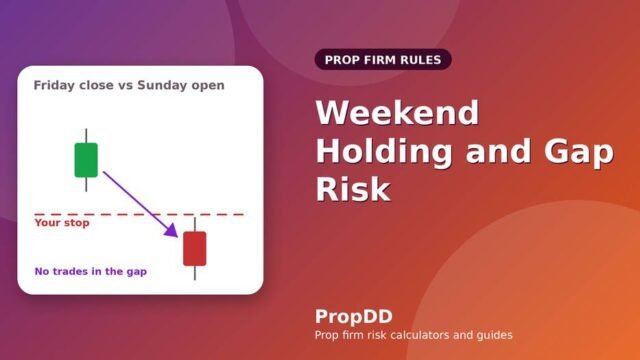
Indices often gap at the open because the cash market closes overnight, and futures-based CFDs may carry their own quirks. A stop doesn’t guarantee you’ll exit at your level, as the market can open beyond it. If your firm permits overnight or weekend positions, size for a gap larger than your stop. The same arithmetic described in weekend holding and gap risk applies.
News and data releases
Indices react strongly to inflation data, employment reports, central bank decisions and company earnings, particularly from the largest names in the index. A release can move the index by dozens of points in seconds. Check a calendar, such as TradingView’s economic calendar, before every session, and decide in advance whether you skip, flatten or trade after each event. The discussion in news trading and daily drawdown applies directly.
Spreads and costs in points
Spreads on indices are quoted in points, and they widen around the open, around news and late in the session. A three-point spread on a 40-point stop is 7.5% of your risk. As with currencies, consider adding the spread to the stop when sizing. Check whether the firm counts commissions and swaps toward the daily loss; see swaps and commissions.
Correlation among indices
US indices tend to move together. A long position in one index and a long position in another are very close to the same bet, and the stops can be hit at the same moment. Count them as a single position when you add up open risk, and keep the total under your cap. It’s one of the most common ways traders accidentally double their risk.
Where to put the stop
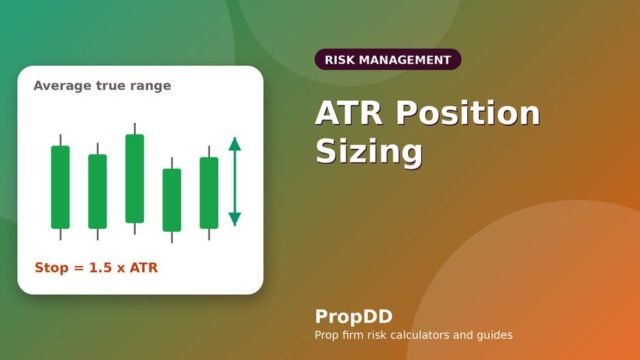
Place it where the trade idea is wrong. Volatility-based approaches, such as a multiple of the average true range, adapt to current conditions: a quiet market gets a tighter stop, a volatile one a wider stop and a smaller size. Structure-based approaches use recent swing points. Either is fine, as long as you choose the stop first and size second. Avoid placing stops at round numbers where many others will, if you can help it, since those levels are often tested.
Risk per trade on indices
Because of the speed and the gaps, many traders trade indices at a lower percentage than currencies, such as 0.25% instead of 0.5%. It’s a sensible starting point, and you can adjust after a month of data. The reasoning is in how much to risk per trade.
A sample plan
Account $100,000, daily limit 5% ($5,000), personal stop at $3,500. Risk on indices: 0.25% ($250). Point value $1 per contract (check yours). The trader skips the first ten minutes after the cash open. At 10:00, a setup with a 50-point stop: $250 ÷ ($1 × 50) = 5 contracts. Stopped out, −$250. A second setup at 11:15, a 40-point stop: $250 ÷ 40 = 6.25, so 6 contracts. A win at +1.5R, +$375. Net +$125 for the day, 7% of the daily limit used at the worst point. The trader stops before the afternoon data release. Unexciting, which is the aim.
Practice drill
Assume $1 per point per contract. Work these out: (1) $100,000 account, 0.25% risk, 50-point stop; (2) $50,000, 0.3%, 30 points; (3) $25,000, 0.4%, 40 points; (4) $200,000, 0.2%, 80 points. Answers: (1) $250 ÷ 50 = 5 contracts. (2) $150 ÷ 30 = 5 contracts. (3) $100 ÷ 40 = 2.5 contracts. (4) $400 ÷ 80 = 5 contracts. Now redo them with $10 per point and notice that every answer drops by a factor of ten. That’s the contract specification doing its work.
Mistakes to avoid
Assuming the point value from another broker. Trading the first minute of the cash open at full size. Stacking correlated indices. Holding overnight without sizing for a gap. Moving a stop to “give it room”. Ignoring costs in points. Each of these has a straightforward fix and a long list of unhappy stories behind it.
A stress table for a 100-point move
Before you trade an index, run this quick table with your own point value. It shows what a 100-point adverse move would cost at different sizes, assuming $1 per point per contract. Replace the figure with yours.
| Contracts | Loss on a 100-point move | Share of a $5,000 limit |
|---|---|---|
| 1 | $100 | 2% |
| 5 | $500 | 10% |
| 10 | $1,000 | 20% |
| 25 | $2,500 | 50% |
If the point value were $10, every row would be ten times larger: one contract alone would lose $1,000. Two minutes with a table like this teaches more than any rule of thumb.
Financing and CFD quirks
Holding an index CFD past the daily cutoff usually attracts financing charges, and some brokers apply adjustments around dividends or contract rollovers. These can show up as small credits or debits on your account. They rarely decide a trade, but they can nudge your equity near the limit. Look at the contract specification for the financing rate and ask the broker how adjustments are handled if you plan to hold.
The first move after the open
Many index traders wait for the first impulse to settle before acting, then look for a pullback or a range. There’s no rule that you must trade the open at all. If the first fifteen minutes are the hardest for you, skip them and write in your journal what happened. You’ll soon see whether the skipped trades would have paid, and whether the discipline was worth it.
Which index to trade
Different indices have different personalities: one with higher-priced, more volatile components moves in bigger point swings, while another is steadier but has a different point value. Pick one, learn its typical range and its spread, and stay with it for a while. Trading several at once adds correlated risk without adding much new information.
Journal fields for index trading
On top of the usual entry, stop and result in R, record the point value, the spread in points, the time relative to the cash open and whether a news release was within thirty minutes. After a month, patterns appear: perhaps your losses cluster in the first quarter hour, or around releases. Those are easy to fix once you can see them. See trading journal for prop firm traders for a simple layout.
Plan for a fast day in advance
On days when the index moves a lot, your stops get hit more often and slippage rises. Decide beforehand what “a fast day” means for you, say a certain number of points in the first hour, and what you’ll do: halve the size, stop trading or switch to a slower instrument. Making the decision before the market makes it for you is the same idea behind a personal stop; see how to set a personal daily stop.
Keep the contract spec in view
Paste the point value, the minimum lot and the spread for your chosen index on a sticky note by the screen. When you’re deep in a session, it’s surprisingly easy to forget whether a point is worth one dollar or ten, and the mistake shows up as a loss ten times bigger than planned. A visible note costs nothing and has saved plenty of accounts. If you change broker or account type, update the note the same day.
Index trading and the overall limit
Because index moves can be large, a short streak of losses can eat the overall cushion faster than the same streak in a quieter instrument. Watch both floors, not only the daily one, and cut size if the cushion shrinks. The relationship between the two is covered in daily versus overall drawdown.
Frequently asked questions
Are indices riskier than forex for a prop account?
They can be, mostly because the point value and the speed make sizing errors costly. With the right size, they’re manageable.
How do I find the point value?
In the contract specification of the symbol on your platform. Check it again if you change broker or account type.
Should I avoid the open?
Many traders do for the first few minutes. If you trade it, cut size and expect wide spreads.
Do index CFDs have special swap rules?
Financing is usually charged on overnight holds, and rates differ from forex. Check the specification and your firm’s rules on costs.
The short version
Read the specification, size from the stop in points, avoid the first minutes of the open, plan for gaps and news and count correlated indices as one. For the rule behind the numbers, read the prop firm max daily drawdown explained, and for neutral background on the instrument and its risks, see Investopedia’s page on leverage, and the free BabyPips lessons.