Somewhere between “just risk 1%” and a graduate course in probability, there’s a handful of ideas that genuinely change how a prop trader sizes trades. Expectancy and risk of ruin are the two I’d learn first. Neither needs advanced maths. Both explain why a strategy that makes money can still blow up an account, and why the daily loss limit makes it more likely, not less.
In this article
- What expectancy means
- Measuring in R
- Win rate versus reward ratio
- Costs shave expectancy
- Why positive expectancy isn't safety
- How losing streaks behave
- What a streak costs against the limits
- Risk of ruin, in plain words
- A note on the Kelly criterion
- How big a sample do you need?
- Choosing risk per trade with these ideas
- A worked example
- Expectancy for decisions, not for hope
- Common mistakes
- A tiny spreadsheet for expectancy
- Drawdowns are bigger than you expect
- Matching size to confidence in your numbers
- What to do with all this
- A caution about precision
- Frequently asked questions
- The short version
This guide explains both ideas with small numbers, shows how losing streaks behave, and ties them back to the choice that matters most on a funded account: how much to risk per trade. You can try the daily-limit side of the numbers in the drawdown calculator as you go.
What expectancy means
Expectancy is the average amount you expect to make or lose per trade, over many trades. It’s built from three things: how often you win, how much you win when you do and how much you lose when you don’t. In formula form: expectancy equals win rate times average win, minus loss rate times average loss.
It isn’t a prediction for the next trade. Any single trade can go either way. It’s a description of the long-run average, which is the only thing a strategy can sensibly promise.
Measuring in R
To compare trades of different sizes, measure results in R, where 1R is the amount you risk on the trade. A loss at the stop is −1R. A win that’s twice the risk is +2R. Expressing everything in R lets you describe a strategy independently of account size or lot size.
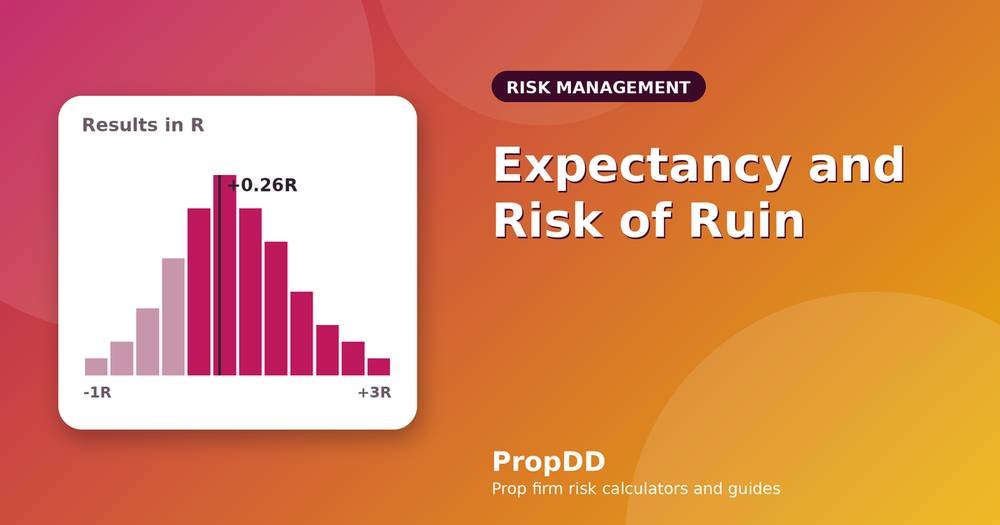
Take a strategy that wins 45% of the time, with average winners of 1.8R and average losers of 1R. Expectancy is 0.45 × 1.8 − 0.55 × 1 = 0.81 − 0.55 = +0.26R per trade. On average, each trade adds a quarter of the amount you risk.
Win rate versus reward ratio
People fixate on win rate, and it’s only half of the picture. Here’s expectancy per trade, in R, for combinations of win rate and reward-to-risk.
| Win rate | 1:1 | 1:1.5 | 1:2 | 1:3 |
|---|---|---|---|---|
| 30% | −0.40 | −0.25 | −0.10 | +0.20 |
| 40% | −0.20 | 0.00 | +0.20 | +0.60 |
| 50% | 0.00 | +0.25 | +0.50 | +1.00 |
| 60% | +0.20 | +0.50 | +0.80 | +1.40 |
A strategy that wins only 40% of the time can be perfectly healthy at 1:2, while one that wins 60% at 1:1 barely beats zero after costs. This is why you can’t judge a method from the win rate alone.
Costs shave expectancy
Spreads, commissions and slippage reduce each trade’s result. If your average cost is 0.05R per trade, a +0.20R expectancy becomes +0.15R, a quarter smaller. For high-frequency styles, costs can erase the whole thing. It’s why testing a strategy net of costs, not gross, is so important, and why swaps and commissions deserve a line in your plan.
Why positive expectancy isn’t safety
Here’s the catch. Expectancy tells you where the average goes after many trades. It says nothing about the path. A strategy with +0.26R per trade can have a run of eight losses in a row. If your risk per trade is too high for that run, you’ll never reach the long run. You’ll hit a loss limit first.
How losing streaks behave
If each trade is independent, the chance of a given number of consecutive losses starting from a particular trade is (loss rate) raised to the number of trades. The table shows a few cases.
| Win rate | 5 losses in a row | 8 losses in a row | 10 losses in a row |
|---|---|---|---|
| 40% | 7.8% | 1.7% | 0.6% |
| 50% | 3.1% | 0.4% | 0.1% |
| 60% | 1.0% | 0.07% | 0.01% |
These look small, and they mislead. They’re the chance that a streak starts at a given trade. Over a hundred trades, there are many places a streak can start, so a run of five or six losses in a row is quite likely, and eight isn’t unusual for a lower win rate. A trader who thinks “eight in a row never happens” is making the same mistake as someone who thinks a roulette ball can’t land on red seven times.
What a streak costs against the limits
Put the streak against your own numbers. At 0.5% risk, eight losses cost 4%, which is inside a 5% daily limit but uncomfortably close, and you’d be at your personal stop well before then. At 1%, eight losses is 8%, which breaches a daily limit of 5% by the fifth trade and approaches a 10% overall limit. At 2%, five losses end the account. The same strategy, the same luck, completely different outcomes, because of one number: risk per trade.
Risk of ruin, in plain words
Risk of ruin is the probability that you lose so much that you can’t continue. For a prop trader, “ruin” is hitting a loss limit, so it’s a very concrete thing. The more you risk per trade relative to your cushion, and the lower your edge, the higher the chance. You don’t need the formulas to use the idea; Investopedia’s page on risk of ruin gives the definition and the intuition. The practical message is simple: halving your risk per trade cuts the chance of ruin by far more than half.
A note on the Kelly criterion
You may come across the Kelly criterion, a formula for the bet size that maximises long-run growth. It’s elegant, and it’s far too aggressive for prop accounts, since it ignores hard loss limits and assumes you know your edge exactly. Most practitioners use a small fraction of the Kelly figure, if they use it at all. Read about it in Investopedia’s entry on the Kelly criterion, then treat it as a ceiling you never approach.
How big a sample do you need?
Estimating expectancy from a handful of trades is unreliable. With twenty trades, your measured win rate could easily be off by ten points either way. With a hundred, it’s better, but still fuzzy. If your estimate comes from a backtest, be careful about curve fitting, and expect live results to be somewhat worse. A sensible approach is to treat early results with scepticism, keep risk small until you’ve logged a meaningful number of live trades and update your estimate as the sample grows. Your trading journal is where that sample lives.
Choosing risk per trade with these ideas
Start from the worst plausible streak, not the average. Ask: if I lose eight trades in a row at some point, where am I against my personal stop and my overall floor? Pick a risk per trade that keeps you inside both. For many strategies, that lands between 0.25% and 0.75%. If your expectancy is higher, you don’t get to risk more. You simply reach your target sooner at the same safe size. The step-by-step method is in how much to risk per trade.
A worked example
A trader backtests a strategy: 45% win rate, average winner 1.8R, average loser 1R, giving +0.26R per trade before costs. Costs average 0.05R, so +0.21R net. They plan 3 trades a day over twenty days, 60 trades a month, for an expected +12.6R. At 0.5% risk per R, that’s +6.3% a month on paper. But a streak of seven losses, which has roughly a 1.5% chance of starting at any given trade, costs 3.5%. Over 60 trades, a streak of that length isn’t unlikely, and the trader has to be able to survive it without breaching the daily limit or panicking. At 0.5%, they can. At 1.5%, seven losses cost 10.5%, which ends the account. The strategy is identical. Only the size decides.
Expectancy for decisions, not for hope
The point of calculating it is practical. If your net expectancy is close to zero, no sizing trick will rescue you, and the honest conclusion is to improve the strategy or stop trading it. If it’s clearly positive, your job is to survive long enough for it to show up. Both conclusions are useful, and both are better than a vague feeling that “it’s working”.
Common mistakes
Judging a strategy by win rate alone. Ignoring costs. Trusting a small sample. Assuming a streak of eight “won’t happen”. Raising risk because expectancy is positive. Mixing up average results with the next trade. Forgetting that a daily limit makes the path matter, not just the average.
A tiny spreadsheet for expectancy
You only need a few columns. Result in R for each trade, then three formulas: the average of all the results (that’s your expectancy), the percentage of results above zero (your win rate) and the lowest running balance of the cumulative sum (your worst drawdown in R). Once you have forty or fifty trades, glance at these numbers every couple of weeks. They won’t predict the future, but they’ll tell you whether the live results look like your tests, and whether to keep or reduce size.
Drawdowns are bigger than you expect
A common surprise is how deep a profitable strategy’s drawdowns run. A system with +0.25R expectancy and a 45% win rate can plausibly produce a drawdown of ten R or more at some point in a few hundred trades. At 0.5% risk per R, ten R is 5%. At 1%, it’s 10%, which is the entire overall limit at many firms. You can’t tell in advance when that run will start, only that it’s likely to arrive. That’s why the risk per trade has to be chosen for the bad stretch, not for the average.
Matching size to confidence in your numbers
If your expectancy estimate comes from a hundred live trades, you can trust it a little. If it comes from a backtest you tweaked until it looked good, trust it less. A reasonable habit is to start new strategies at half your normal risk and increase gradually as the live sample grows and matches your expectations. It costs some speed, and it protects the account while you find out whether the strategy is what you think it is. The wider picture is in how to pass a prop firm challenge with small daily risk.
What to do with all this
Pick one strategy you actually trade. Pull the last fifty trades, put each result in R, compute the average and the longest losing streak, and then check what that streak would have done to your account at your current risk per trade. If the answer makes you uncomfortable, you’ve learned something valuable for the price of an afternoon. If it doesn’t, you’ve confirmed that your sizing matches your system. Either way, you’re making the decision with numbers instead of with hope.
A caution about precision
Numbers like +0.26R look precise and aren’t. They come from a sample, and samples wobble. Use them for direction and for sizing decisions, not for promises. If someone tells you their system has an expectancy of exactly 0.47R, ask how many live trades that came from, and whether costs were included. The honest answer is usually humbling, and that’s fine.
Frequently asked questions
What’s a good expectancy?
Anything reliably positive after costs. Many solid strategies sit between +0.1R and +0.5R per trade. Be suspicious of numbers far above that from small samples.
Can I have positive expectancy and still fail a challenge?
Yes. If your risk per trade is too high for the streaks the strategy produces, you’ll hit a limit before the average has time to work.
How many trades do I need to estimate it?
More than you’d like. Treat anything under fifty trades as a rough guess and under a hundred as a first estimate.
Does a higher reward ratio mean lower risk?
Not by itself. A high ratio with a low win rate means long losing streaks, which your risk per trade has to be able to absorb.
The short version
Expectancy tells you where the average goes, and risk of ruin tells you whether you’ll live to see it. Measure results in R, test net of costs, expect long streaks and set your risk per trade so that the worst plausible run still leaves you inside your limits. For the rule that makes this matter, read the prop firm max daily drawdown explained, and for the sizing mechanics, position sizing for prop firm challenges. The maximum drawdown page on Investopedia is a handy companion read.