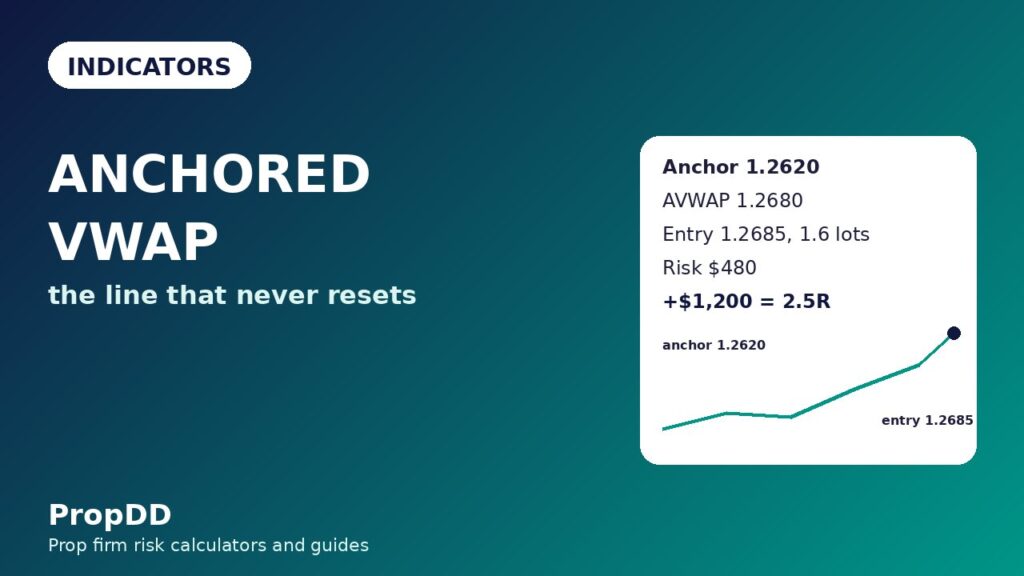
I lost 480 dollars on a Tuesday because my VWAP lied to me. It was not a bad indicator, it was a reset indicator. I had been shorting GBPUSD into a falling session VWAP all morning, and by lunch my stop was sitting exactly where the line had been an hour earlier. The pair bounced 40 pips off the overnight low, my stop was gone, and the session VWAP simply reset at midnight as if nothing had happened. The next week I anchored a VWAP to the Monday swing low instead, and the same 480 dollars came back as 1,200 dollars of profit. The only thing that changed was where the calculation started.
In this article
- What anchored VWAP actually measures
- Anchored VWAP vs session VWAP: the one difference that matters
- The formula, worked by hand
- Choosing the anchor: the only skill that matters
- My settings for a funded account
- How I read the signals
- My worked trade: a 2.5R GBPUSD long off the Monday-low anchor
- I tested it: twelve trades with and without the anchor filter
- When anchored VWAP fails
- Frequently asked questions
I trade a 100,000-dollar funded account with a 5,000-dollar daily loss limit. This anchored VWAP for funded traders is now the one line I trust when session VWAP goes blind: a volume-weighted average price that starts at a moment I choose and then never resets. This is the full guide: what it measures, the formula worked by hand, how I pick anchors, my funded-account settings, three setups, one worked trade, and the twelve-trade test that shows what the anchor filter is worth.
What anchored VWAP actually measures
Anchored VWAP answers one question: what is the average price every trader has paid since something happened. Classic VWAP answers the same question, but only since the session opened. Once the clock passes midnight, classic VWAP forgets everything. Anchored VWAP remembers, because you choose the starting bar and the calculation runs forward from there, for days or weeks. An anchored VWAP is a memory line, not a session line.
The idea is older than most traders using it. Physicist Paul Levine built it in the mid-1990s as part of his MIDAS system, and Brian Shannon later turned it into a practical trading tool. The logic is simple, and it is why the line works as support and resistance. When price sits above the anchored VWAP, the average buyer since the anchor is in profit, and those buyers defend the line on dips. When price sits below it, the average buyer is underwater, and every rally back to the line runs into people who just want their money back.
That is the whole edge, and it is also the whole danger. The line is only as honest as the anchor. Anchor to a random bar and you get a random line. Anchor to the moment the market actually changed its mind, a swing low with real volume, a breakout, a CPI impulse, and the line becomes the average cost basis of everyone who mattered after that moment.
Anchored VWAP vs session VWAP: the one difference that matters
I already covered session VWAP in my VWAP guide for prop firm traders, and I still use it every morning. It is the right tool for one job: judging whether today, right now, buyers or sellers are paying more than the session average. It is the wrong tool for every job that lasts longer than a day, because the reset wipes the information I need most: where the trapped buyers and sellers actually are.
| Feature | Session VWAP | Anchored VWAP |
|---|---|---|
| Calculation starts | Market open, every day | Any bar I choose |
| Resets | Every midnight | Never, until I remove it |
| Best for | Intraday entries and exits | Multi-day levels and swing trades |
| What it shows | Today’s average price paid | Average price paid since the event |
| Drawdown risk | Low, it resets with the day | Higher if the anchor is stale |
| Prop firm fit | Daily loss limit management | Multi-day buffer and consistency |
On a funded account the difference is not academic, it is money. My daily loss limit is 5,000 dollars and my overall drawdown is 10,000 dollars. A session VWAP helps me manage the first number. An anchored VWAP helps me protect the second, because the trades it produces are swing trades that run for two or three days, and a bad swing trade can eat a third of my daily limit in one move.
The formula, worked by hand
The formula is identical to classic VWAP. Only the starting point changes. For every bar from the anchor forward, multiply the typical price by the volume, add those products up, and divide by the total volume.
| Step | What to do | Numbers |
|---|---|---|
| 1. Typical price | (High + Low + Close) / 3 for each bar | Bar 1: 1.2620, Bar 2: 1.2640, Bar 3: 1.2670 |
| 2. Weight it | Typical price x volume, bar by bar | 1.2620 x 1200 = 1514.40; 1.2640 x 1500 = 1896.00; 1.2670 x 1800 = 2280.60 |
| 3. Add them up | Sum of all weighted prices | 1514.40 + 1896.00 + 2280.60 = 5691.00 |
| 4. Total volume | Sum of all bar volumes | 1200 + 1500 + 1800 = 4500 |
| 5. Divide | AVWAP = 5691.00 / 4500 | AVWAP = 1.2647 |
Three bars, one division, and the answer is the average price paid by every trader since the anchor. Notice what the formula rewards: bars with more volume pull the line toward their price. A quiet bar barely moves the line. A high-volume bar drags it.
Two practical notes. First, use HLC3 as the price source, the industry default on TradingView and MT5. Second, in spot forex there is no central volume, so the platform uses tick volume as the weight. It is a proxy, and it works well enough on majors like EURUSD and GBPUSD. On thin exotics I do not trade anchored VWAP.
Choosing the anchor: the only skill that matters
Anchor selection is the whole craft. Brian Shannon called it both a skill and an art, and on a funded account a bad anchor is worse than no anchor at all. I use five anchor types, in order of reliability, and I never anchor to a bar just because it looks important on my chart.
| Anchor type | When I use it | What it tracks | Reliability |
|---|---|---|---|
| Swing low / swing high | The turn that started the move I am trading | Average cost of everyone who joined the trend | Highest |
| Breakout candle | A range breaks with momentum | Cost basis of the breakout buyers | High |
| News impulse (CPI, FOMC, NFP) | A macro event reprices the pair | Institutional average cost after the event | Highest |
| Earnings / gap day | Indices and stocks, rarely forex | Acceptance or rejection of the new value | High |
| Session / week open | Only when nothing better exists | Calendar average, not an event average | Low |
My rule is simple: the anchor must be a moment when a lot of volume changed hands and market memory is strong. A swing low that printed on three times normal volume qualifies. A random Tuesday 14:00 bar does not. I also keep the count low: one primary AVWAP from the main trend anchor, plus one tactical AVWAP from the latest breakout or news event.
One more rule, learned the expensive way: never move an anchor after the trade is on. The moment you drag the line to fit the trade you wanted, it stops being a measurement and becomes a decoration. If the anchor was wrong, close the trade, not the line.
My settings for a funded account
Anchored VWAP has almost no settings, which is part of its charm. There is no period to optimise and no oscillator to tune. The settings that exist are about what surrounds the line: the standard deviation bands, anchor hygiene, and the timeframe discipline that keeps the tool inside prop firm rules.
| Setting | My value | Why |
|---|---|---|
| Price source | HLC3 (High + Low + Close) / 3 | Industry default, matches every platform |
| SD bands | +1 and +2 sigma, both sides | 1 sigma is the value zone, 2 sigma is the stretch zone |
| Anchors on chart | Maximum 2 at once | More lines means more excuses to trade |
| Anchor expiry | Remove after 20 trading days | Old anchors track dead money |
| Execution timeframe | H1 for entries, H4 for the anchor | Anchor on the higher timeframe, trade on the lower |
| Risk per trade | 0.5 percent of the account | 500 dollars on a 100,000-dollar account |
| Max trades per day | 2 anchored VWAP trades | Keeps me inside my personal daily stop |
The standard deviation bands deserve a line of their own. One sigma above and below the AVWAP is where price spends most of its time, and it is where I look for pullback entries. Two sigma is the stretch zone: price reaching there is either a strong trend or an exhausted move, and I never chase into it.
How I read the signals
Anchored VWAP gives me three signals, and I only trade two of them. The third one exists to keep me out of trouble.
First, the pullback to the line. In an uptrend, with price above a rising AVWAP anchored to a swing low, I wait for price to dip back to the line and hold. The entry is the first H1 close back above the line after the touch, the stop goes below the line by one average true range of room, and the target is the +1 sigma band or the recent high. This is my bread-and-butter trade, and it is a cousin of the trend pullback strategy I already trade, with the AVWAP replacing the moving average as the value line.
Second, the reclaim. When price loses the AVWAP, closes below it, and then reclaims it with a strong H1 close, the reclaim is a fresh long signal, because the sellers who pushed price under the average just got trapped. The stop goes below the reclaim candle, which is usually tight, and the target is the +1 sigma band. I only take reclaims when the higher timeframe trend agrees, and never against a falling H4 AVWAP.
Third, the rejection, which I do not trade. When price rallies to an AVWAP anchored to a major high and stalls there three times, that is distribution, not a short signal. I watch it, I note it, and I stay flat. The rejection tells me where not to be long. That is enough.
My worked trade: a 2.5R GBPUSD long off the Monday-low anchor
Here is the trade from the week I stopped trusting session VWAP. Monday, GBPUSD printed a swing low at 1.2620 on the London open with the heaviest volume of the week, and I anchored a VWAP there. By Wednesday the line had risen to 1.2680 and the morning dip touched the line and held. I entered long at 1.2685 on the first H1 close back above the line.
| Trade leg | Price / size | Maths |
|---|---|---|
| Anchor | Monday swing low 1.2620 | Heaviest volume of the week, real turn |
| Entry | Long 1.2685, 1.6 lots | First H1 close back above the AVWAP |
| Stop loss | 1.2655, 30 pips below entry | Below the AVWAP plus room |
| Risk | 500 dollars planned, 480 actual | 500 / (30 x 10) = 1.66, rounded to 1.6 lots |
| TP1 (half off) | 1.2735, +50 pips | 0.8 lots x 50 pips x 10 dollars = +400 dollars |
| TP2 (rest off) | 1.2785, +100 pips | 0.8 lots x 100 pips x 10 dollars = +800 dollars |
| Total | +1,200 dollars | 1200 / 480 = 2.5R |
The sizing is the same maths in my position sizing guide: risk divided by stop distance in pips times pip value. A 30-pip stop on a 500-dollar budget is 1.66 lots, rounded down to 1.6 lots and 480 dollars of real risk.
| Stop distance | Lots (rounded down) | Real risk |
|---|---|---|
| 15 pips | 3.3 | 495 dollars |
| 20 pips | 2.5 | 500 dollars |
| 25 pips | 2.0 | 500 dollars |
| 30 pips | 1.6 | 480 dollars |
| 40 pips | 1.2 | 480 dollars |
| 50 pips | 1.0 | 500 dollars |
Notice what the table quietly says: a wider stop does not mean more risk, it means fewer lots. The risk stays at 500 dollars or below on every row. That is why I check the max daily drawdown calculator before any swing trade that might run overnight: one 480-dollar loss is 9.6 percent of my 5,000-dollar daily limit.
I tested it: twelve trades with and without the anchor filter
I do not trust an indicator until I have traded it both ways. For six weeks I logged every anchored VWAP setup on GBPUSD and EURUSD, twelve trades with the anchor filter on, and the same twelve setups traded blind, taking every pullback to the session VWAP whether an anchor agreed or not. Same risk, same 0.5 percent, same stop rules.
| Test | Trades | Win / loss | Net result |
|---|---|---|---|
| With anchor filter | 12 | 8 wins, 4 losses | 4 x 2.5R + 4 x 1R – 4 x 1R = +10R = +4,800 dollars |
| Without filter (session VWAP only) | 12 | 6 wins, 6 losses | 6 x 1.25R – 6 x 1R = +1.5R = +720 dollars |
| Filter value | – | – | +4,080 dollars over twelve trades |
| Best single trade | – | +1,200 dollars | 25 percent of the filtered net, inside the 30 percent ceiling |
| Five-trade slice (filtered) | 5 | +1200 -480 +600 +400 +1200 | +2,920 dollars = 6.1R |
Two things matter in that table. First, the filter found better winners, not more of them: the average win rose from 1.25R to 1.75R because the anchor kept me in trades that had a real reason to run. Second, the best trade was 25 percent of the net profit, inside the consistency rule ceiling of 30 percent.
The honest caveat: twelve trades is a small sample. I am not claiming the filter is worth 4,080 dollars every twelve trades forever, only that it was worth that much in the only test I have run.
When anchored VWAP fails
Anchored VWAP fails in exactly the situations where every trend tool fails, and it fails a little worse in one of them because the line looks so authoritative that traders keep trusting it after it has stopped working.
| Failure mode | What it looks like | My fix |
|---|---|---|
| Stale anchor | Line from a 3-week-old low, price chopping across it | Remove anchors older than 20 trading days |
| Range-bound market | Price crossing the line 5 times a day | Stand down, no AVWAP trades in a range |
| News spike through the line | CPI candle blows 60 pips past the AVWAP | Never anchor a trade in the first 30 minutes after news |
| Wrong anchor, right line | Line looks perfect in hindsight, useless live | Anchor before the move, never after it |
| Thin exotic pairs | Tick volume lies, line wobbles | Majors only, never exotics |
The stale anchor is the one that cost me money. I once kept an AVWAP anchored to a low from a month earlier because the line kept “working” as resistance, right up until it did not, and a long off that line lost 480 dollars in an afternoon. The market had moved on. Twenty trading days is my expiry now, no exceptions, and I delete the anchor the day it expires even if the trade is still open.
Frequently asked questions
Is anchored VWAP better than session VWAP?
Neither is better, they answer different questions. Session VWAP tells you today’s average price, anchored VWAP tells you the average price since an event you chose. I use session VWAP for intraday timing and anchored VWAP for swing levels. If you hold trades for days, anchored VWAP matters.
What is the best anchor point?
A swing high or swing low with heavy volume, or a news impulse candle like CPI or FOMC. The anchor must be a moment when market psychology genuinely shifted and a lot of volume changed hands. A random bar is not an anchor.
Can I use anchored VWAP on a prop firm account?
Yes, it is a standard indicator on TradingView, MT4 and MT5, and no firm bans it. The prop firm angle is risk, not permission: use 0.5 percent risk per trade and keep stops below the line.
How many anchored VWAPs should I have on one chart?
Two at most: one primary from the main trend anchor and one tactical from the latest breakout or news event. Delete any anchor older than 20 trading days.
Does anchored VWAP work in forex without real volume?
It works on majors because tick volume tracks real volume closely enough. The line is a proxy, not a perfect measure, and I would not trust it on thin exotics where tick volume is noisy. Stick to EURUSD, GBPUSD, USDJPY and the major indices.
What is the biggest mistake traders make with anchored VWAP?
Moving the anchor to fit the trade. The moment you drag the line to where you wish it was, it stops being a measurement and becomes a decoration. If the anchor was wrong, close the trade. The second biggest mistake is trading every touch of the line in a range.
Risk disclaimer: this article describes how I trade my own funded account. It is not financial advice. Prop firm rules change, and a strategy that fits one firm’s drawdown model can breach another’s. Test on a demo account first.



