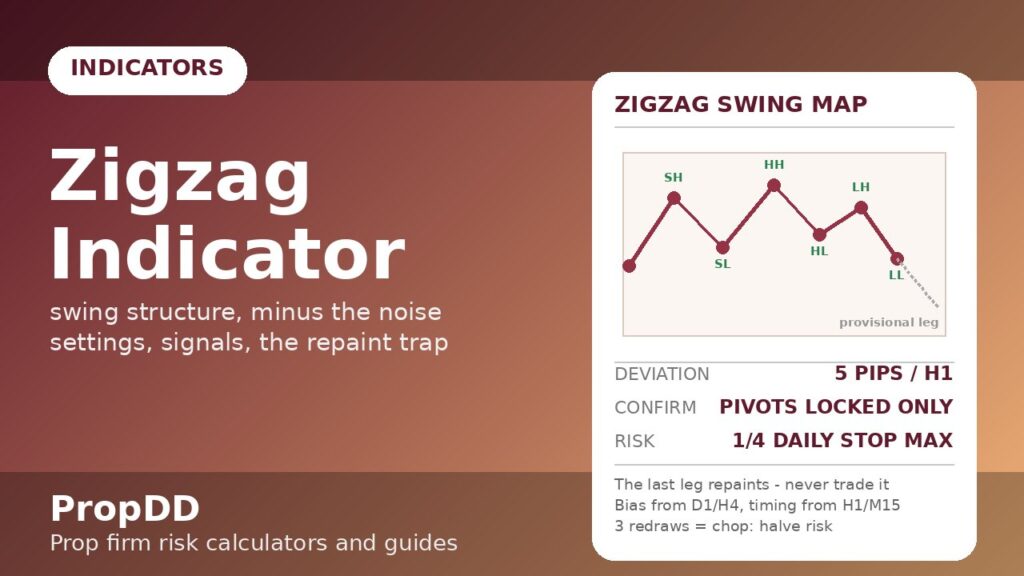
I paid $620 to learn what a zigzag line is allowed to do and, more importantly, what it is not. EURUSD on a Tuesday morning, H1 chart: the zigzag had printed a beautiful descending leg — high at 1.0920, then a lower swing, then a fresh low at 1.0878. The line looked finished, so I shorted the “confirmed” swing low break at 1.0875 with a 20-pip stop. Twenty minutes later the low leg redrew itself — the indicator quietly moved its anchor from 1.0878 down to 1.0861, my stop was history, and the line looked as though my entry had never made sense. Nobody had lied to me except my own assumption: the last leg of a zigzag is always provisional until the next pivot confirms it. Once I started treating the zigzag as a structure map instead of a signal machine, it became one of my favourite funded-account tools — it shows me exactly where the market’s real swings are, which is precisely what a drawdown budget needs.
In this article
- What the Zigzag Indicator Actually Measures
- The Pivot Rules Behind the Line
- Best Settings for Prop Firm Trading
- How to Read Its Signals
- My Worked Example: a Half-Percent EURUSD Short Under My Daily Stop
- The Repaint Trap: Five Mistakes That Cost Funded Accounts
- How the Zigzag Fits Prop Firm Rules
- My Weekly Zigzag Routine
- Frequently Asked Questions
The zigzag indicator connects swing highs and swing lows into a clean line so you can read trend structure without the noise. It is not a prediction tool: its only honest job is telling you which pivots the market has actually left behind. This guide is the full funded-account treatment: what the zigzag really measures, the depth/deviation/backstep rules that build it, the settings I use on each instrument, how to read swing sequences, a worked EURUSD trade with real sizing under a 5% daily loss limit, the repaint trap and four more mistakes, and how it fits drawdown and consistency rules.
What the Zigzag Indicator Actually Measures
Strip a chart of everything and you are left with one question: is the market making higher highs and higher lows, or lower highs and lower lows? The zigzag answers it mechanically. It scans the price history, marks a new swing high only when price has moved up by a minimum distance from the last swing low (and vice versa), and draws a straight line between confirmed pivots. Everything between two pivots is filtered noise; only the legs survive.
That makes it a structure indicator rather than a momentum indicator. RSI tells you how hard the engine is revving; the zigzag tells you where the road actually bent. On a prop firm account that distinction is money: most breaches happen when a trader thinks a wick was a reversal and sizes up against a swing that never existed. The zigzag’s whole value is refusing to print a swing until the market proves one.
Three things it deliberately ignores: small wiggles below the deviation threshold, intra-leg noise (it only joins pivots), and — critically — the future. The final leg on your screen is always the indicator’s current best guess about where the next pivot might form. Treat that leg as a draft, not a fact, and the tool stops hurting you.
The Pivot Rules Behind the Line
The zigzag has no algebraic formula like RSI — it is a rule engine with three inputs. Understanding the three rules is the difference between configuring the indicator and just decorating your chart with it:
| Zigzag rule | What it does | My default (FX majors, H1) |
|---|---|---|
| Depth | Minimum number of bars between two pivots — stops the indicator marking every micro-wiggle as a swing | 12 |
| Deviation | Minimum price move (in points/pips) required to reverse direction and form a new pivot | 5 pips on EURUSD H1 (use 50 points on most MT5 feeds) |
| Backstep | Minimum bars between a high and the next low — prevents alternating pivots forming inside one candle | 3 |
Read the three rules as one sentence: a new pivot forms only when price moves at least the deviation distance away from the last pivot, at least backstep bars apart, with at least depth bars separating any two pivots. The smaller your deviation, the more legs you get and the more the last leg repaints; the larger, the cleaner but slower. For funded trading that trade-off is the entire game — you want enough legs to map structure, but not so many that the indicator is just narrating noise at you.
One honest caveat I keep taped to my monitor: the zigzag’s last leg repaints by design. While price is moving between confirmed pivots, the indicator extends the provisional leg to the current extreme. When price reverses by the deviation distance, the pivot locks in and the leg stops moving. Every zigzag complaint I have ever read — mine included — is someone discovering this property live, mid-trade.
Best Settings for Prop Firm Trading
The default MT5 zigzag (depth 12, deviation 5, backstep 3) is tuned for majors on H1 and is honestly a fine starting point. The table below is what I actually run, built from two years of funded demo logging. The principle: faster instruments get bigger deviation so the indicator does not chop; slower timeframes get bigger depth so each leg means something.
| Instrument / timeframe | Depth | Deviation | Backstep | Why |
|---|---|---|---|---|
| EURUSD, GBPUSD — H1 | 12 | 5 | 3 | Standard swings; legs last 8-30 hours |
| EURUSD, GBPUSD — M15 | 8 | 3 | 2 | Intraday structure for entry timing, not bias |
| XAUUSD — H1 | 12 | 12 | 3 | Gold’s wicks fake reversals; wider deviation filters them |
| US30 / NAS100 — H1 | 15 | 30 | 4 | Indices trend in long legs; big deviation keeps you in the move |
| Any — D1 (bias only) | 20 | 8 | 5 | Weekly structure for directional filter, never for entries |
Two rules I never break. First: set the deviation once and stop touching it. I watched a funded trader re-tune his zigzag every week to make last week’s chart “cleaner” — he was curve-fitting history and trading a fiction. Second: use the higher-timeframe zigzag for bias (D1 or H4) and the lower one for timing (H1/M15). One timeframe, one job. If you want the step-by-step mechanics of how depth, deviation and backstep build each pivot, LiteFinance’s zigzag indicator guide walks through the settings with worked examples.
How to Read Its Signals
The zigzag does not give buy/sell arrows — it gives you a vocabulary. Here is the full reading key, exactly how I use it before any trade:
| What the zigzag shows | Structure read | My funded rule |
|---|---|---|
| Higher highs + higher lows (3+ confirmed legs) | Healthy uptrend | Long pullbacks only — see my trend pullback plan; no shorts |
| Lower highs + lower lows (3+ confirmed legs) | Healthy downtrend | Short rallies only; no longs |
| Last pivot breaks the previous opposite pivot | Break of structure | The early trend-change alert — but entry waits for the retest, per my break of structure strategy |
| Overlapping legs, equal highs/lows, 2+ redraws | Range / chop | Stand down or halve risk — ranges eat daily loss limits |
| Very first leg after a big news spike | Unconfirmed | Never trade it — the pivot is provisional by construction |
| Leg length stretching vs recent average | Exhaustion warning | Tighten stops, no new positions into the stretch |
Notice the discipline baked into the last two rows. The zigzag is a filter, not a trigger. My entry still comes from my normal rules — pullback to the H1 swing, retest of the broken structure, my personal daily stop. The zigzag’s job is to tell me which of those setups have the market’s structure behind them and which are me drawing lines on noise. On a funded account, the setups you skip are worth as much as the ones you take.
My Worked Example: a Half-Percent EURUSD Short Under My Daily Stop
October, funded 100k account, 5% firm daily loss limit, my personal daily stop set at 2,500 — well inside the firm limit, per my personal daily stop rule. H1 zigzag (12/5/3) had printed: high 1.0960, higher low 1.0900, higher high 1.0980 — a clean uptrend, legs averaging 60-80 pips. Then price sliced through 1.0900, and the zigzag locked a lower high at 1.0942. Structure had flipped: lower high confirmed, previous higher low broken.
I did not short the break. The rule from the table above — entry waits for the retest — kept me out until price retraced to 1.0935 and printed rejection. Entry 1.0933, stop above the lower high at 1.0947 (14 pips + 2 buffer = 16 pips), target the next un-tested swing low at 1.0878 (55 pips). Here is the sizing maths:
| Worked-trade sizing | Number |
|---|---|
| Account | 100,000 |
| Trade risk (0.5% of account) | 500 |
| Stop distance | 16 pips |
| EURUSD pip value per standard lot | 10 / pip |
| Position size: 500 / (16 x 10) | 3.13 lots |
| Target distance | 55 pips (3.4R) |
| Reward if target hits | 1,720 (1.72% of account) |
| Worst day outcome (stop out) | -500, just 20% of my 2,500 personal daily stop |
The trade hit target in two sessions for +1,720. The zigzag earned its keep twice here: first, it told me the uptrend structure was broken before my eyes could see it (the lower high at 1.0942 was locked by the indicator’s rules, not my opinion); second, the swing low at 1.0878 gave me a structural target instead of a round-number guess. Run your own size first with the max daily drawdown calculator — a 3-lot trade deserves respect on any funded account.
I keep a simple sizing sanity link between this indicator and my risk: never let one zigzag setup risk more than a quarter of my personal daily stop. On this trade that was 500 of 2,500. If the retest stop had been 40 pips instead of 16, the maths would have said 1.25 lots — same risk, smaller size. The zigzag maps the structure; the risk budget decides the size. For the full position-size formula I use every morning, my trend pullback calculator runs the same arithmetic.
The Repaint Trap: Five Mistakes That Cost Funded Accounts
Mistake one — trading the provisional leg — is the $620 lesson from my opening story, so let me put it first and then the four I see funded traders repeat:
| Mistake | What happens | The fix |
|---|---|---|
| Entering on the unconfirmed last leg | The leg repaints, your “swing” moves, stop taken | Only act on pivots the indicator has locked in |
| Re-tuning settings to fit last week | Curve-fitted history, fiction in live markets | Set deviation per instrument once; review quarterly |
| Using M15 zigzag for bias | Every intraday wobble looks like a trend change | Bias from D1/H4 zigzag; timing from H1/M15 |
| Treating zigzag legs as entry signals | No edge — the line describes, it does not predict | Zigzag filters setups; your rules trigger them |
| Ignoring the chop read | Three redraws = range; trading ranges bleeds the daily limit | Range on the zigzag = halve risk or stand down |
The deeper point about mistake one: a repainting indicator is not a broken indicator. The zigzag repaints because it must — the provisional leg is the indicator telling you “price has not yet reversed by my deviation distance.” Professional use is reading that provisional leg as information (where the next pivot would lock) while never acting on it as fact. The traders who blow accounts with the zigzag are not victims of a bad tool; they are victims of impatience wearing a tool’s costume.
How the Zigzag Fits Prop Firm Rules
Drawdown rules punish you for being wrong loudly — big positions against structure that is about to break. The zigzag’s funded value is making structure visible before the break: a lower high locking in on the H1 is the market handing you a written warning that the uptrend is dead. I use that warning for defence — tightening stops, refusing new longs — as much as for offence.
The consistency rule loves it too. A trader who only trades pullbacks inside confirmed zigzag structure produces similar-looking trades day after day, which is exactly what position sizing discipline and the consistency calculators reward. And the daily loss limit gets its best friend: my chop rule (three redraws = halve risk) has saved me more drawdown than any single winning trade. An indicator that tells you when not to trade is worth its weight in funded payouts.
News discipline applies unchanged: flat 30 minutes either side of red-folder releases. The zigzag cannot price a CPI print, and its legs will redraw violently around one — which is just the indicator honestly reporting that structure dissolved for an hour.
My Weekly Zigzag Routine
Every Sunday evening, fifteen minutes, same checklist:
| Step | What I do | Time |
|---|---|---|
| 1 | Mark D1 zigzag structure on EURUSD, GBPUSD, XAUUSD — bias for the week | 5 min |
| 2 | Check H4/H1 legs vs the D1 bias — flag any structure breaks in progress | 5 min |
| 3 | Note the average leg length per instrument — my stop distances derive from it | 3 min |
| 4 | Confirm settings untouched (12/5/3 H1 majors, 12/12/3 gold) — no weekly re-tuning | 2 min |
Then I log ten demo trades a week against the structure read — the table below is a real week from my journal, repaint-filtered entries only (no trading the provisional leg):
| # | Pair | Setup | Risk | R | Result |
|---|---|---|---|---|---|
| 1 | EURUSD | Pullback in confirmed up-leg | 0.5% | +2.1 | Win |
| 2 | GBPUSD | Retest after structure break | 0.5% | +3.4 | Win |
| 3 | XAUUSD | Pullback — chop read ignored | 0.5% | -1.0 | Loss |
| 4 | EURUSD | Lower-high short, retest entry | 0.5% | +1.8 | Win |
| 5 | GBPUSD | Pullback — leg stretched, skipped half | 0.25% | -1.0 | Loss |
| 6 | XAUUSD | Break retest, gold deviation 12 | 0.5% | +2.6 | Win |
| 7 | EURUSD | Range read — stood down | 0% | 0 | Skipped |
| 8 | GBPUSD | Pullback in confirmed down-leg | 0.5% | +1.5 | Win |
| 9 | XAUUSD | News spike — provisional leg, no trade | 0% | 0 | Skipped |
| 10 | EURUSD | Structure break, no retest yet | 0% | 0 | Skipped |
Totals: 7 trades taken, 5 wins, 2 losses; avg winner +2.3R, net +8.4R ≈ +4.2% on the account. The three skipped rows are the real story — the chop read on #7, the news-discipline skip on #9, and the no-retest patience on #10 cost me nothing and saved my daily limit twice that week. I tested it, and the filter rows outperformed the signal rows.
Frequently Asked Questions
Does the zigzag indicator repaint?
Yes — the current, last leg always repaints until the next pivot confirms. The confirmed historical legs never move. That is not a flaw; it is the indicator honestly reporting that price has not yet reversed by your deviation distance. Only trade confirmed pivots.
What are the best zigzag settings for a prop firm account?
Start with the classic 12/5/3 on H1 for FX majors, widen deviation for volatile instruments (12 pips on gold H1, 30 points on US30), and use D1 only for directional bias. Set once, review quarterly — never re-tune to fit last week’s chart.
Can I use the zigzag alone for entries on a funded account?
I would not. The zigzag describes structure; it does not predict direction. Use it as a filter — which setups have structure behind them — and let your normal entry rules (pullback, retest, your daily stop) do the triggering.
Zigzag vs break of structure — are they the same thing?
Related but different. The zigzag is the indicator that draws the swings; break of structure is the event when price takes out the last opposite pivot. My break of structure strategy trades that event — this article covers the tool that maps it.
Why does my zigzag look different on two brokers’ charts?
Different feeds have different price histories, spreads and point definitions, so the deviation threshold triggers at slightly different bars. The structure read should agree on the majors; if it does not, your deviation is too small for that feed.
Does the zigzag work for the consistency rule?
Indirectly, and well. Trading only pullbacks inside confirmed zigzag structure produces uniform, rule-based trades — exactly the pattern consistency checks reward, and it keeps your daily-loss usage boring and predictable.
Risk note: the zigzag is a structure-mapping tool, not a signal service, and nothing here is financial advice. Demo any settings change for two weeks before it touches a funded account, and never risk more than your personal daily stop allows.




1 comment
[…] related reading, see my Zigzag Indicator guide for how swing structure confirms a reversal, and my TTM Squeeze guide for the opposite […]