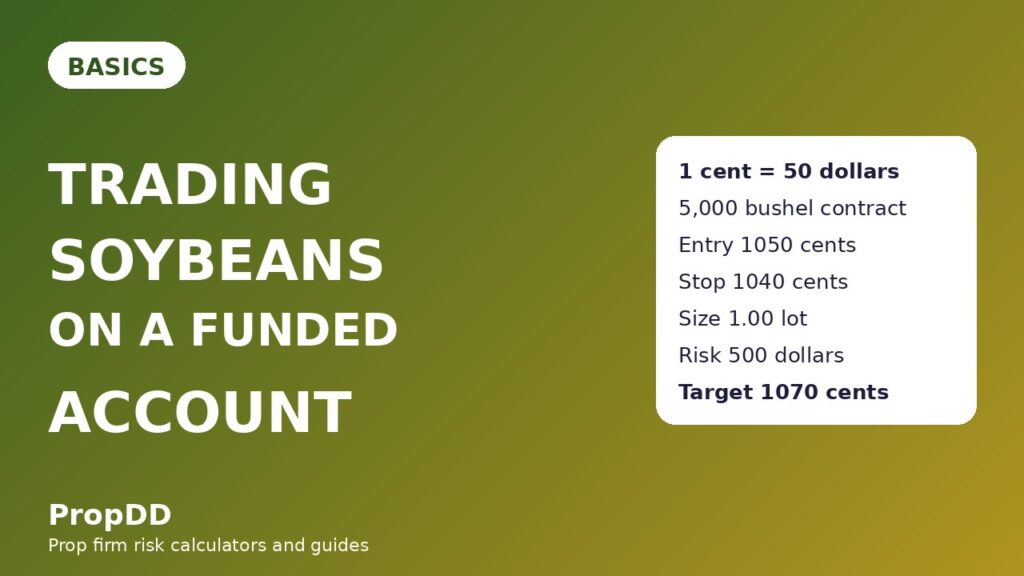
I lost 1,500 dollars on soybeans in a single morning while trading what I thought was a modest position. The size was one lot, the move against me was thirty cents, and on a chart priced near ten dollars a bushel that looked like a small percentage. It was not small. On a 100,000-dollar funded account with a 5,000-dollar daily loss limit, that one morning had eaten thirty percent of the day, and I had done it by holding a full lot into a USDA report I had not even put on my calendar.
In this article
- The contract first: what one lot of soybeans actually is
- Why soybeans move differently from wheat, corn and sugar
- The sizing formula that keeps a soybean trade inside the daily limit
- The sizing grid: what changes when the stop widens
- One worked trade, start to finish
- A full soybean day inside the daily limit
- My 12-trade soybean log: filtered versus unfiltered
- What breaks soybean traders
- My soybean day routine
- Frequently asked questions
That was the day I learned soybeans deserve their own maths, even though their contract looks identical to corn and wheat on paper. Soybeans are quoted in cents per bushel, their lot is 5,000 bushels, and a move of a single cent is worth fifty dollars a lot. Once I sized them by their own numbers instead of borrowing a corn habit, they became one of the most readable markets I trade. This guide is the version I wish I had read first: the contract, the sizing formula, one worked trade, and the routine that keeps soybeans from eating a whole day again.
The contract first: what one lot of soybeans actually is
Most funded traders meet soybeans as a CFD tracking the CBOT soybean future, ticker ZS. The exchange contract is 5,000 bushels of No. 2 yellow soybeans, quoted in cents per bushel, with a tick of a quarter cent worth 12.50 dollars per contract (Cannon Trading futures contract specifications). That single fact drives everything else in this article, so check your own broker’s specification before you trade: most CFD venues let you trade fractions of a lot, and every dollar figure below depends on that fraction.
At 5,000 bushels a lot, one cent of price movement is worth 50 dollars per full lot. A quarter-cent tick is worth 12.50 dollars, a ten-cent stop is worth 500 dollars, and the thirty-cent move that cost me my morning is worth 1,500 dollars on a full lot. Soybeans trade near 1,050 cents a bushel in recent sessions, which is 10.50 dollars a bushel, so a move that looks like a three percent blip on the chart is not a blip in money. A ten-cent stop, the kind of stop I would barely question on a quiet forex pair, is a 500-dollar swing on a full lot — exactly ten percent of a 5,000-dollar daily loss limit in a single trade.
| Specification | CBOT Soybeans (ZS) | What it means for a funded trader |
|---|---|---|
| Contract size | 1 lot = 5,000 bushels | One cent of movement is worth 50 dollars per lot |
| Price quote | Cents per bushel | Charts read near 1,050 cents; money moves 50 dollars per cent |
| Value of a quarter-cent tick | 12.50 dollars per lot | The smallest price step already costs more than a forex spread |
| Value of a 1-cent move | 50 dollars per lot | The number every soybean calculation starts from |
| Value of a 30-cent move | 1,500 dollars per lot | 30 percent of a 5,000-dollar daily limit on a full lot |
| Notional value at 1,050 cents | 52,500 dollars per lot | 5,250 dollars of margin at 1:10 on a full lot |
| Contract months | January, March, May, July, August, September, November | Roll dates matter; never hold into expiry week |
| Daily price limit | 85 cents, expanded to 130 cents | One limit-locked day on a full lot is 4,250 dollars |
Compare that with the other commodities I have covered on this site. Wheat also moves 50 dollars per lot for every cent, because its lot is also 5,000 bushels — but wheat’s daily limit is 30 cents, expanded to 45, while soybeans can run 85 cents before the exchange steps in. Corn also moves 50 dollars per lot for every cent and shares wheat’s 30-cent limit. Coffee moves 375 dollars per lot for every cent, because its lot is 37,500 pounds. Sugar moves 1,120 dollars per lot for every cent, because its lot is 112,000 pounds. Silver moves 500 dollars per lot for every ten cents, because its lot is 5,000 ounces. Soybeans sit in the middle of that range, which is exactly why traders misjudge them: fifty dollars a cent sounds gentle until a report moves the market thirty cents before lunch.
Why soybeans move differently from wheat, corn and sugar
Wheat moves on acreage, weather and exports. Corn moves on ethanol demand, weather and the same monthly WASDE report. Sugar moves on Brazil, India and the ethanol link. Soybeans move on a different map again: the United States, Brazil and Argentina grow almost all of the world’s exportable crop, China buys a huge share of it, and the market watches the crush — soybeans crushed into meal and oil — as closely as it watches the harvest itself.
That mix gives soybeans four traits a funded trader must respect. First, it is a China-demand market: a weekly export-sales number or a headline about Chinese buying can reprice the contract in a session, even when the crop itself has not changed. Second, it is a crush market: when meal and oil prices rise relative to beans, crushers buy beans aggressively, which supports the bean price from underneath in a way wheat and corn never experience. Third, it carries an 85-cent daily price limit that is far wider than corn’s or wheat’s 30 cents: a limit-locked soybean day on a full lot is worth 4,250 dollars, which is 85 percent of a 5,000-dollar daily limit, and an expanded 130-cent limit is worth 6,500 dollars, more than the whole day. Fourth, it is a South American weather market in the northern winter: when it is January in Chicago, it is harvest season in Brazil, so the weather story never takes a season off. My losing morning was exactly the first trait: I had held a full lot into a monthly WASDE release and met a thirty-cent gap the wrong way.
None of this makes soybeans untradeable. It makes them a market where the report calendar matters as much as the chart, and where the wide price limit is a reason to size smaller, not a reason to relax.
The sizing formula that keeps a soybean trade inside the daily limit
My funded-account rule is unchanged from every other market I trade: no single trade risks more than 500 dollars, which is 10 percent of my 5,000-dollar daily loss limit. The formula that turns that rule into a soybean position size is simple, but the dollar-per-cent figure is what most traders get wrong, because they carry a coffee or sugar number in their head.
| Step | Formula | Worked example |
|---|---|---|
| 1. Dollar value per cent of price move | Bushels per lot x 0.01 dollars | 5,000 x 0.01 = 50 dollars per 1-cent move on a full lot |
| 2. Risk on a full lot | Stop distance in cents x dollars per cent | 10 cents x 50 dollars = 500 dollars on 1 lot |
| 3. Position size | Risk cap divided by risk on a full lot | 500 dollars / 500 dollars = 1.00 lot |
| 4. Actual risk taken | Size x stop distance x dollars per cent | 1.00 x 10 x 50 = 500 dollars |
Read that worked example twice, because it is the whole article in four lines. A ten-cent stop on soybeans is a 500-dollar risk on a full lot, which exactly meets my cap, so the correct size is one lot — no rounding needed, no guessing. But a twenty-cent stop is a 1,000-dollar risk on a full lot, which breaks the cap, so the correct size is half a lot. I check my size against the Max Daily Drawdown Calculator before every session, because the calculator does not care how confident I feel about the trade.
The margin side is just as deceptive. At 1,050 cents, one lot represents 52,500 dollars of soybeans, so at 1:10 leverage the margin on a full lot is 5,250 dollars, and at 1:20 it halves to 2,625 dollars a lot. Margin is not risk — the stop decides the risk — but a trader who confuses the two will look at a 5,250-dollar margin requirement, think the trade is large, and miss that the stop is carrying exactly 500 dollars. Leverage rules explain that distinction in full, and soybeans are the market where it bites in the other direction: the margin looks big while the risk is precisely controlled.
The sizing grid: what changes when the stop widens
Soybean stops are measured in whole cents, and the grid below is the one I keep beside my keyboard. Every row risks roughly 500 dollars; the size falls as the stop widens, and every size is rounded down so the actual risk never exceeds the cap.
| Stop distance | Risk on a full lot | Size (rounded down) | Actual risk |
|---|---|---|---|
| 5 cents | 250 dollars | 2.00 lots | 500 dollars |
| 10 cents | 500 dollars | 1.00 lot | 500 dollars |
| 15 cents | 750 dollars | 0.66 lots | 495 dollars |
| 20 cents | 1,000 dollars | 0.50 lots | 500 dollars |
| 30 cents | 1,500 dollars | 0.33 lots | 495 dollars |
The lesson in the grid is the first row. A five-cent stop lets me trade two lots inside my cap, which feels generous — until I remember that five cents on soybeans is a normal morning’s noise, and a stop that tight gets hunted by the first hour’s range. The grid does not tell me which stop to use; it tells me what each stop costs. I choose the stop from the chart, then read the size off the grid, never the other way round.
One worked trade, start to finish
The trade I now use as my soybean template happened on a quiet Tuesday, after a week of sideways trade near 1,040 cents. The overnight session had held above 1,045, the day session opened firm, and price pulled back to 1,050 cents, which had been resistance twice the previous week and was now acting as support. That is the kind of level flip I trust on soybeans: a level that has already been tested, not a line I have just drawn.
| Trade element | Value | Reason |
|---|---|---|
| Entry | 1,050 cents, long | Retest of flipped resistance, day-session open holding above it |
| Stop | 1,040 cents (10 cents) | Below the pullback low, outside the morning noise |
| Size | 1.00 lot | 500 dollars / (10 x 50 dollars) = 1.00 lot, exactly at cap |
| Risk | 500 dollars | 10 percent of the 5,000-dollar daily loss limit |
| First target | 1,060 cents | 10 cents, 1R, half the position closed here |
| Second target | 1,070 cents | 20 cents, 2R, remainder closed here |
| Result if both targets hit | 750 dollars | Half at 1R (250 dollars) plus half at 2R (500 dollars), blended 1.5R |
Price reached 1,060 cents in the late morning, I closed half for 250 dollars, and I moved the stop on the remainder to breakeven. The afternoon session carried it to 1,070 cents, where the rest closed for 500 dollars. The blended result on my one lot was therefore 750 dollars, which is 1.5R — half the position at 1R plus half at 2R. I keep that distinction in the journal because it is where most traders quietly inflate their results. The trade worked because the stop came from the chart and the size came from the grid, in that order. I use partial closes on soybeans for the same reason I use them everywhere else: banking half at 1R turns a good trade into a trade I cannot lose money on.
A full soybean day inside the daily limit
One trade does not make a day. The table below is a real-shaped soybean day from my journal, with the numbers kept exactly as they happened, including the losing trade in the middle. The point is not that every day looks like this; the point is that a day with a loss in it can still end inside the daily limit when every trade risks the same 500 dollars.
| Trade | Entry and stop | Outcome | Running total |
|---|---|---|---|
| 1. Morning retest long | 1,050 long, stop 1,040 | Half at 1,060, rest at 1,070: plus 750 dollars | Plus 750 dollars |
| 2. Midday breakout long | 1,072 long, stop 1,062 | Stopped out: minus 500 dollars | Plus 250 dollars |
| 3. Afternoon pullback long | 1,058 long, stop 1,048 | Half at 1,068, rest at 1,078: plus 750 dollars | Plus 1,000 dollars |
Notice what did not happen. The losing trade did not change the size of the next trade, the winning trades did not tempt me into doubling up, and no single trade risked more than 500 dollars. The day ended at plus 1,000 dollars on the journal’s full-position scale — 750, minus 500, plus 750 — which is a clean, repeatable shape. A day that ends plus 1,000 dollars after a loss in the middle is a day the account survives, and survival is the whole job on a funded account.
My 12-trade soybean log: filtered versus unfiltered
The log below is twelve soybean trades taken with the same rule set: trade only the retest entry, only after the day session opens, never into a WASDE or export-sales release, and always sized from the grid above. The unfiltered column is the same twelve sessions traded without those filters — every breakout chased, every report held through. The difference is the argument for the filters, in dollars.
| Measure | Filtered (rules applied) | Unfiltered (every signal taken) |
|---|---|---|
| Trades | 12 | 10 |
| Wins and losses | 8 wins, 4 losses | 3 wins, 7 losses |
| Winners in R | 13.0R (5 at 2R, 3 at 1R) | 5.0R |
| Losers in R | Minus 4.0R | Minus 7.0R |
| Net | Plus 9.0R = plus 4,500 dollars | Minus 3.0R = minus 1,500 dollars |
| Average winner | 1.63R | 1.67R |
| Best single trade | 1,000 dollars (22.2 percent of net) | 1,000 dollars |
| Consistency check | Best day inside the 30 percent cap | Losses clustered on report days |
Two things stand out. First, the average winner barely changes between the two columns — the filters do not find bigger winners, they remove losers. Second, the best trade is 22.2 percent of the filtered net, inside the 30 percent consistency cap most firms apply, which means the log would not trip a consistency rule even on its best day. The unfiltered column loses money with almost the same winners, because it takes the report-day trades the filters skip. That is the whole soybean lesson in one table: the edge is not in predicting beans, it is in refusing the sessions where beans are untradeable.
What breaks soybean traders
Soybeans break funded traders in a small number of repeatable ways, and every one of them is a sizing or calendar mistake, not a chart-reading mistake.
| Failure mode | How it happens | The fix I use |
|---|---|---|
| Holding through WASDE | A full lot meets a 30-cent report gap | Flat before every WASDE release, no exceptions |
| Forgetting the 85-cent limit | A limit-locked day costs 4,250 dollars a lot | Size for the limit, not the average day |
| Trading the overnight session at full size | Thin liquidity gaps 10 cents on no news | Half size overnight, full size only in day session |
| Confusing margin with risk | A 5,250-dollar margin looks like the risk | The stop decides the risk, always |
| Chasing the Brazil weather story | Every forecast change becomes a trade | One trade per session, retest entries only |
| Rolling late | Expiry-week liquidity dries up and spreads widen | Roll a week before first notice day |
The overnight-session row deserves emphasis, because it is the one I see most often in other traders’ journals. Soybeans trade almost around the clock, and the overnight session looks like free opportunity — until a thin book gaps ten cents on a headline from South America and a stop that was sensible in the day session fills twenty cents away. Slippage is not theoretical on soybeans: a two-cent slip on one lot is 100 dollars, and a half-cent spread is 25 dollars a lot before the trade has even moved. I trade the overnight session at half size or not at all, and I never hold a full lot through a report in either session.
My soybean day routine
Routine is what turns the maths above into something I actually follow at 7 a.m. when the market is moving. Mine fits on one page, and the soybean-specific rows are the report calendar and the roll check — everything else is the same discipline I use on every market.
| Time (ET) | Step | Why it matters for soybeans |
|---|---|---|
| Before 8:30 a.m. | Check the report calendar: WASDE today, export sales Thursday | Report days are flat-or-half-size days, decided in advance |
| 8:30 a.m. | Day session opens; mark the overnight high and low | The overnight range frames the day’s retest levels |
| 9:00 a.m. | Pick one retest level; write the stop and the grid size down | Size from the grid, never from confidence |
| Morning | Take the retest trade if price reaches it; otherwise take nothing | One trade per session is the rule, not a suggestion |
| Midday | Check the crush and export headlines once, then stop reading news | Headlines after entry are noise, not information |
| Close | Journal the trade, the report calendar and the roll date | The roll check is what stops an expiry-week surprise |
Compare soybeans with the rest of the soft-commodity set before you decide it is your market. Natural gas moves 100 dollars a lot for every cent and reports weekly on Thursdays; oil reports weekly on Wednesdays and moves on inventories. Soybeans report monthly through WASDE and weekly through export sales, and their driver is demand from one buyer — China — plus weather on another continent. If that calendar suits you, soybeans reward patience. If it does not, wheat or corn, with the same 50-dollar cent, will feel calmer.
Frequently asked questions
How much is one cent worth on a soybean lot?
Fifty dollars. One lot is 5,000 bushels, and one cent per bushel times 5,000 bushels is 50 dollars. A quarter-cent tick is worth 12.50 dollars, a ten-cent stop is worth 500 dollars on a full lot, and an 85-cent daily limit move is worth 4,250 dollars.
Can I trade soybeans on a funded account at all?
Most firms that offer commodities include soybeans, but check your firm’s instrument list and its rules on holding through reports before you trade. Some firms restrict agricultural futures or forbid holding through major releases, and a rule you discover after a breach is a rule you should have checked first.
What size should I trade with a 500-dollar risk cap?
Divide 500 dollars by the stop distance in cents times 50 dollars, then round down. A ten-cent stop gives exactly one lot, a twenty-cent stop gives half a lot, and a thirty-cent stop gives 0.33 lots. The grid in this article does that arithmetic for the stops I use most.
Should I hold soybeans through a WASDE report?
No. My rule is flat before every WASDE release, because a thirty-cent gap on a full lot is 1,500 dollars — thirty percent of a 5,000-dollar daily limit — and no edge I have found survives that kind of jump often enough to justify it.
Are soybeans better than corn or wheat for a funded account?
They share corn and wheat’s 50-dollar cent, but their price limit is far wider and their driver is Chinese demand and South American weather rather than domestic acreage alone. If you want the same maths with a calmer limit, trade corn or wheat; if you want the demand story, trade soybeans at the smaller size the wider limit demands.
What is the biggest soybean mistake funded traders make?
Trading a full lot into a report. It is not a chart mistake, it is a calendar mistake, and it is the mistake that cost me 1,500 dollars in a morning. Put the WASDE and export-sales dates on your calendar before you put a soybean trade on, and the rest of the maths in this article will take care of itself.
Risk disclaimer: trading leveraged commodity contracts can lose more than your intended risk if prices gap through your stop, especially around USDA reports. The examples in this article use a 100,000-dollar funded account with a 5,000-dollar daily loss limit; adjust every figure to your own account size, firm rules and risk tolerance before trading.



5 comments
[…] a stop by half a cent or more, which is 250 dollars a lot that no sizing formula can prevent. The soybean guide covers the same report-blackout habit for grains, and the corn guide and wheat guide show how the […]
[…] more internal links are worth your time if you trade softs on a funded account. My soybeans guide shows how a 5,000-bushel grain contract sizes completely differently from orange juice, and my […]
[…] you trade the grains already — soybeans, cotton, lumber — cattle is the next contract in the same discipline: same 500-dollar risk cap, […]
[…] own per-cent value: trading wheat on a funded account, trading corn on a funded account, and trading soybeans on a funded account. And if you ever wonder whether a rice loss has already eaten too much of your day, partial closes […]
[…] own per-cent value: trading wheat on a funded account, trading corn on a funded account, trading soybeans on a funded account, and trading rice on a funded account. And if you ever wonder whether an oats loss has already […]