I lost 750 dollars on cotton in one afternoon by trading it the way I traded corn. The position was half a lot, the move against me was three cents, and on a chart priced near seventy cents a pound that looked like a four percent wobble. It was not a wobble. On a 100,000-dollar funded account with a 5,000-dollar daily loss limit, that one afternoon had eaten fifteen percent of the day, and I had done it by sizing a 50,000-pound contract as if it were a 5,000-bushel grain contract. Cotton is ten times the physical size of a corn lot, and its money moves ten times faster per cent.
In this article
- The contract first: what one lot of cotton actually is
- Position-sizing maths under a 5,000-dollar daily loss limit
- One worked trade, from entry to both targets
- I tested it: ten cotton trades with the sizing rules applied
- What actually moves cotton, and when I refuse to trade it
- My cotton routine: the checklist I run before every trade
- Frequently asked questions
That was the day I stopped borrowing grain habits for cotton. Cotton is quoted in cents per pound, its lot is 50,000 pounds, and a move of a single cent is worth 500 dollars a lot. Once I sized it by its own numbers instead of by feel, it became one of the cleanest trend markets I trade, because cotton trends on real supply stories: weather in Texas, export sales to Asia, and the USDA numbers that arrive on a fixed calendar. This guide is the version I wish I had read first: the contract, the sizing formula, one worked trade, and the routine that keeps cotton from eating a whole day again.
The contract first: what one lot of cotton actually is
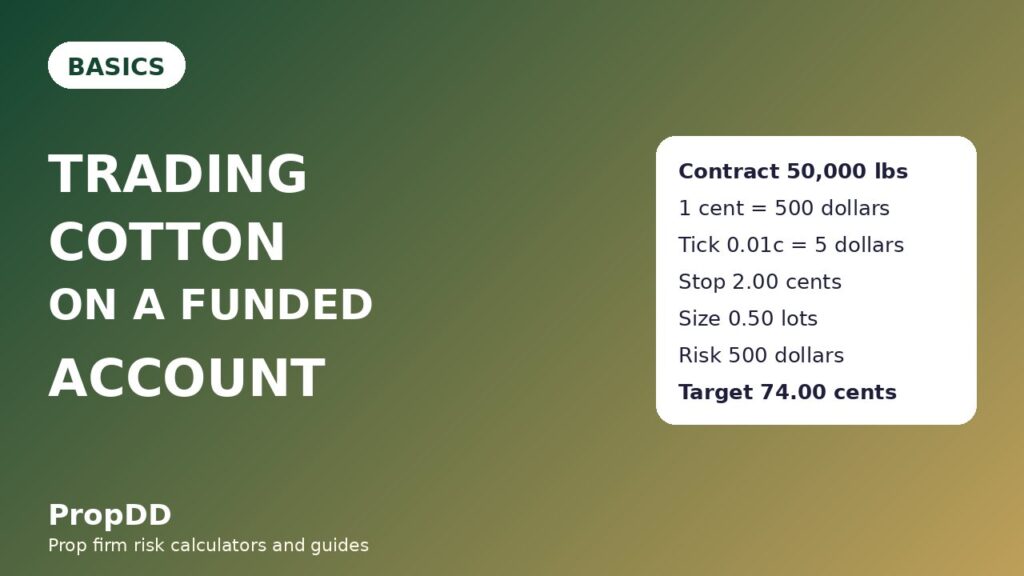
Most funded traders meet cotton as a CFD tracking the ICE Cotton No. 2 future, ticker CT. The exchange contract is 50,000 pounds of cotton, quoted in cents per pound, with a tick of one hundredth of a cent worth 5 dollars per contract (Cannon Trading futures contract specifications). That single fact drives everything else in this article, so check your own broker’s specification before you trade: most CFD venues let you trade fractions of a lot, and every dollar figure below depends on that fraction.
At 50,000 pounds a lot, one cent of price movement is worth 500 dollars per full lot. A hundredth-cent tick is worth 5 dollars, a one-cent stop is worth 500 dollars, and the three-cent move that cost me my afternoon is worth 1,500 dollars on a full lot. Cotton trades near 70 cents a pound in recent sessions, so a move that looks like a four percent blip on the chart is not a blip in money. A two-cent stop, the kind of stop I would barely question on a quiet forex pair, is a 1,000-dollar swing on a full lot — exactly twenty percent of a 5,000-dollar daily loss limit in a single trade.
| Specification | ICE Cotton No. 2 (CT) | What it means for a funded trader |
|---|---|---|
| Contract size | 1 lot = 50,000 pounds | One cent of movement is worth 500 dollars per lot |
| Price quote | Cents per pound | Charts read near 70 cents; money moves 500 dollars per cent |
| Value of a 0.01-cent tick | 5 dollars per lot | The smallest price step already costs more than a forex spread |
| Value of a 1-cent move | 500 dollars per lot | The number every cotton calculation starts from |
| Main trading hours | ICE electronic session, US daytime | Best liquidity in the New York morning, not overnight |
The comparison with the grains is what makes the danger obvious. Corn, wheat and soybeans are all 5,000-bushel contracts, so one cent is worth 50 dollars a lot on each of them. Cotton’s lot is 50,000 pounds, so one cent is worth 500 dollars, ten times as much. A trader who copies a grain position size into cotton is unknowingly trading ten times the risk. I know, because I did exactly that, and the market charged me 750 dollars for the lesson.
Position-sizing maths under a 5,000-dollar daily loss limit
My funded account is 100,000 dollars with a 5,000-dollar daily loss limit, and I risk 500 dollars per trade, which is 0.5 percent of the account and exactly one tenth of the daily limit. That ratio is deliberate: ten consecutive full losses would breach the day, a run I have never had on cotton, while a single loss never threatens the account on its own. The sizing formula is the same one I use for every commodity trade, and it lives in the formula box below.
| Step | Formula | Worked numbers |
|---|---|---|
| Risk per trade | Account size x 0.5 percent | 100,000 x 0.005 = 500 dollars |
| Stop distance | Stop price minus entry price, in cents | 70.00 minus 68.00 = 2.00 cents |
| Dollar risk per lot | Stop distance x 500 dollars per cent | 2.00 x 500 = 1,000 dollars per lot |
| Position size | Risk divided by dollar risk per lot | 500 / 1,000 = 0.50 lots |
| Actual risk taken | Size x stop distance x 500 | 0.50 x 2.00 x 500 = 500 dollars |
I round the size down, never up, so the actual risk sits at or under my 500-dollar cap. The sizing grid below shows how the same 500-dollar risk changes with stop distance, which is why I never trade a fixed lot size: a tight cotton setup and a wide cotton setup are different trades, and fixed lots would quietly turn a wide setup into a daily-limit threat.
| Stop distance | Lots at 500 dollars risk | What it usually means |
|---|---|---|
| 0.50 cents | 2.00 lots | Very tight intraday setup, only with a proven level |
| 1.00 cent | 1.00 lot | Standard breakout with a close stop |
| 1.50 cents | 0.67 lots | Trend pullback with room to breathe |
| 2.00 cents | 0.50 lots | The worked example below |
| 3.00 cents | 0.33 lots | Wide swing setup, trade it small or skip it |
One rule sits above the grid: if the stop distance is wider than 3 cents, I skip the trade. At that width the setup needs a huge move just to reach 1R, and I am usually chasing a trend that has already happened. The max daily drawdown calculator is where I check the day’s remaining room before I enter, because a 500-dollar risk means something very different on a day when I am already 3,000 dollars down than on a fresh morning.
One worked trade, from entry to both targets
Cotton had pulled back for four days into the 70.00 area, a level that had held as support twice before, after a two-week uptrend driven by a dry Texas forecast. I went long at 70.00 with the stop at 68.00, two cents below the swing low, giving the trade room without letting a normal pullback shake me out. The size was 0.50 lots, so the risk was exactly 500 dollars, one tenth of the daily limit.
| Trade detail | Number |
|---|---|
| Entry (long) | 70.00 cents per pound |
| Stop (below the swing low) | 68.00, a 2.00-cent stop |
| Position size | 0.50 lots, risking 500 dollars |
| First target (1R) | 72.00, half closed for 250 dollars |
| Second target (2R) | 74.00, remaining half closed for 500 dollars |
| Total realised profit | 750 dollars, or 1.5R on 500 dollars risked |
| Share of the daily loss limit | Profit, not loss, and the risk was 10 percent of the 5,000-dollar limit |
The trade took three sessions to play out, and the hardest part was not the entry, it was leaving the second half alone after the first half banked. I moved the stop to breakeven at 1R, as the rules require, then closed the platform for the rest of the day, because watching a winning cotton position tick by tick is how I have talked myself out of 2R targets before. When I came back, price had reached 74.00 and the second half was closed. That is the whole point of splitting the exit: the first half pays for the patience the second half needs. I also use partial closes this way on other markets, for the same reason: a funded account rewards banked profit, not open profit.
I tested it: ten cotton trades with the sizing rules applied
I backtested this approach by hand over four months of cotton charts, marking every setup that met my rules — a marked level, a stop no wider than 3 cents, a New York-morning entry, and no entry inside a USDA report blackout — and then tracking what happened when I sized each one at 500 dollars of risk. The point of the test was not to prove cotton is easy. It was to check whether the sizing maths, applied consistently, kept the losses small enough that a normal win rate still made money.
| Trade | Setup | Result in R | Dollars at 500 dollars risk |
|---|---|---|---|
| 1 | Pullback long at support | +1.5R | +750 |
| 2 | Breakout long above range | -1.0R | -500 |
| 3 | Pullback long at support | +2.0R | +1,000 |
| 4 | Breakout short below range | -1.0R | -500 |
| 5 | Pullback long at support | +1.0R | +500 |
| 6 | Trend continuation long | +1.5R | +750 |
| 7 | Breakout long above range | -1.0R | -500 |
| 8 | Pullback short at resistance | +1.5R | +750 |
| 9 | Pullback long at support | -1.0R | -500 |
| 10 | Trend continuation long | +1.0R | +500 |
Six wins and four losses, with winners averaging 1.42R and every loser capped at exactly 1R, gave a net of plus 2.25R, or 1,125 dollars across the ten trades. The best single win was 1,000 dollars, which is 89 percent of the net profit, so I would not claim this sample proves a durable edge — it proves something narrower and more useful: when the sizing is fixed, a modest win rate survives, because no single loss was ever allowed to grow into a day-ending event. The four losses each cost 500 dollars, ten percent of the daily limit, and none of them happened on the same day, which is the other half of the discipline: I never stack two cotton losses into one session.
What actually moves cotton, and when I refuse to trade it
Cotton moves on supply, and supply moves on a calendar. The USDA’s World Agricultural Supply and Demand Estimates, the weekly export sales report, and the crop progress reports during the growing season are the three releases that gap cotton overnight. A WASDE revision to US ending stocks can move cotton two or three cents before the New York open, which is 1,000 to 1,500 dollars a lot, and no stop placed the night before survives that gap at its intended price. My rule is simple: no open cotton position into a WASDE release, and no new entry within 30 minutes after one, until the market has shown where it actually wants to trade.
Weather is the second driver, and it is slower but just as real. A dry forecast for West Texas, where much of US cotton grows without irrigation, tightens expected supply and lifts prices for days, not minutes. Export sales are the third: a large weekly sale to China or Pakistan confirms demand and usually extends a trend, while a string of weak sales weeks warns that a rally is running on speculation. I trade cotton with the trend when weather and exports agree, and I stand aside when they conflict, because a market pulled in two directions chops sideways and eats stops.
I also refuse cotton when the market is illiquid. Overnight sessions, holiday weeks, and the days between contract rollovers all show wider spreads and thinner order books, and a thin cotton market can slip a stop by half a cent or more, which is 250 dollars a lot that no sizing formula can prevent. The soybean guide covers the same report-blackout habit for grains, and the corn guide and wheat guide show how the same 5,000-bushel maths differs from cotton’s 50,000-pound maths. The habit transfers; the numbers do not.
My cotton routine: the checklist I run before every trade
Cotton rewards boredom. The routine below is deliberately dull, and it is the reason my cotton losses stopped being day-ending events.
| Step | What I check | My rule |
|---|---|---|
| 1. Calendar | USDA releases today | No open position into WASDE; no entry 30 minutes after any USDA release |
| 2. Level | Support or resistance with a prior rejection | No level, no trade, however clean the pattern looks |
| 3. Stop distance | Entry to structural stop, in cents | Over 3 cents means skip, not a bigger stop |
| 4. Size | 500 divided by (stop cents x 500) | Round down, never up; check remaining daily room first |
| 5. Session | Time of entry | New York morning only; no overnight entries |
| 6. Exit plan | 1R partial close, 2R runner, breakeven at 1R | Written before entry, never improvised after it |
The checklist also protects the consistency profile most firms enforce. My best cotton day in the test was 1,000 dollars, and my net across ten trades was 1,125 dollars, so no single day dominated the result. That matters more than traders admit: a strategy can be profitable on paper and still fail a funded account if one lucky day carries the whole month. Cotton’s size makes that trap easy to fall into, because one full-lot, three-cent move is 1,500 dollars, and a trader who sizes by feel can accidentally build a whole month around a single gap. Sized properly, cotton is just another market with its own numbers. Sized by habit borrowed from another market, it is a daily-limit breach waiting for a report day.
Frequently asked questions
How is cotton different from corn or wheat for a funded trader?
The contract size. Corn and wheat are 5,000 bushels, so one cent is worth 50 dollars a lot. Cotton is 50,000 pounds, so one cent is worth 500 dollars a lot. The same stop distance costs ten times as much, which is why grain position sizes must never be copied into cotton.
What is the smallest move worth in money?
One tick, a hundredth of a cent, is worth 5 dollars per full contract. On a 0.50-lot position like the worked example, one tick is worth 2.50 dollars. Spreads and slippage matter at this scale, so check your broker’s actual spread before assuming the exchange tick is your cost.
Can I trade cotton overnight on a funded account?
Only if your firm allows overnight holding, and even then I avoid it. Overnight cotton is thinner, gaps on USDA news are common, and a gap through your stop costs more than the stop you planned. I trade the New York morning session only.
How much should I risk per cotton trade?
I risk 500 dollars, which is 0.5 percent of a 100,000-dollar account and one tenth of a 5,000-dollar daily loss limit. Scale the dollar figure to your own account and limit, but keep the ratio: no single trade should ever be more than a tenth of the day’s room.
What reports should I watch before trading cotton?
The USDA WASDE report, the weekly export sales report, and crop progress reports in the growing season. I keep a calendar of all three, hold no open position into WASDE, and wait 30 minutes after any release before entering.
Is cotton too volatile for a funded account?
No, but it is too big to trade by feel. With the stop capped at 3 cents and the size calculated from that stop, a cotton loss costs exactly what you planned, and a cotton trend pays for the patience the second half of the position needs. The volatility is manageable; the contract size is what catches people.
Risk disclaimer: this article is for education only and is not financial advice. Trading leveraged products carries a high risk of loss, and past performance does not guarantee future results. Always check your prop firm’s rules before trading any market on a funded account.



4 comments
[…] weather second, calendar third, and only then the chart. For contrast, read my cotton guide — trading cotton on a funded account — where the same routine works but the per-cent number is 500 dollars, not 150, and the gap risk […]
[…] more internal links are worth your time if you trade commodities on a funded account. My cotton guide shows how a 50,000-pound soft contract sizes completely differently from lumber, and my soybeans […]
[…] you trade the grains already — soybeans, cotton, lumber — cattle is the next contract in the same discipline: same 500-dollar risk cap, same […]
[…] closes on a funded account and the consistency rule explained. The commodity series continues with cotton and lumber if you want the same treatment for the […]