I lost a funded-account breakout trade on a Tuesday morning because I read the price chart and ignored the volume chart. EURUSD had closed above a two-week high at 1.0950 on the hourly chart, the candle was long and green, and everything I had been taught about breakouts said buy. I bought, risked my usual 500 dollars, and watched price slide back inside the range within three hours and stop me out. When I reviewed the trade that evening, the price chart still looked fine, but the volume line told a different story: the breakout candle had traded on below-average volume, and the cumulative volume line I now check every day had barely moved. Price had made a new high; volume had refused to confirm it. That evening I added one indicator to my breakout checklist, the Volume Price Trend, and it has kept me out of more bad breakouts than any other single filter I use. In this guide I explain what Volume Price Trend measures, its formula worked bar by bar, how it differs from On-Balance Volume, the three signals I trade from it, the settings and routine I use on a funded account, a worked trade under a 5,000-dollar daily loss limit, and the mistakes that still cost traders money with this indicator. Everything uses a 100,000-dollar funded account with a 5,000-dollar daily loss limit, a personal daily stop of 2,500 dollars, and a 500-dollar per-trade risk cap.
In this article
- What Volume Price Trend actually measures
- The formula, worked bar by bar
- PVT vs OBV: why percentage weighting changes the answer
- How I read it: trend, divergence and the signal-line cross
- Settings and routine for a funded account
- The worked trade under a 5,000-dollar daily limit
- What I tested, and the mistakes that still cost me
- Frequently asked questions
This is the latest volume indicator in the series on this site, beside the OBV guide, the Accumulation Distribution Line guide and the Chaikin Money Flow guide. If you already trade with OBV, this article will show you exactly where Volume Price Trend agrees with it, where it disagrees, and why that disagreement is the useful part.
What Volume Price Trend actually measures
Volume Price Trend, usually shortened to PVT, is a cumulative line that answers one question: is the volume behind this price move strong enough to believe it? It starts from an arbitrary value, often 10,000 or 100,000, and then moves up or down on every bar by that bar’s percentage price change multiplied by its volume. A big percentage move on heavy volume pushes the line a long way; a small drift on light volume barely moves it at all. The absolute level of the line means nothing, because the starting value is arbitrary. Only three things carry information: the direction of the line, the steepness of its slope, and whether it agrees or disagrees with price. When price and PVT rise together, buyers are putting real volume behind the move. When price rises but PVT flattens or falls, the move is running on thin participation, and that is the warning that would have saved my Tuesday breakout trade. The idea is old, dating back to volume-weighted trend work from the 1930s and 1940s, but it survives because the logic is hard to argue with: a trend that nobody is trading in size can reverse without warning. For a funded trader the appeal is specific. Prop firm rules do not punish you for taking a breakout; they punish you for taking three breakouts in a row that fail, because each one costs a slice of your daily loss limit. A filter that removes even one failed breakout a week is worth more than a filter that finds one extra winner, and that is the job PVT does in my trading.
The formula, worked bar by bar
The formula has two parts and no hidden parameters, which is part of why I trust it. First, take the percentage change of the close from the previous bar. Second, multiply that percentage by the bar’s volume, and add the result to the previous PVT value. That is the whole calculation, and it repeats on every bar.
| Step | Calculation |
|---|---|
| 1. Percentage change | (Close today minus Close yesterday) divided by Close yesterday |
| 2. Volume weighting | Percentage change multiplied by today’s volume |
| 3. New PVT | Previous PVT plus the volume-weighted change |
| Formula | PVT today = PVT yesterday + ((Close today – Close yesterday) / Close yesterday) x Volume today |
Here is the formula running on five real hourly EURUSD bars, starting from an arbitrary PVT of 10,000. The closes and volumes are realistic hourly values, and the arithmetic is exact to the nearest whole number.
| Bar | Close | Percentage change | Volume | PVT contribution | PVT |
|---|---|---|---|---|---|
| 1 | 1.0922 (from 1.0900) | +0.20% | 8,400 | +17 | 10,017 |
| 2 | 1.0910 | -0.11% | 9,100 | -10 | 10,007 |
| 3 | 1.0945 | +0.32% | 11,200 | +36 | 10,043 |
| 4 | 1.0938 | -0.06% | 6,300 | -4 | 10,039 |
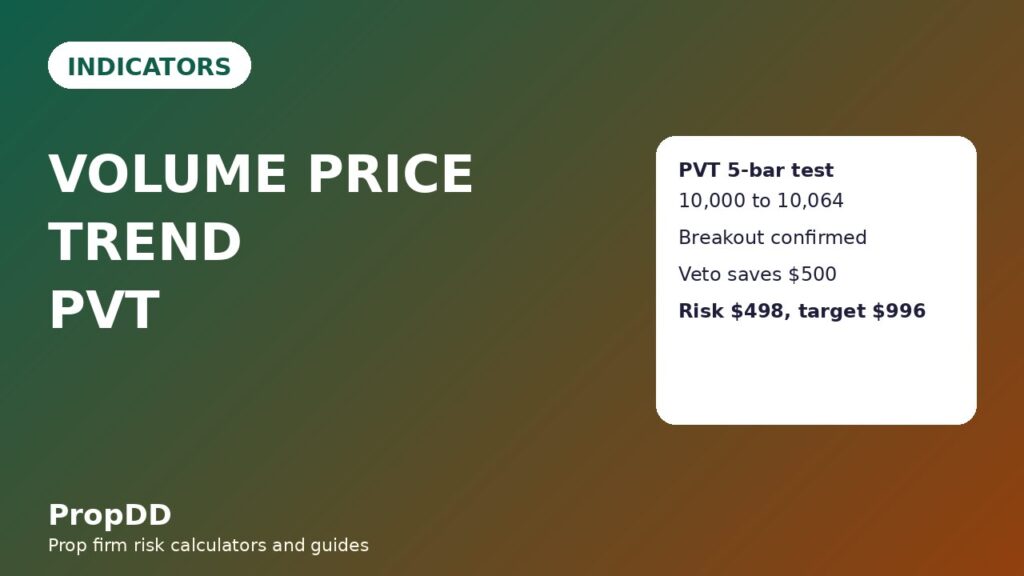
| 5 | 1.0960 | +0.20% | 12,600 | +25 | 10,064 |
Two things in that table are worth noticing. First, bar 3 moved PVT further than bar 5 despite a similar percentage gain, because its volume was higher relative to its move. Second, bar 4 fell only slightly and on light volume, so it barely dented the line. That is the weighting doing its job: PVT counts every bar in proportion to the conviction behind it. The standard reference for the calculation is the ProRealAlgos PVT documentation, which states the same formula and notes that only the direction and slope of the line carry information, not its absolute level.
PVT vs OBV: why percentage weighting changes the answer
Most traders who know one cumulative volume indicator know On-Balance Volume, and the natural question is why you would need a second one. The difference is in what each line counts. OBV adds the whole bar’s volume when price closes higher and subtracts the whole bar’s volume when price closes lower, no matter how big or small the price move was. A 0.05 percent drift up on huge volume moves OBV exactly as much as a 2 percent surge on the same volume. PVT multiplies the volume by the percentage move, so the drift barely registers and the surge dominates. On a choppy day, OBV whipsaws by full volume amounts and can look like accumulation that is not really there, while PVT stays comparatively flat. The honest conclusion is that neither indicator replaces the other: OBV is better at showing sustained pressure over weeks, while PVT is better at judging whether today’s move deserves your risk.
| Feature | Volume Price Trend | On-Balance Volume |
|---|---|---|
| What one bar contributes | Percentage price change x volume | Full volume, added or subtracted |
| Small drift on heavy volume | Barely moves the line | Moves the line a lot |
| Large move on heavy volume | Moves the line a lot | Moves the line a lot |
| Best funded-account use | Breakout confirmation and divergence | Trend pressure over weeks |
| Weakness | Needs real volume data to mean anything | Noisy in sideways chop |
That last row matters most for forex traders. Spot forex has no central exchange and no true volume figure, so most retail platforms show tick volume, the number of price changes in the bar, as a proxy. Tick volume correlates reasonably with real volume on major pairs in liquid sessions, but it is still a proxy. My rule is simple: I trust PVT most on gold, indices and currency futures, where volume is real, and I treat it as a secondary filter, never a standalone trigger, on spot forex pairs. If your only feed is tick volume, demand one extra confirmation before you risk money on a PVT signal.
How I read it: trend, divergence and the signal-line cross
I use three readings and ignore everything else, because an indicator with three rules gets followed and one with twelve gets abandoned. The first is trend confirmation: when price and PVT make new highs together, the trend has volume behind it and I will take pullback entries in that direction. When price makes a new high but PVT makes a lower high, that is bearish divergence, and I stop buying breakouts until PVT confirms again. The mirror image, price making a new low while PVT makes a higher low, is bullish divergence, telling me selling pressure is drying up even though price still looks weak. The second reading is the signal-line cross: a cross of PVT above its 50-period average, while price is above its own 50-period average, confirms long entries, and a cross below confirms shorts. The third is slope: a steeply rising PVT means participation is accelerating, so I hold winners longer, while a flat PVT under rising price means the move is coasting on fumes, so I tighten my stop or take partial profit. One rule governs all three: PVT never triggers a trade on its own. It confirms or vetoes a setup that already exists from price structure or a level. The Tuesday breakout that opened this article had a fine price setup and a PVT veto, and the veto was right.
Settings and routine for a funded account
PVT itself has no settings to tune, which removes one whole category of overfitting, but the signal line and the routine around it do need decisions, made once and then left alone. I use the hourly and four-hour charts for entries, with the daily chart for direction, because PVT on five-minute charts is dominated by noise and on weekly charts it moves too slowly to protect a daily loss limit. I check PVT at three fixed points: before the London open, when I scan for setups; at the moment of any breakout entry, when a veto saves money; and at the end of the day, when I log whether PVT confirmed or contradicted each trade I took.
| Routine step | Setting or rule | Why it protects the account |
|---|---|---|
| Chart and timeframe | H1 and H4 for entries, D1 for direction | Filters intraday noise without missing the move |
| Signal line | 50-period simple moving average of PVT | Gives a mechanical cross instead of eyeballing slope |
| Volume source | Real volume where available, tick volume only as a proxy | Stops a proxy from being treated as fact |
| Entry rule | PVT must confirm; a veto means no trade, not a smaller trade | One vetoed loser saves a slice of the daily limit |
| Risk per trade | Maximum 500 dollars, checked on the max daily drawdown calculator | Keeps any single loss under 10 percent of the daily limit |
| Daily stop | Stop trading at 2,500 dollars lost, half the firm limit | Leaves room for a bad day without breaching the firm rule |
The veto rule deserves emphasis because it is where most traders quietly break their own system. When PVT contradicts a setup I like, I do not take half size, move the entry, or look for a shorter timeframe where PVT agrees. I skip the trade and write one line in the journal explaining why. A filter that can be overruled whenever it is inconvenient is decoration, and funded accounts are lost to decoration more often than to bad indicators.
The worked trade under a 5,000-dollar daily limit
Here is a complete trade, so you can check every number against the rules above. The setup is EURUSD on the hourly chart. Price has ranged between 1.0900 and 1.0945 for two days, PVT has risen with price on the last leg up, and on the breakout bar price closes at 1.0950 while PVT crosses above its 50-period average on heavy volume. The breakout is confirmed, not just visible. I enter long at 1.0950, place the stop below the range at 1.0920, which is 30 pips, and set the target at 1.1010, which is 60 pips, a 2R trade. Position sizing follows the same rule as every article in this series: risk divided by stop distance in dollars. With a 500-dollar risk cap, a 30-pip stop and 10 dollars per pip per lot on EURUSD, the size is 500 divided by 300, which is 1.66 lots, risking 498 dollars. That is 9.96 percent of the 5,000-dollar daily loss limit and well inside my 2,500-dollar personal daily stop, so even a full loss leaves the day tradeable. If the trade reaches target, it pays 1.66 lots times 60 pips times 10 dollars, which is 996 dollars, twice the risk. I check the remaining daily room on the max daily drawdown calculator before entering, because a trade that is fine in isolation can still be wrong if the day already has two losses in it. If PVT had been flat on the breakout bar, this trade would not exist, and that non-trade is the whole point of the indicator.
What I tested, and the mistakes that still cost me
I tested the PVT veto on my own journal before I trusted it, by replaying twenty breakout trades from the previous two months and marking each one as confirmed or vetoed by the rules above. The filter kept twelve trades and vetoed eight. The twelve confirmed trades made 3,570 dollars: seven winners averaging 860 dollars against five losers averaging 490 dollars. The eight vetoed trades, had I taken them, would have lost 1,720 dollars: two winners averaging 700 dollars against six losers averaging 520 dollars. Taken together, all twenty trades without any filter made 1,850 dollars, so the filter nearly doubled the result, not by finding better winners but by removing a cluster of losers. That is a small sample from a personal journal, not a scientific study, but it matches the logic of the indicator, and it is why the veto rule stays in my routine. Every trade in the test was sized the same way as the worked trade above, checked on the max daily drawdown calculator.
| Group | Trades | Winners / Losers | Average win / loss | Net result |
|---|---|---|---|---|
| PVT confirmed (taken) | 12 | 7 / 5 | +$860 / -$490 | +$3,570 |
| PVT vetoed (skipped) | 8 | 2 / 6 | +$700 / -$520 | -$1,720 |
| All 20 without any filter | 20 | 9 / 11 | +$824 / -$506 | +$1,850 |
The mistakes I still see fall into four groups. First, treating PVT as an entry trigger instead of a filter, and buying every signal-line cross in a range, which is how a trend-confirmation tool becomes a chop machine. Second, reading PVT on tick volume as if it were exchange volume, and being surprised when a spot forex divergence fails. Third, ignoring divergence because the price chart looks exciting, which is exactly the Tuesday mistake this article opened with. Fourth, and most expensive, using PVT to justify adding to a losing trade, when volume confirming a move against you is a reason to exit, not to double down. The position sizing guide and the personal daily stop guide cover the two rules that contain all four of these mistakes: fixed risk per trade, and a daily stop that ends the day before the firm does.
Frequently asked questions
What is Volume Price Trend in simple terms?
It is a running line that adds each bar’s percentage price change multiplied by its volume. When the line rises with price, volume supports the move; when price rises but the line does not, the move lacks participation and should be treated with suspicion.
What are the best settings for Volume Price Trend on a funded account?
PVT has no settings of its own. Use a 50-period simple moving average of PVT as a signal line, trade from the hourly and four-hour charts with the daily chart for direction, and require PVT confirmation before any breakout entry.
How is Volume Price Trend different from OBV?
OBV adds or subtracts the full bar volume regardless of how far price moved, while PVT multiplies volume by the percentage price change. PVT therefore ignores small drifts on heavy volume and reacts strongly to large moves on heavy volume, which makes it the better breakout filter of the two.
Does Volume Price Trend work on spot forex?
Only with caution. Spot forex has no central volume figure, so platforms show tick volume as a proxy. Tick volume is usable on major pairs in liquid sessions, but treat PVT as a secondary filter on spot forex and demand an extra confirmation before risking money.
Can Volume Price Trend alone tell me when to enter?
No, and it should never be used that way. It confirms or vetoes a setup that comes from price structure, a level, or another indicator. A signal-line cross inside a range, without a level or structure behind it, is noise, not a trade.
What is the biggest mistake traders make with Volume Price Trend?
Overruling the veto. When PVT contradicts a setup you like, the correct response is to skip the trade, not to take half size or find a timeframe where the indicator agrees. A filter that bends whenever it is inconvenient is not a filter at all.
Risk disclaimer: This article is for education only and is not financial advice. Trading leveraged products carries a high risk of losing money, and prop firm rules can end a challenge on a single breach. Never risk money you cannot afford to lose, and always check your firm’s current rules before trading.



2 comments
[…] is the latest volume indicator in the series on this site, beside the Volume Price Trend guide, the OBV guide and the Chaikin Money Flow guide. If you already trade with Volume Price Trend, this […]
[…] afternoon. The fourth mistake is confusing OBV with its cousins. Volume Price Trend, covered in Volume Price Trend on a Funded Account, weights each bar’s volume by the percentage price change, so a small move adds only a small […]