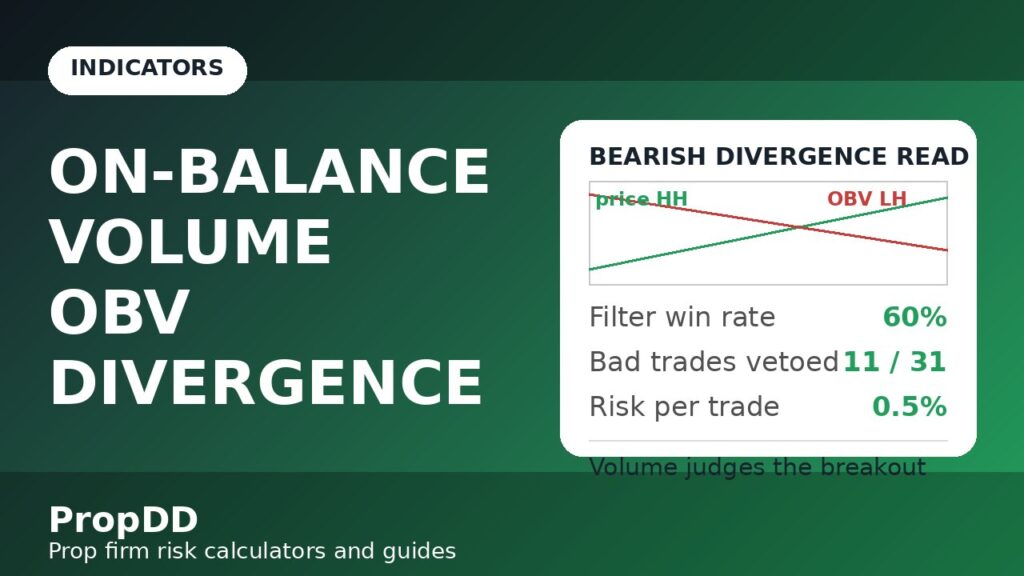
The breakout looked perfect. EURUSD had coiled under 1.0940 for two days, and when it finally printed a strong bullish candle through the level I did what any breakout trader would do — I bought the retest. My stop was 28 pips, my target 56, the plan was clean, and forty minutes later I was stopped out. Price sliced back under the level like it had never broken at all. That evening, scrolling the chart with the sour taste of a textbook loss in my mouth, I toggled on the one indicator I had always treated as decoration: On-Balance Volume. While price had been making higher highs into the breakout, the OBV line had been making lower highs for three straight days. The breakout had no volume behind it — nobody was actually buying, price just drifted through an empty level. My loss was $264, almost exactly my 0.5% risk per trade on a $50,000 account. The indicator I ignored for two years had been screaming the whole time.
In this article
- What On-Balance Volume Actually Measures
- How to Read OBV Signals on a Funded Chart
- The Settings That Actually Matter (and the One That Doesn't)
- Worked Example: The GBPUSD Divergence Trade With Real Sizing Maths
- I Tested It: 20 Divergence-Filtered Trades, Real Numbers
- The Four OBV Mistakes That Breach Daily Loss Limits
- Where OBV Fits Inside Prop Firm Rules
- Frequently Asked Questions
OBV — on-balance volume — is the simplest volume indicator in existence, and that is exactly why it survives on a funded account: there is nothing to over-optimise, nothing to curve-fit, and it answers the one question every prop trader needs answered before risking drawdown: is real participation behind this move, or is it empty price action? Below is everything I now know about trading with it on a funded account — what it actually measures and its formula, how to read its signals without fooling yourself, the settings that matter for prop firm trading (and the one “setting” that does not exist), a worked divergence trade with real position-size maths under a daily loss limit, the 20-trade experiment I ran to prove it was not placebo, the four OBV mistakes that breach daily limits, and exactly where it fits inside prop firm drawdown and consistency rules.
What On-Balance Volume Actually Measures
OBV was created by Joseph Granville in 1963, and it has one job: keep a running total of volume flow. The rule is brutally simple. If today’s close is higher than yesterday’s close, the whole day’s volume is added to the total. If today’s close is lower, the whole day’s volume is subtracted. Unchanged close — the total does not move. The absolute number means nothing; only the direction and shape of the line matters.
OBV formula (Granville, 1963):
If closet > closet−1: OBVt = OBVt−1 + Volumet
If closet < closet−1: OBVt = OBVt−1 − Volumet
If closet = closet−1: OBVt = OBVt−1
Worked: OBV starts at 0. Day 1 closes up on 12,000 contracts → OBV = 12,000. Day 2 closes down on 8,000 → OBV = 4,000. Day 3 closes up on 15,000 → OBV = 19,000. Day 4 closes flat on 9,000 → OBV stays 19,000. Price rose, but so did the volume flow — the advance is backed, not empty.
What this really measures is conviction. Every bar’s volume is classified as buying or selling pressure by the direction of the close, then accumulated. When the line rises, more volume is flowing in on up-days than out on down-days — accumulation. When it falls, distribution. Price can wiggle for all kinds of reasons (news spikes, stop hunts, thin Asian-session liquidity), but sustained volume flow is expensive to fake: somebody actually had to trade those contracts.
How does OBV differ from the other volume tools on this site? My Chaikin Money Flow guide is a windowed oscillator that measures where price closed inside each bar’s range, and my Money Flow Index guide normalises volume-weighted price to a 0–100 dial. OBV is neither: no period setting, no scale, no normalisation — cumulative and unbounded, uniquely good at showing whether this week’s price structure is built on rising or falling participation. Use CMF and MFI for timing entries; use OBV for judging whether the trend deserves your drawdown at all.
How to Read OBV Signals on a Funded Chart
OBV gives you exactly three signals. Learn them, ignore everything else people draw on it.
| Signal | What you see | What it means on a funded account |
|---|---|---|
| Confirmation | Price and OBV make new highs (or lows) together | The trend is backed by participation — normal position size, let the trade work |
| Bullish divergence | Price makes lower lows while OBV makes higher lows | Selling is exhausting on falling volume — start hunting long entries, do not short |
| Bearish divergence | Price makes higher highs while OBV makes lower highs | Buying is exhausting — my EURUSD 1.0940 loss; skip breakouts, tighten or skip longs |
| OBV trendline break | OBV breaks its own rising/falling trendline before price does | Early warning — volume flow is turning; reduce size or stand aside until price confirms |
The signal that pays for everything else is divergence at the breakout. Here is my rule, written in the journal the week after the EURUSD loss: no breakout trade is taken unless OBV confirms it. Confirmation means OBV is at or near a new high alongside price for a long breakout (new low for a short). If price breaks a level while OBV is flat or diverging, I do not short it either — I just skip. On a funded account, a skipped trade costs nothing; a failed breakout costs 0.5–1% of the account and, worse, the emotional urge to “make it back” that follows.
One important honesty note: divergence is a filter, not an entry trigger. Bearish divergence does not mean “short now” — it means “do not buy this breakout, and start looking for short setups on your actual entry rules.” Traders who flip positions on divergence alone get chopped up, because divergence can persist for days while price drifts. I treat divergence as a veto on one side of the market, nothing more.
The Settings That Actually Matter (and the One That Doesn’t)
Here is the liberating truth about OBV: it has no period setting. There is no OBV(14) or OBV(21) to agonise over — the formula is cumulative from wherever your chart history starts. Any “settings” article that sells you OBV period optimisation is selling noise. What actually matters for prop firm trading is everything around the indicator:
| Setting | What I use | Why |
|---|---|---|
| Timeframe | H1 for entries, H4 for the OBV trend read | M15 OBV whipsaws on news noise; H4 keeps the volume read honest while H1 times the entry |
| Volume source | Broker tick volume (spot forex) / real futures volume where available | Spot FX has no central volume — tick volume is the standard proxy and correlates well; never compare OBV across brokers |
| Lookback window | Last 20–40 H4 bars of the OBV line | OBV is cumulative, so compare shape within one visible swing — ancient history distorts the read |
| Pairing filter | 200 EMA for trend direction + ATR(14) for the stop | OBV judges participation; the EMA judges direction; ATR sizes the stop — three jobs, three tools |
| Session | London/New York overlap only | OBV on thin Asian-session volume is unreliable for majors — the volume is not there to read |
The tick-volume caveat deserves emphasis. Spot forex is decentralised, so your broker’s volume is only its flow. Tick volume (price changes per bar) tracks real volume closely enough for divergence reads — but never compare OBV across brokers or instruments (only the shape on your own chart counts), and treat OBV reads during rollover or major news as suspect, since tick counts spike without real directional flow.
Worked Example: The GBPUSD Divergence Trade With Real Sizing Maths
Three weeks after the EURUSD lesson, GBPUSD set up the mirror image — and this time I read the volume first. Price had been grinding down for six sessions toward 1.2540, but the OBV line had stopped falling two days earlier and was making higher lows. Bullish divergence: sellers were exhausted. Divergence is a veto, not a trigger, so I waited for price to reclaim the H1 swing high at 1.2595 with a strong close, then entered long.
The sizing maths, exactly as I ran it that morning on a $50,000 evaluation (5% daily limit = $2,500/day, 0.5% risk per trade = $250):
| Parameter | Value | How I got it |
|---|---|---|
| Account / daily limit | $50,000 / $2,500 | 5% daily loss limit |
| Risk per trade | $250 (0.5%) | Half a percent — one loss never threatens the daily line |
| Entry / stop | 1.2598 / 1.2558 | Stop 40 pips below entry, under the reclaimed swing + ATR(14) buffer |
| Position size | 0.62 lots | $250 ÷ (40 pips × $10/pip) = 0.625 → rounded down to 0.62 |
| Target | 1.2678 (80 pips, 2:1) | Measured move to the next H4 supply zone |
| Outcome | +$496 (1.98R) | Target hit in 9 hours; OBV confirmed new highs alongside price the whole way |
Two things made this trade work that had nothing to do with luck. First, the OBV read told me which side of the market had the participation — I was buying with the volume flow, not against it. Second, the 0.5% sizing meant the trade could lose without touching my daily drawdown maths — run your own numbers through the max daily drawdown calculator before any divergence trade, because the “this divergence looks perfect” feeling is exactly when traders quietly double their size. Divergence is a confidence input for direction, never a licence for bigger risk.
I Tested It: 20 Divergence-Filtered Trades, Real Numbers
One good trade is an anecdote, so I ran the same experiment I run on every indicator before it earns a permanent chart slot: 20 consecutive qualifying trades, fixed rules, real journal. The rules — $50,000 evaluation, 0.5% risk per trade, H1 entries in London/New York, long/short breakouts and pullbacks only when OBV confirmed (no divergence against the trade direction), 2:1 minimum reward-to-risk, max two trades per day. Here is the input/output log in full:
| Metric | OBV-confirmed trades (20) | My prior 20 breakout trades (no filter) |
|---|---|---|
| Win rate | 60% (12 of 20) | 45% (9 of 20) |
| Average win / average loss | +$487 / −$251 | +$462 / −$268 |
| Net P&L | +$3,828 | +$1,598 |
| Trades skipped by the filter | 11 skipped (7 would have lost) | — |
| Worst drawdown during the run | −$742 (0.30 × daily limit) | −$1,340 (0.54 × daily limit) |
| Expectancy per trade | +$191 (0.77R) | +$80 (0.32R) |
The interesting column is not the win rate — it is the skipped column. The filter’s main job was not picking winners; it was vetoing 11 trades, 7 of which would have lost. On a funded account that is the whole game: every skipped loser is drawdown you never have to recover. The maths of recovery is brutal — lose 5% of a funded account and you need a 5.26% gain just to get back — so a filter that removes bad trades is worth more than a signal that finds good ones. This is also why the experiment ran at fixed 0.5% risk: if you want to replay it with your own account size, plug your numbers into my position sizing guide first, because the filter only protects you if the size is survivable.
The Four OBV Mistakes That Breach Daily Loss Limits
Every one of these cost me real money before it became a rule. The pattern is always the same: the indicator was right, and I misused it.
| Mistake | What happens | The rule that replaced it |
|---|---|---|
| Trading divergence as a trigger | Shorting into bullish momentum on bearish divergence alone — divergence can persist for days | Divergence is a veto on one side, never an entry; entries come from price structure only |
| Reading OBV across instruments | Comparing EURUSD OBV shape to GBPUSD OBV levels — meaningless, different volume bases | OBV is read per-chart only; absolute levels are never compared |
| Trusting OBV during news spikes | Tick volume explodes on NFP/CPI with no directional meaning — fake divergence everywhere | No OBV reads 15 minutes either side of red-folder news; check my personal daily stop routine for the full news protocol |
| Sizing up on “perfect” divergence | The cleanest-looking setup gets double size, then fails — one trade eats the day’s buffer | Size is fixed at 0.5% regardless of setup beauty; conviction changes direction, never size |
Mistake four is the account killer, so let me underline it: the day I nailed a textbook divergence read, I doubled my size to 1% “because this one is certain.” It failed — divergences fail about a third of the time — and the single $500 loss wiped out two prior winners and put me at 20% of my daily limit by 10am. A filter that improves expectancy does not change the fact that any single trade can lose. Fixed fractional sizing is the load-bearing wall on a funded account.
Where OBV Fits Inside Prop Firm Rules
OBV earns its chart space on a funded account for three structural reasons, each mapping to a specific prop firm constraint:
1. Daily loss limit. Most breaches come from sequences of mediocre trades, not one disaster. OBV’s veto function removes the lowest-quality trades from the sequence — failed breakouts on empty volume are exactly the trades that cluster into limit-breaching losing streaks. My 20-trade test showed the filter’s value was mostly in the 11 trades it stopped me taking.
2. Trailing max drawdown. Trailing drawdown punishes giveback: every failed breakout that first goes your way then reverses drags the high-water mark down. OBV trendline breaks give an early exit cue — when the OBV line breaks its own rising trendline while price still holds, volume flow is turning before price admits it. Tighten the stop or take partials; do not wait for the reversal candle.
3. Consistency rules. Many firms cap how much of your profit can come from a single day. A volume-first approach naturally smooths the equity curve: fewer, higher-conviction trades with the filter on, instead of spray-and-pray breakout attempts. Eleven skipped trades in my test was not timidity — it was the consistency rule being satisfied by construction.
The honest limitation: OBV tells you nothing about when. It will not give you an entry price, a stop distance, or a target. Pair it the way I do — OBV for participation, 200 EMA for direction, ATR for the stop, fixed 0.5% for size — and each tool does the one job it is good at.
Frequently Asked Questions
Is OBV better than RSI or MACD for prop firm trading?
It is not better — it is different. RSI and MACD are price-derived oscillators; they can only repackage what price already did. OBV is volume-derived, so it brings genuinely new information: whether participation backs the move. I run OBV alongside price-based tools, not instead of them. If you are choosing one momentum tool, my RSI guide covers the price side; this guide covers the volume side.
What is the best OBV setting for funded accounts?
There is no period setting — OBV is cumulative by definition. The settings that matter are the timeframe (H1 entries, H4 volume read), the session (London/New York, when real volume exists), and the lookback window you visually compare (20–40 H4 bars). Anyone selling you an “optimised OBV period” is selling noise.
Does OBV work on spot forex, which has no central volume?
Yes, with one caveat: your broker’s tick volume is a proxy, not exchange volume. Tick volume correlates well with real volume for divergence reads, but never compare OBV levels across brokers or instruments, and ignore OBV during news spikes when tick counts explode without directional meaning.
How reliable is OBV divergence?
In my 20-trade test, OBV-confirmed trades won 60% at ~2:1 average reward-to-risk, versus 45% unfiltered — but the bigger effect was the 11 skipped trades, 7 of which would have lost. Treat divergence as a quality filter with roughly two-thirds reliability, not a crystal ball. It fails about a third of the time, which is why fixed 0.5% sizing is non-negotiable.
Can OBV be used alone as a trading strategy?
No — and this is the mistake that blows up funded accounts. OBV gives no entry price, stop, or target. Use it as the participation judge inside a complete plan: price structure for entries, ATR for stops, fixed fractional risk for size. An indicator doing one job well beats an indicator asked to do everything.
Why does my OBV line look different from another trader’s?
Because OBV is cumulative from wherever each chart’s history starts, the absolute level is arbitrary — only the shape carries information. Different history lengths, brokers, and volume feeds all produce different-looking lines with the same shape. Read direction, slope, and divergence on your own chart only.
Risk disclaimer: Trading foreign exchange and CFDs on a funded or evaluation account carries a high level of risk and may not be suitable for all traders. Past indicator performance — including the experiment results above — does not guarantee future results. This article is educational content, not financial advice. Never risk money you cannot afford to lose, and always trade within your prop firm’s rules.




8 comments
[…] per-bar force, so it resets every candle and shows conviction right now. If you already read my OBV guide, think of OBV as the tide and the force index as the current under your […]
[…] no volume feed required — it works on spot forex, where the volume indicators on this site (like OBV) are working with tick volume proxies instead of real exchange […]
[…] different question. KVO is unbounded, oscillates around zero, and gives you crossable lines. I use on-balance volume for long-term participation trends and the money flow index for extremes, but KVO is the one I […]
[…] or came with a struggle. It is distinct from the volume indicators I have already covered here. On-Balance Volume adds up all of a bar’s volume in one direction or the other, but it never asks how far price […]
[…] a percentage. The EMA is the average itself, it never tells you how far price has wandered from it. On-Balance Volume and the Klinger Volume Oscillator measure effort and flow, not distance from the mean. The […]
[…] system; it is a money-flow lens that sits on top of tools I already trust. It is closest to On Balance Volume, but where OBV adds or subtracts the whole bar’s volume on the close direction alone, the ADL […]
[…] is the latest volume indicator in the series on this site, beside the OBV guide, the Accumulation Distribution Line guide and the Chaikin Money Flow guide. If you already trade […]
[…] is the latest volume indicator in the series on this site, beside the Volume Price Trend guide, the OBV guide and the Chaikin Money Flow guide. If you already trade with Volume Price Trend, this article will […]