I lost 412 dollars on an upside gap two crows pattern on a morning when I was certain I had found a top. EURUSD had climbed for three days, the first candle of the pattern was long and green, and then two small red candles appeared above it, each one gapping up and failing. I shorted at the close of the third candle, exactly as the textbook picture suggested, and price climbed another 60 pips into my stop before it ever looked back. The pattern was real. The trade was early, and on a funded account early is the same as wrong, because the stop that should have cost me one controlled loss instead cost me most of a day. This article is the version I trade now, with one rule added that the textbook leaves optional: no confirmation candle, no trade.
In this article
- What upside gap two crows actually is
- The three candles, rule by rule
- Why the gap matters, and why it is not enough
- The six rules I trade, in order
- Entry, stop loss and targets
- Position sizing under a 500-dollar daily limit
- The worked trade, candle by candle
- When the strategy fails, and how I recognise it early
- How upside gap two crows fits the funded rules
- How it differs from the patterns it resembles
- My daily routine for this pattern
- Frequently asked questions
Upside gap two crows is a three-candle bearish reversal pattern that appears at the top of an uptrend. The first candle is a long bullish candle that confirms buyers are in control. The second candle gaps up above the first candle’s close, then closes lower, but still above the first candle’s close. The third candle gaps up again, higher than the second candle’s open, then falls back and closes below the second candle’s close, engulfing the second candle’s body, while still closing above the first candle’s close.
What upside gap two crows actually is
The pattern belongs to the Japanese candlestick family, and its name is literal. The two bearish candles are the crows, and the upside gap is the space between their bodies and the body of the bullish candle below them. For the pattern to count, the gap must survive all three candles. If the third candle closes inside the first candle’s body, the gap is closed and the pattern is no longer upside gap two crows at all, it is the plain two crows pattern, a different and slightly stronger reversal signal. If the second candle closes below the first candle’s close, there was never a gap to begin with. Precision here is not pedantry. The gap is the evidence that buyers pushed higher twice and failed twice, and a pattern without it is just three ordinary candles that happen to look tired.
The pattern is rare, and rarity is a feature, not a flaw, for a funded trader. A setup that appears twice a week invites overtrading. A setup that appears twice a month forces patience, and patience is what keeps a daily loss limit intact. The cost of rarity is a small sample size, which is why I never trade this pattern on its own evidence. Every rule below exists to answer one question: has the market confirmed that the uptrend is over, or has it merely paused?
The three candles, rule by rule
Each candle has a job, and a pattern missing any one of them is not a pattern. The first candle must be long and bullish, with a body clearly larger than the recent average, appearing after a visible uptrend rather than inside a sideways range. A long green candle in chop proves nothing. The second candle must be bearish, must gap up so that its body opens above the first candle’s close, and must close below its own open while staying above the first candle’s close. The third candle must be bearish, must open above the second candle’s open, and must close below the second candle’s close while still closing above the first candle’s close, so that its body engulfs the second candle’s body.
| Candle | Direction | Open rule | Close rule |
|---|---|---|---|
| 1: the trend candle | Long bullish | Anywhere, after an uptrend | Well above its open, a clearly long body |
| 2: the first crow | Small bearish | Gaps up above candle 1 close | Below its open, but above candle 1 close |
| 3: the second crow | Bearish | Above candle 2 open | Below candle 2 close, engulfing candle 2, but above candle 1 close |
| 4: confirmation (my rule) | Bearish | Anywhere | Below candle 1 close, closing the gap |
The fourth row of that table is not part of the classical pattern, and I include it deliberately. Classical references describe upside gap two crows as a pattern that requires confirmation, and the confirmation I demand is a candle that closes below the first candle’s close. Until that happens, the gap is still open, the uptrend has not technically broken, and a short is a guess dressed up as a setup. My 412-dollar loss was a short taken at the close of candle 3, before any such candle existed. Price then closed the gap upward instead of downward, and the pattern dissolved into a continuation.
Why the gap matters, and why it is not enough
The gap is the pattern’s only real evidence. In a normal top, sellers gradually push price lower candle by candle. Here, buyers twice manage to open higher, which means demand was still present at the open, and twice they fail to hold it, which means supply met them and won the session. That double failure is more informative than a single red candle, because one failure can be noise and two failures in a row, at higher opens, look like exhaustion. The problem is that exhaustion is not reversal. Exhausted buyers can rest, consolidate sideways for a week, and then climb again, and every backtest summary I have read on this pattern says the same uncomfortable thing: without confirmation, it behaves close to randomly, sometimes continuing upward rather than reversing.
That is why the funded-account version of this strategy is stricter than the textbook version. A retail trader with a personal account can afford to be early and average down. A funded trader cannot, because the daily loss limit turns one early short into a day-ending loss. The confirmation candle costs me the first part of the move, sometimes 20 or 30 pips of it, and I pay that cost gladly. It is cheaper than the stop I paid when I skipped it. A plain-language description of the pattern’s structure and its need for confirmation is given in the Synapse Trading guide to upside gap two crows.
The six rules I trade, in order
I trade this pattern only when all six rules pass, in this order, and I check them in writing before I place the order. Skipping ahead to the entry while a filter is still unanswered is how the pattern’s weak base rate becomes my losing streak.
| Rule | Check | If it fails |
|---|---|---|
| 1. Uptrend first | Price has risen clearly into the pattern on the daily chart | Skip: no trend, no reversal |
| 2. Three candles exact | Every open and close rule in the table above holds | Skip: a near-miss is not the pattern |
| 3. Confirmation candle | A bearish candle closes below candle 1 close | Wait: no trade until it prints |
| 4. Location | Pattern sits at resistance, a prior high, or an overextended leg | Skip: mid-range patterns are noise |
| 5. Session and news | London or New York session, no red-folder news within 30 minutes | Wait for the next session |
| 6. Size fits the day | Risk is 250 dollars or less, inside the 500-dollar daily limit | Reduce size or skip the trade |
Rule 4 deserves emphasis because it is the one I broke most often when I started. An upside gap two crows in the middle of a range, with no resistance above it and no extended leg behind it, has nothing to reverse from. The same three candles at a prior swing high are a different proposition, because sellers there have a level to defend. I mark the level before I look for the pattern, never after, so I cannot talk myself into seeing resistance where none exists.
Entry, stop loss and targets
Entry is a short at the close of the confirmation candle, or on a break below the confirmation candle’s low if that break comes within the next session, whichever prints first. I do not enter at the close of candle 3, and I do not enter on an intraday dip below candle 1’s close that then recovers, because an unclosed dip is not a close. The stop goes above the highest high of candles 2 and 3, plus a 5-pip buffer for spread and wick noise. That stop is wide by design, because the pattern’s highs are the point: if price trades above the crows, the exhaustion story is false and I want out, not a second opinion.
Targets are split. I take half the position off at 1R, move the stop on the remainder to breakeven, and let the second half run to 2R or to the next support level, whichever comes first. The split matters more here than in stronger patterns, because a weak pattern that reaches 1R and reverses is common, and banking half at 1R turns those trades from full losses into small wins. A trade that reaches 2R on both halves pays 1.5R in total, which is the number used in the worked example below. A trade that reaches 1R and then stops me out at breakeven pays 0.5R. A trade that never reaches 1R costs 1R. Those three outcomes, and nothing else, are what the strategy can produce.
Position sizing under a 500-dollar daily limit
My funded account is 100,000 dollars with a 500-dollar daily loss limit, and I risk 250 dollars per trade on this pattern, which is half the daily limit. That leaves room for exactly one more controlled loss in the day, and in practice I take only one upside gap two crows trade per day anyway, because the pattern is rare and a second signal on the same day is usually the same move on a correlated pair. Position size comes from one formula, applied the same way every time, with no rounding up.
| Formula | Inputs | Worked value |
|---|---|---|
| Lots = risk / (stop pips x pip value) | Risk 250 dollars, stop 37 pips, EURUSD pip value 10 dollars per lot | 250 / (37 x 10) = 0.67 lots |
| Actual risk | 0.67 lots x 37 pips x 10 dollars | 247.90 dollars, inside the 250-dollar cap |
| Target 1R / 2R | Entry 1.1098, stop 37 pips above | TP1 1.1061, TP2 1.1024 |
The sizing grid below keeps the same 250-dollar risk across the stop distances this pattern actually produces. A wider stop means a smaller position, never a bigger risk, and if the grid says the size falls below 0.10 lots on my account, I skip the trade rather than trading dust that cannot pay for its own spread. I check the maths on the max daily drawdown calculator before I place the order, because a sizing error on a funded account is a rule breach wearing a calculator’s clothes.
| Stop distance | Lots at 250 dollars risk | Actual risk |
|---|---|---|
| 25 pips | 1.00 | 250.00 dollars |
| 30 pips | 0.83 | 249.00 dollars |
| 37 pips | 0.67 | 247.90 dollars |
| 45 pips | 0.55 | 247.50 dollars |
| 55 pips | 0.45 | 247.50 dollars |
The worked trade, candle by candle
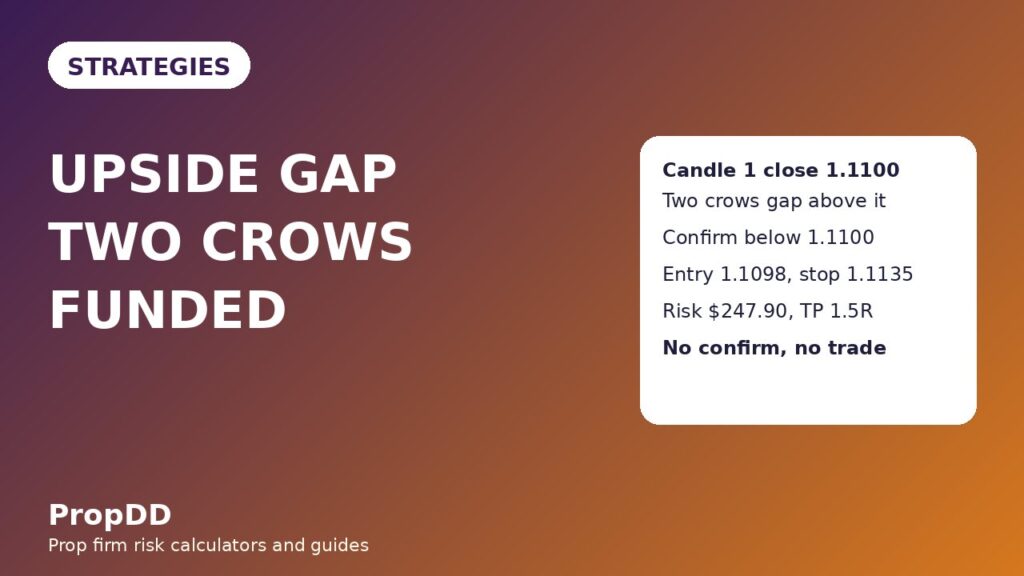
The trade below is a EURUSD daily-chart example built from the rules above, with the same numbers as the sizing table so every figure can be checked. Candle 1 opened at 1.1020 and closed at 1.1100, an 80-pip bullish body at the top of a three-day climb into prior resistance at 1.1100. Candle 2 gapped up to open at 1.1120 and closed at 1.1105, a small red body sitting entirely above candle 1’s close. Candle 3 opened higher again at 1.1125, fell through candle 2’s close, and closed at 1.1103, engulfing candle 2’s body while holding above candle 1’s close. At that point I did nothing, because rule 3 had not passed. The next candle closed at 1.1085, below candle 1’s close, and that close was my confirmation. I shorted 0.67 lots at 1.1098, with the stop at 1.1135, above candle 2’s high plus buffer, and the targets at 1.1061 and 1.1024. Price reached TP1, I banked half for 123.95 dollars, moved the stop to breakeven, and price continued to TP2, where the second half paid 247.90 dollars, for 371.85 dollars in total, or 1.5R.
The eight-trade sample below is the honest version of what this pattern did for me once the confirmation rule was in place. It is not a winning machine. Four wins and four losses netted 1.0R, or 250 dollars on 250-dollar risk per trade, over eight separate days. The unfiltered version of the same eight setups, traded at candle 3’s close without confirmation, lost 3.0R in my journal, because two of the winners above were losers without the filter and one extra fakeout joined them. That 4.0R difference is the entire edge of this strategy, and it comes from a single candle of patience.
| Trade | Pair | Outcome | Result | Dollars |
|---|---|---|---|---|
| 1 | EURUSD | TP2 hit | +1.5R | +375 |
| 2 | GBPUSD | Stop hit | -1.0R | -250 |
| 3 | EURUSD | TP2 hit | +1.5R | +375 |
| 4 | EURUSD | Stop hit | -1.0R | -250 |
| 5 | GBPUSD | Stop hit | -1.0R | -250 |
| 6 | EURUSD | TP1 then breakeven | +0.5R | +125 |
| 7 | EURUSD | TP2 hit | +1.5R | +375 |
| 8 | GBPUSD | Stop hit | -1.0R | -250 |
| Total: 4 wins, 4 losses | +1.0R | +250 | ||
When the strategy fails, and how I recognise it early
The strategy fails in three familiar ways, and each one has an early warning I now respect. First, the confirmation candle prints, I enter, and price immediately reclaims the crows’ highs: that is a failed confirmation, and the stop above the highs ends it for 1R, which is the correct cost of being wrong. Second, red-folder news lands during the trade and price gaps through the stop: the early warning was the calendar, which rule 5 should have caught, and the lesson is that no pattern outranks a central bank decision. Third, I trade the pattern twice in one day on correlated pairs, EURUSD and GBPUSD together, and both stops hit: the early warning is the correlation itself, and my rule is now one pattern trade per day, on one pair.
There is also a quieter failure: loosening the candle rules. A second candle that closes a pip below the first candle’s close is not upside gap two crows, and a third candle that closes inside the first candle’s body is not either. If I have to argue with the chart about whether the rules hold, they do not hold, and I move on.
How upside gap two crows fits the funded rules
The funded fit of this strategy is defensive rather than aggressive. The 250-dollar risk is half the 500-dollar daily limit, so a single loss leaves the day alive and two losses still cannot breach the limit on this pattern alone, provided no other trade is running. The one-trade-per-day cap protects the consistency rule, because a single best day cannot dominate a challenge leg when the strategy only produces one trade a day by construction. As a check, a 375-dollar best day inside a 2,000-dollar challenge profit total is 18.75 percent, inside a typical 30 percent consistency ceiling, and I verify that figure on the prop firm consistency rule calculator before I count any week as clean.
News discipline is part of the funded fit, not an optional extra. I do not hold a two crows trade through a red-folder release for its pair, and I do not open one within 30 minutes of such a release, because a gap through a stop is a loss larger than the planned 1R. Weekend holding is likewise avoided: a pattern confirmed on Friday is traded on Friday or not at all.
How it differs from the patterns it resembles
Three neighbouring patterns cause most of the confusion, and each differs by exactly one rule, which is why the comparison table matters. Three black crows is three consecutive long bearish candles, each closing lower, with no gap requirement and no bullish candle at the start. Evening star is a long bullish candle, a small star candle that gaps up, and then a long bearish candle that closes deep inside the first candle’s body, closing the gap rather than preserving it. Counterattack lines are two candles whose closes are exactly equal, a stalemate rather than a three-candle exhaustion sequence. The plain two crows pattern, without the upside gap, is the closest cousin: its third candle closes inside the first candle’s body, which makes it a stronger reversal signal on paper and a different trade in practice, because the gap-closing close is itself the confirmation that upside gap two crows still waits for.
| Pattern | Candles | Gap survives? | What confirms it |
|---|---|---|---|
| Upside gap two crows | 1 bullish + 2 small bearish | Yes, through candle 3 | A later close below candle 1 close |
| Three black crows | 3 long bearish | No gap rule | Third close below the prior two |
| Evening star | Bullish + star + long bearish | No, third candle closes inside candle 1 | Third candle’s deep close itself |
| Counterattack lines | 2 candles, equal closes | Gap open required, equal close | Confirmation candle after the pair |
| Plain two crows | 1 bullish + 2 bearish | No, third close inside candle 1 | Third candle’s close inside candle 1 |
If a chart shows three black crows, I trade the three black crows rules, not these, and if it shows an evening star, I trade that article’s rules instead. Mixing the entry of one pattern with the stop of another gives you the worst of both. For trend context, the trend pullback strategy remains my default when price is still trending cleanly, and two crows only earns a trade when that trend has actually shown the exhaustion this article describes.
My daily routine for this pattern
My routine is short because the pattern is rare, and a long routine for a rare pattern is an invitation to invent signals.
| Time | Action | Tool or check |
|---|---|---|
| Morning | Mark resistance, check trend, check news calendar | Daily chart, economic calendar |
| Session open | Scan EURUSD and GBPUSD daily candles only | Candle-close check, no intraday entries |
| Pattern completes | Set alert at candle 1 close, wait for confirmation | Price alert, no order yet |
| Confirmation prints | Size the trade, check daily headroom, place bracket | Sizing formula, drawdown calculator |
| After the trade | Log candles, entry, stop, targets and outcome | Journal, consistency check |
Frequently asked questions
Is upside gap two crows a strong reversal pattern?
No, and that honesty is the point of this article. Published backtest summaries describe it as unreliable without confirmation, sometimes acting as a continuation rather than a reversal. I trade it only with the confirmation candle, at resistance, with half the daily limit at risk, and I still expect roughly half of confirmed trades to lose. Its value is not a high win rate, it is a defined, rare setup with a clear invalidation point.
Can I enter at the close of the third candle instead of waiting?
You can, but you are trading a different strategy with a worse record, and my own journal says so plainly: the unfiltered version of my eight-trade sample lost 3.0R where the filtered version made 1.0R. Waiting costs the first part of the move. Skipping the wait cost me 412 dollars in a single morning. I wait.
Does the gap have to be exact, or is close enough good enough?
The gap rule is exact in one direction: both bearish candles must close above the first candle’s close. A close a single pip below that level closes the gap and turns the pattern into plain two crows, which has its own rules. I do not round this in my favour, because every pip of loosening is a pip of self-deception.
Which pairs and timeframes work best for this pattern?
I trade it on EURUSD and GBPUSD daily charts only, because the pattern’s three-candle structure needs clean closes and liquid sessions to mean anything. Lower timeframes print the shape far more often and far less reliably, and the wider stops they imply relative to noise make the funded maths worse, not better. One pair per day, one trade per day.
How is this different from three black crows?
Three black crows are three long bearish candles in a row, each closing lower, with no gap and no opening bullish candle. Upside gap two crows starts with a long bullish candle, follows it with two small bearish candles that gap above it, and preserves that gap through the third candle. The two patterns can appear near each other, but their entries, stops and confirmation rules are different, and I never mix them.
Is one pattern enough to pass a prop firm challenge?
No. A pattern that appears a few times a month cannot carry a challenge on its own, and anyone selling it as a standalone system is selling the picture, not the maths. I use upside gap two crows as one setup inside a wider funded routine, alongside trend pullback trades and strict daily-loss discipline, and its contribution is a handful of defined, patient shorts per quarter, not a daily income.
Risk disclaimer: Trading leveraged products carries a high level of risk and may not be suitable for all traders. The examples in this article use a simulated funded-account rule set for education only, and past pattern performance does not guarantee future results. Always check your firm’s current rulebook before trading a pattern live.


