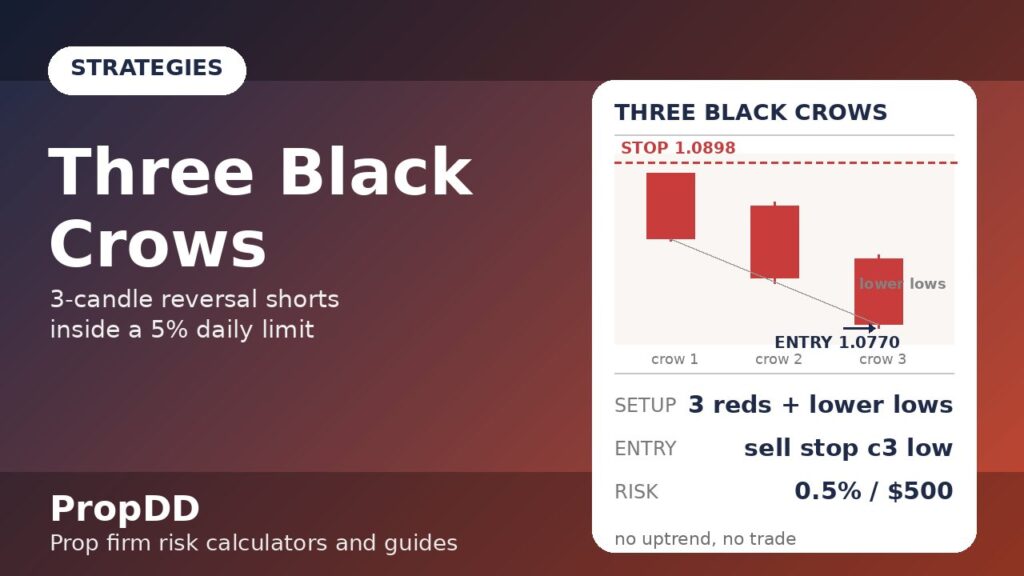
It was a Wednesday during the London session, and EURUSD had been climbing for six straight days. Then the daily chart printed three fat red candles in a row — each one opening inside the previous candle’s body and closing near its low, a staircase down. Three black crows. I placed a sell stop below the third candle’s low with my stop above the first candle’s high, risked my usual 0.5%, and watched the pair slide another 120 pips over the next two days for +$1,500. The lesson I took from that week: three red candles in a row after a long rally is the market telling you the buyers have left the building.
A year earlier I had seen the same shape on GBPUSD and sold the close of the third candle with no plan — wide stop, full 1% risk, during the Asian session. Price chopped sideways for two days, wicked through my stop, and then fell without me for -$1,000. Same pattern, same me, one difference: rules. This article is my full 6-rule three black crows plan for funded accounts: what the pattern actually is, the quality filter that removes the fakes, the entry below the third candle, the stop above the first candle, the 0.5%-risk sizing maths on a 100k account, and the session filter that keeps a prop firm daily loss limit intact. It is the bearish mirror of the three white soldiers strategy — same framework, flipped. You can run the numbers on the Three Black Crows Calculator page.
What three black crows actually are
Three black crows is a three-candle bearish reversal that appears after a clear uptrend: three consecutive long-bodied bearish candles, each opening within the previous candle’s body and closing lower, near its own low. Every candle posts a lower low. The psychology is a slow-motion changing of the guard — sellers press a little harder each session while buyers fail to lift price even once. Thomas Bulkowski’s pattern statistics give it unusual respectability: in his testing the pattern acts as a bearish reversal 78% of the time and ranks 3rd out of 103 candlestick patterns for overall performance (see his three black crows research page). Few reversal patterns carry that kind of statistical backing, which is one reason I gave it a permanent slot in my funded-account playbook.
| Candle | What I need to see | Why it matters |
|---|---|---|
| Candle 1 (the first crow) | A long red body that opens near the prior session’s close and closes well lower, after a clear uptrend of 8–12 candles | The first real sign the rally is exhausted — one red candle alone is noise, but a long one starts the story |
| Candle 2 (the second crow) | Opens within candle 1’s body and closes lower, near its low, with a lower low than candle 1 | Confirms the selling is persistent, not a one-session dip-buying opportunity |
| Candle 3 (the third crow) | Opens within candle 2’s body, closes lower again near its low, tiny or no lower wick | Three straight sessions of sellers in control — the pattern is complete and tradeable |
| What disqualifies it | Long lower wicks on any candle, bodies that shrink instead of holding size, or the pattern printing mid-range with no uptrend behind it | Wicks mean buyers fought back; shrinking bodies mean momentum is fading, not building; no trend means no reversal |
How is this different from a bearish engulfing? A bearish engulfing is one loud candle swallowing the prior body — fast and violent. Three black crows is the slow version: three sessions of grinding selling. That slower build is exactly why funded traders should prefer it — the entry, stop and target levels are cleaner, the stop sits at an objective pattern extreme, and you are never chasing a single spike. It is also the mirror of three white soldiers (#52 in this series), which is why the two articles share the same 6-rule skeleton with every direction flipped.
The 6-rule three black crows plan
These are the exact rules I trade on my funded accounts. Rule 3 — the pattern-quality filter — is the one that separates my current results from that -$1,000 GBPUSD chop-out.
| Rule | The rule | My notes |
|---|---|---|
| 1. Trend context | A clear uptrend first: 8–12 candles of higher highs and higher lows on H1, H4 or Daily | No uptrend, no three black crows. Three red candles in a range are just the bottom of the box forming |
| 2. Location | The pattern must sit at resistance, a supply zone, a round number, or an overbought RSI extreme | Confluence turns a textbook print into a tradeable rejection — location is half the edge |
| 3. Pattern quality | Three long bodies of similar size, each closing near its low, each posting a lower low, no long lower wicks | Shrinking bodies or long wicks mean the sellers are running out of steam — I skip those prints entirely |
| 4. Entry | Sell stop below the low of candle 3 — let the breakdown trigger the trade; or sell the close of a confirming fourth bearish candle | Entering on the break keeps me out of the chop that killed my early attempts; the entry is mechanical, not emotional |
| 5. Stop loss | Above the high of candle 1 plus a buffer (5–10 pips on FX, 0.5–1.0 points on gold) | Objective invalidation: if price retakes the top of the pattern, the reversal thesis is dead |
| 6. News blackout | No new position within 30 minutes of red-folder news on either currency | News spikes shred candle logic — the pattern means nothing when algos are repricing (see the news trading guide) |
The 0.5%-risk sizing maths
Three black crows stops are honest but not tiny — candle 1’s high to below candle 3’s low can be 60–100 pips on H1 majors and 15–25 points on gold. That is fine, because the rule that matters is not stop size but risk size: 0.5% of the account per three-crows trade, fixed, no exceptions. One pattern at a time — I never stack a second crows short while the first is open.
Position-size formula
In this article
Lots = Risk ($) ÷ (Stop distance × Value per lot per unit)
| Step | My worked EURUSD example |
|---|---|
| The pattern | Candle 1: high 1.0890, low 1.0840. Candle 2: opens 1.0865, closes 1.0810. Candle 3: opens 1.0825, closes 1.0775 near its low — three long bodies, lower lows, tiny wicks, qualifies |
| Account and risk | $100,000 account × 0.5% = $500 maximum loss on the trade |
| Entry and stop | Sell stop at 1.0770 (below candle 3’s low); stop at 1.0898 (candle 1 high 1.0890 + 8-pip buffer) = 128 pips of risk |
| Position size | $500 ÷ (128 × $10 per pip per lot) = 0.39 lots — I sanity-check the budget against the max daily drawdown calculator |
| Targets | Bank half at 1.5R (1.0578), trail the rest to 2R (1.0514) |
| Outcomes | Win: +$1,000 (+1.0% on the account). Loss: −$500 (−0.5%, just 10% of a 5% daily limit) |
Before every order I check the planned $500 loss against the day’s remaining allowance — one scratch earlier in the session and my effective risk budget is thinner. And I keep a personal daily stop at half the firm’s limit (the personal daily stop guide explains why), so four consecutive three-crows losers end my day at −2% instead of letting frustration end my account.
When I trade it: sessions, pairs and the routine
Three black crows is a multi-session pattern, which makes it unusually flexible — but the entry trigger still needs real order flow behind it:
| Window | How I treat three black crows |
|---|---|
| London open, 07:00–10:00 GMT | Prime time for the breakdown trigger — deep liquidity, and the sell stop below candle 3 fills cleanly |
| New York morning, 12:00–15:00 GMT | Best for gold and indices; US data can accelerate the slide, which is exactly why the news blackout applies |
| Daily chart | My favourite timeframe for this pattern — the cleanest prints, the most honest stops, no intraday noise |
| Asian session | Skipped for entries — thin-volume breakdowns fake out and retest the pattern high |
| 30 min before/after red news | Hard skip. A CPI print can invalidate ten perfect patterns in a row |
| Best pairs | EURUSD and GBPUSD on H1–Daily, XAUUSD on H1–H4, US30 on H1 |
I tested it: 10 three black crows on a 100k demo account
I logged ten consecutive qualifying three-crows patterns on a 100k demo over five weeks — 0.5% risk ($500) each, half banked at 1.5R, runner to 2R, no discretionary overrides:
| # | Pair | Entry | Outcome | R | P&L |
|---|---|---|---|---|---|
| 1 | EURUSD | 1.0850 → 1.0790 | Full target | +1.5 | +$750 |
| 2 | GBPUSD | 1.2710 short, stopped 1.2745 | Pattern high taken | −1.0 | −$500 |
| 3 | XAUUSD | 2590.00 → 2572.00 | Runner hit 2R | +2.0 | +$1,000 |
| 4 | EURUSD | 1.0920 short, stopped 1.0952 | Pattern high taken | −1.0 | −$500 |
| 5 | US30 | 44,900 → 44,500 | Full target | +2.0 | +$1,000 |
| 6 | GBPUSD | 1.2830 → 1.2770 | Full target | +1.5 | +$750 |
| 7 | XAUUSD | 2610.00 short, stopped 2618.50 | Pattern high taken | −1.0 | −$500 |
| 8 | EURUSD | 1.0880 → 1.0840 partial | Banked half at 1.5R, runner stopped at breakeven | +1.0 | +$500 |
| 9 | GBPUSD | 1.2690 → 1.2610 | Runner hit 2R | +2.0 | +$1,000 |
| 10 | US30 | 45,200 short, stopped 45,380 | Pattern high taken | −1.0 | −$500 |
The recount: 6 wins, 4 losses (60%), average winner +1.67R, net +6.0R ≈ +$3,000 on the demo. Every stopped trade shares one trait — the pattern printed without a real uptrend behind it (trades 2, 4 and 10) or into a news window I should have respected (trade 7). Every qualifying London/New York pattern with a genuine rally behind it either banked or ran to target. That is why rules 1 and 6 exist: the pattern is only as honest as the trend and the liquidity behind it.
When this strategy fails
Three failure modes account for nearly all of my three-crows losses. First, the trendless print: three red candles in the middle of a range, no uptrend behind them — rule 1 exists precisely because these chop you to pieces. Second, the wick warning: long lower wicks on candles 2 or 3 mean buyers are already fighting back, and the breakdown trigger fakes out — rule 3’s quality filter is the defence. Third, the news spike: a pattern completes at 12:55 GMT, CPI lands at 13:30, and price rips straight through the pattern high — the blackout is non-negotiable. A fourth, subtler killer is the overextended entry: chasing the breakdown three candles late, after the move has already travelled most of its measured distance. If the sell stop triggers more than one average candle-range below candle 3’s low, I let it go — late entries turn a 2R plan into a 0.5R hope.
How it fits prop firm rules
Three black crows is unusually prop-firm-friendly, and here is why. The stop is objective and pre-placed, so 0.5%-risk sizing keeps every single trade inside a 5% daily loss limit — even four consecutive losers cost just 2% of the account. The pattern resolves over days on the higher timeframes, which suits firms with minimum trading days rules: you can collect qualifying days with one clean position instead of overtrading. And because the entry is a resting sell stop — not a discretionary click — the strategy survives consistency rules: no oversized revenge trades, no chasing. The one watch-out is the trailing drawdown: bank the half at 1.5R and move the runner’s stop to breakeven, so a turned runner never gives back the booked profit. Slow, mechanical, rules-based — that is exactly the profile funded accounts reward.
Frequently asked questions
What is the three black crows pattern?
How is it different from three white soldiers?
What timeframe works best?
Can I trade it during news?
Where exactly do I place the stop?
Does it work on a prop firm account?
Risk disclaimer: trading involves risk and most traders lose money. This article is educational and describes my own demo-account experience — it is not financial advice. Never risk money you cannot afford to lose, and always follow your prop firm’s rules.




3 comments
[…] bearish three-candle story appeals to you but you want the version with no star requirement, the three black crows covers that — three straight bearish bodies, different maths, same funded-account […]
[…] of the confusion, and each differs by exactly one rule, which is why the comparison table matters. Three black crows is three consecutive long bearish candles, each closing lower, with no gap requirement and no […]
[…] are also worth separating, because they share candles with the advance block but not its rules. Three black crows is the bearish mirror in black candles: three strong black candles closing lower, a reversal […]