I lost 500 dollars on my first AUDUSD trade without misreading a single candle. The setup was a clean Sydney-range break, the entry was where I planned it, and the stop was exactly where I said it would be. The problem was what I traded it alongside. I was already long NZDUSD on the same commodity-dollar idea, so when China data disappointed that morning, both pairs fell together, both stops went together, and a day that should have cost 500 dollars cost 1,000. AUDUSD is the pair that punishes a good idea taken twice, because its pip value looks so simple that nobody checks the exposure behind it, and that simplicity is exactly the trap this guide is about.
In this article
- What AUDUSD actually is
- The 10-dollar pip and why it needs no conversion
- Why the easy pip is the trap
- What actually moves the Aussie
- My AUDUSD session plan
- The worked trade: entry, stop and targets
- Sizing grid and the calculator check
- When I do not trade AUDUSD
- Filtered versus unfiltered: what the rules are worth
- My daily AUDUSD routine
- Frequently asked questions
Every number in this guide uses the same account as the rest of this series: a 100,000-dollar funded account, a 5,000-dollar firm daily loss limit, and a personal daily stop of 1,000 dollars. I risk 500 dollars per trade, 0.5 percent of the account. If two trades stop out, my day is over at minus 1,000 dollars, with 4,000 dollars of firm headroom untouched. That buffer is the point: the sizing has to survive the losing days, not just celebrate the winning ones.
What AUDUSD actually is
AUDUSD is the Australian dollar priced in US dollars, known to traders as the Aussie. A quote of 0.6980 means one Australian dollar costs 69.80 US cents. The Australian dollar is the base currency, the US dollar is the quote currency, and that order decides everything about the pip maths in this guide. One standard lot is 100,000 Australian dollars, one pip is 0.0001, and because the quote currency is the same currency as my funded account, the pip value needs no conversion step at all. The Reserve Bank of Australia’s own explainer on what drives the Australian dollar makes the same fundamental point in official terms: commodity prices, especially iron ore, move Australia’s terms of trade, and a rise in the terms of trade is associated with an appreciation of the Aussie. I agree with that summary, and the funded-account consequence is what the rest of this guide adds: a currency that moves on export prices needs a session plan and an exposure rule, not just a pip calculation.
AUDUSD is also the liquid one of the two commodity dollars. Where the Kiwi thins out in Wellington hours, the Aussie trades properly from the Sydney open, because Australia’s own session is a real session for this pair, with real volume behind it. That liquidity is a feature with a cost attached: the pair reacts to Sydney data, to Chinese data released in the Asian morning, and to iron-ore moves overnight, so by the time London opens, AUDUSD has often already had its first move of the day. A funded trader’s job is to know whether that first move is the day’s direction or just its opening noise, before risking 500 dollars on it.
The 10-dollar pip and why it needs no conversion
Here is the whole pip story for AUDUSD in one table, and it is deliberately boring. Boring is good. Boring means there is nothing to convert, nothing to look up mid-trade, and no second exchange rate that can move against you between the entry and the stop-out.
| Contract fact | AUDUSD value | What it means for sizing |
|---|---|---|
| Base / quote currency | AUD / USD | Quote currency is USD, same as the account |
| Contract size, 1.00 lot | 100,000 AUD | One pip moves 100,000 AUD by 10 dollars |
| Pip size | 0.0001 | The fourth decimal place |
| Pip value, 1.00 lot | 10 dollars | Fixed, no division or multiplication needed |
| Pip value, 0.10 lot | 1 dollar | Mini lot, for fine-tuning a size |
| Position-size formula | Lots = 500 / (stop in pips x 10) | The only formula this pair needs |
Compare that with the cross pairs this series has already covered, because the comparison is where the AUDUSD lesson lives. On EURAUD, the pip is earned in Australian dollars and converted by multiplying by AUDUSD, giving a 6.50-dollar pip at 0.6500. On NZDJPY, the pip is earned in yen and converted by dividing through USDJPY, giving a 6.67-dollar pip at 150.00. On NZDUSD, the Aussie’s commodity-dollar cousin, the pip is also a fixed 10 dollars, which is precisely why the two pairs get traded as one idea and why the exposure rule in this guide matters more than the arithmetic. AUDUSD skips every conversion. One lot, one pip, 10 dollars, at any price, in any session. If you have ever sized a cross pair wrong because the conversion rate moved, you already know why a fixed pip is worth more than it looks.
The fixed pip also makes the sizing arithmetic checkable in your head, and I check it out loud before every AUDUSD entry: stop in pips, times 10, times lots, must equal 500 or less. A 50-pip stop at 1.00 lot is 500 dollars. A 40-pip stop at 1.25 lots is 500 dollars. A 25-pip stop at 2.00 lots is 500 dollars. If the product is over 500, the size is wrong, whatever the chart says. That three-second check is the entire risk system for this pair, and it would have saved my first AUDUSD week, because two 1.00-lot trades on the same idea at 50-pip stops are not two 500-dollar risks, they are one 1,000-dollar risk wearing two tickets.
Why the easy pip is the trap
A fixed pip value creates two traps, and both of them cost funded traders their accounts quietly. The first is the Sydney-morning trap: because AUDUSD is liquid in Sydney, traders take full-size entries on Sydney moves that are really just the overnight iron-ore or China reaction, and then London reverses them. The second trap is the one that cost me 1,000 dollars in a morning: correlation doubling. AUDUSD and NZDUSD move together most of the time, because both are commodity dollars driven by China demand and risk sentiment, so taking the same direction on both pairs at the same time is very often one trade wearing two jackets.
| The exposure trap | Size used | Stop | Actual risk | Verdict |
|---|---|---|---|---|
| Sydney break chased at full size | 1.00 lot | 50 pips | 500 dollars | Correct size, wrong session for the entry |
| Correct AUDUSD size, alone | 1.00 lot | 50 pips | 500 dollars | Exactly my per-trade risk |
| Correlated double: AUDUSD plus NZDUSD | 1.00 lot each | 50 pips each | 1,000 dollars combined | My whole personal daily stop in one move |
| Correlated double plus a Kiwi cross | 1.00 lot each, three tickets | 50 pips each | 1,500 dollars combined | Past the personal stop before London opens |
The correlation row deserves emphasis, because it is the mistake that looks like diversification. Two pairs, two charts, two entries, and one shared driver, so when the driver turns, both stops go together, and a day that should have cost 500 dollars costs 1,000. My rule now is simple: AUDUSD and NZDUSD share one risk slot. If I am long AUDUSD, I do not also go long NZDUSD that day, and if I want the Kiwi trade more, I take it instead of the Aussie trade, not as well as it. The same rule applies to EURAUD on the Aussie side: I trade one Australian-dollar exposure at a time, because the Aussie is the risk, not the pair name on the ticket.
What actually moves the Aussie
AUDUSD has four drivers that matter, and they arrive in a predictable order of importance. First is iron ore, because it is Australia’s largest export and China is its largest buyer, so an iron-ore move is a terms-of-trade move and the Aussie follows it within days. Second is the Reserve Bank of Australia, whose rate decisions move the pair violently when they surprise, because the Aussie is a yield-sensitive currency and the market reprices it in minutes. Third is China, Australia’s largest trading partner, so a weak Chinese PMI print hits AUDUSD through the export channel even though China is not in the pair. Fourth is risk sentiment itself: when global markets want risk, the Aussie rises with the other commodity currencies, and when they do not, it falls first and fastest, because it is a high-beta currency that amplifies the global mood.
For a funded trader, the practical version of that list is a news rule with teeth. I do not hold an AUDUSD trade through an RBA decision, a Chinese PMI release, or a high-impact US release, because the spread widening and the gap risk around those events turn a 50-pip stop into a 70-pip fill, and a 500-dollar risk into a 700-dollar loss. The USDCAD guide in this series makes the same point about oil-linked pairs and inventory data, and the logic transfers exactly: the driver that gives a pair its personality is also the driver that breaks its stops. Trade the Aussie on its ordinary days, and sit out its event days, because the funded account pays for consistency, not for correctly guessing a central bank.
My AUDUSD session plan
AUDUSD is tradeable in every session, but it is not equally tradeable, and the session plan below is the filter I run before I even look for a setup. Sydney opens the pair’s day with real volume, and it is where the overnight iron-ore and China reaction gets priced in, so I use it for marking levels and watching the first move, not for chasing it. Tokyo adds volume but often just extends the Sydney move. London is where the pair usually picks its direction for the European day, and New York is where that direction either confirms or reverses on US data. My entries live in London and New York, and Sydney exists to set up those entries, even though it is a busier session for this pair than it is for the Kiwi.
| Session | Hours (UTC, approximate) | What AUDUSD does | My rule |
|---|---|---|---|
| Sydney | 21:00 to 01:00 | Real volume, overnight reaction priced in | Mark levels, watch the first move, no chasing |
| Tokyo | 00:00 to 06:00 | Volume continues, China data lands here | Watch only, unless a level breaks cleanly |
| London | 07:00 to 11:00 | Direction usually chosen, cleanest moves | Main entry window |
| New York | 13:30 to 16:00 | US data confirms or reverses London | Second entry window, no new trades after 16:00 |
| Event windows | RBA, China PMI, US CPI / NFP | Spreads spike, stops gap | Flat 30 minutes either side |
One more session habit is worth writing down, because it is specific to this pair. AUDUSD often makes its Sydney range, breaks it in London, and then retests the break in New York, which means the best AUDUSD entry of the day is frequently not the London breakout itself but the New York retest of it. Traders who chase the London break at full size get stopped on the retest, and traders who wait for the retest get the same direction with a tighter stop and a better price. On a funded account, where every stop costs half of the personal daily budget, waiting for the retest is not patience for its own sake, it is the sizing decision disguised as a timing decision.
The worked trade: entry, stop and targets
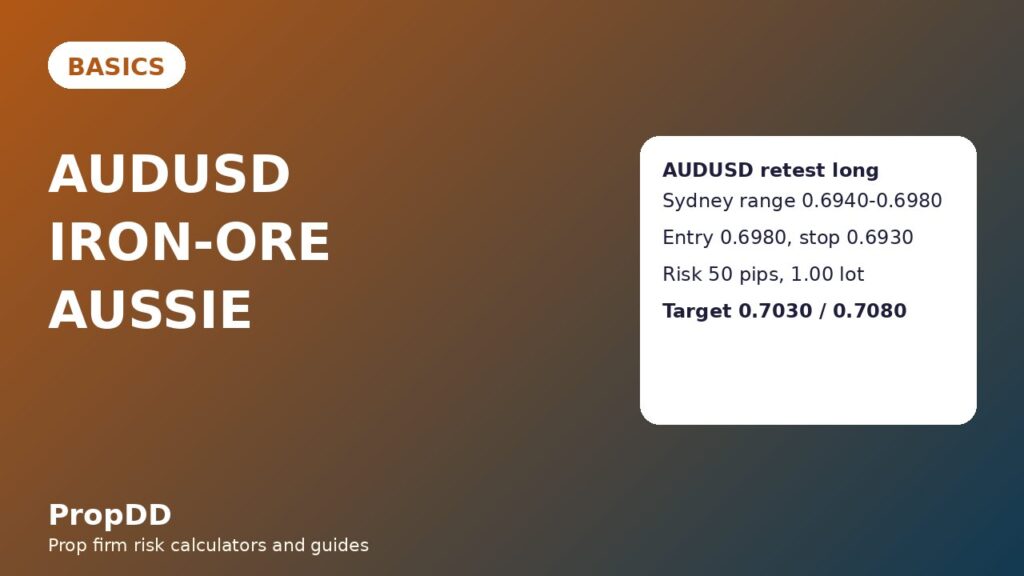
The trade that fixed my AUDUSD sizing happened on a Thursday in the London session. AUDUSD had ranged overnight in Sydney between 0.6940 and 0.6980, broke higher in London on no news, and pulled back to 0.6980 in the early New York hours, which was both the top of the Sydney range and a round number. I went long at 0.6980, with my stop below the Sydney range low area at 0.6930, a 50-pip stop, and at 1.00 lot that is exactly 500 dollars of risk, checked out loud before I clicked. The first target was 0.7030, 50 pips, where I took half off for 250 dollars, and the second target was 0.7080, 100 pips, where the rest banked 500 dollars. Total if both targets hit: 750 dollars, which is 1.5R, and the table below shows every step, because a worked example that hides a step is not a worked example.
| Trade element | Level | Maths |
|---|---|---|
| Sydney range | 0.6940 to 0.6980 | 40-pip overnight range, marked before London |
| London break | Above 0.6980 | Clean break, no news behind it |
| Entry (long) | 0.6980 | New York retest of the broken range top |
| Stop loss | 0.6930 | Below the range, 50 pips of risk |
| Position size | 1.00 lot | 500 divided by (50 pips x 10 dollars) |
| Risk in dollars | 500 dollars | 1.00 x 50 x 10, exactly my per-trade risk |
| First target (half off) | 0.7030 | 50 pips, 1R, bank 250 dollars |
| Second target (rest off) | 0.7080 | 100 pips, 2R, bank 500 dollars |
| Total if both targets hit | 750 dollars | 250 plus 500, which is 1.5R |
Notice what the trade did not do. It did not chase the London break, it did not double up with a NZDUSD long on the same idea, and it did not hold through a data release. Any one of those three choices would have turned a winning trade into a breakeven day or a losing day, and the chart would have looked identical in all three versions. Funded trading is full of trades where the chart is right and the account still loses, and AUDUSD, with its deceptively simple pip and its shared commodity story, produces more of those than any cross pair I trade.
Sizing grid and the calculator check
The sizing grid below is the table I keep next to the AUDUSD chart, because it removes the one calculation that used to go wrong. Every row risks 500 dollars or a few dollars under it, never over, because sizes are always rounded down, not to the nearest lot. A size that rounds up is a size that risks more than the plan allows, and the plan is the only thing standing between a funded account and a blown one.
| Stop distance | Size (lots) | Risk in dollars | Notes |
|---|---|---|---|
| 25 pips | 2.00 | 500 dollars | Tight stops only, London retests |
| 30 pips | 1.66 | 498 dollars | Rounded down from 1.67 |
| 40 pips | 1.25 | 500 dollars | Standard range-break stop |
| 50 pips | 1.00 | 500 dollars | The worked trade above |
| 60 pips | 0.83 | 498 dollars | Rounded down from 0.84 |
| 80 pips | 0.62 | 496 dollars | Wide stops, RBA-week trades only |
Before I take an AUDUSD trade, I run the same numbers through the site’s max daily drawdown calculator, because a per-trade size is only half the risk picture. The table below is what that check looks like for the worked trade, and it is the step that connects one trade to the whole day: one loss leaves 500 dollars of personal room, two losses end the day, and the firm limit is never the binding constraint, because my personal stop is always hit first. That is by design. A personal stop that is tighter than the firm limit is the only stop that actually protects a funded account, because by the time the firm limit matters, the account is already gone.
| Calculator input | Value | Calculator output | Value |
|---|---|---|---|
| Account size | 100,000 dollars | Position size | 1.00 lot |
| Firm daily loss limit | 5,000 dollars | Risk on this trade | 500 dollars |
| Personal daily stop | 1,000 dollars | Personal room after one loss | 500 dollars |
| Stop distance | 50 pips | Personal room after two losses | Day over, 0 dollars |
| Pip value | 10 dollars per lot | Firm headroom after personal stop | 4,000 dollars untouched |
When I do not trade AUDUSD
There are days when the correct AUDUSD trade is no trade, and recognising them is worth more than any setup in this guide. I do not trade AUDUSD into an RBA decision, because the repricing is too fast for a 50-pip stop to mean anything. I do not trade it when China data is due in the Asian morning and I cannot watch the reaction, because the gap risk is priced into the Sydney open before I can react to it. I do not trade it when I am already exposed to the Aussie through EURAUD, or to the commodity-dollar story through NZDUSD, because that is one risk counted twice. And I do not trade it after two losses, because the personal daily stop is a rule, not a suggestion, and the third trade of a losing day is almost never the trade that saves the day. The EURGBP guide in this series makes the same no-trade point about range days, and it applies here with even more force, because AUDUSD’s quiet days are quieter and its event days are wilder than the euro crosses.
The five-trade log below is what a filtered AUDUSD week actually looked like once those no-trade rules were in place. Two winners, one loss, one breakeven scratch where the retest failed and I got out flat, and one more winner, for 1,750 dollars, which is 3.5R on 500-dollar risk. The breakeven trade is the one I am proudest of, because getting out flat on a failed retest used to be a full stop for me, and the difference between flat and minus 500, repeated across a month, is the difference between a funded account that survives and one that does not.
| Trade | Setup | Result | Running total |
|---|---|---|---|
| 1 | London break, New York retest long | +750 dollars | +750 dollars |
| 2 | Sydney range fade, no London follow-through | -500 dollars | +250 dollars |
| 3 | Retest long, rejection wick fails | +750 dollars | +1,000 dollars |
| 4 | Retest long, stalled at entry, scratched flat | 0 dollars | +1,000 dollars |
| 5 | New York continuation long | +750 dollars | +1,750 dollars |
Filtered versus unfiltered: what the rules are worth
The filter test below compares the same twelve AUDUSD trades with and without the rules in this guide: the session filter, the one-Aussie-exposure rule, the event flat rule, and the retest entry instead of chasing the break. The unfiltered version takes every signal, including Sydney chases, event trades, and doubled commodity-dollar exposure, and it ends the sample exactly flat, which is the cruellest result in trading, because it feels like the strategy almost works. The filtered version takes only the trades that pass every rule, and it ends up 4,000 dollars, which is 8R, with the best single day at 750 dollars, or 18.8 percent of the net, comfortably inside a 30 percent consistency ceiling.
| Version | Trades | Wins / losses | Net result | Best day share |
|---|---|---|---|---|
| Filtered (all rules on) | 12 | 8 wins / 4 losses | +4,000 dollars (+8R) | 750 dollars, 18.8 percent of net |
| Unfiltered (every signal) | 15 | 6 wins / 9 losses | 0 dollars (0R) | 750 dollars, no net to measure against |
| Filter worth | 3 fewer trades | 2 more wins, 5 fewer losses | +4,000 dollars | Consistency ceiling respected |
The lesson is not that AUDUSD is a great pair or a bad pair. The lesson is that a fixed 10-dollar pip makes the maths easy and the discipline hard, because nothing in the arithmetic warns you when you have doubled your exposure, chased a Sydney move, or traded into an RBA decision. The filter is the warning system, and on this pair it is worth 4,000 dollars across fifteen trades, which is more than most traders make from a new indicator in a year.
My daily AUDUSD routine
The routine below is the whole guide compressed into a checklist, and I run it in order, because order is what stops a checklist from becoming a decoration. Levels first, then the calendar, then the exposure check, then the size check, and only then the entry. Any step that fails stops the process, and a stopped process is a successful day, because the funded account does not pay for trades that should not have happened.
| Step | Action | Time | Pass / fail rule |
|---|---|---|---|
| 1 | Mark Sydney range and London levels | Before London open | No levels, no trade |
| 2 | Check RBA, China PMI and US data calendar | Before London open | Event within 30 minutes: stay flat |
| 3 | Check existing Aussie and commodity-dollar exposure | Before entry | Already exposed: skip this trade |
| 4 | Size from the grid, check out loud: pips x 10 x lots | Before entry | Over 500 dollars: reduce size |
| 5 | Enter on the retest, not the break | London or New York window | No retest, no entry |
| 6 | Run the drawdown calculator check | Before entry | Two-loss day: stop trading |
| 7 | Journal the trade, including skipped trades | End of day | No journal, no next-day trading |
Frequently asked questions
Is AUDUSD a good pair for a funded account?
Yes, with the filters in this guide. Its fixed 10-dollar pip makes sizing simple, its Sydney session gives it real early volume, and its drivers are understandable. It is a bad pair only when traded by chasing Sydney moves, into events, or doubled with NZDUSD, and all three of those are choices, not properties of the pair.
What is the pip value of AUDUSD on a standard lot?
10 dollars per pip on a 1.00 lot, fixed at any price, because the quote currency is US dollars and a standard lot is 100,000 Australian dollars. A 0.10 lot is 1 dollar per pip, and a 0.01 lot is 10 cents per pip.
How do I size an AUDUSD trade for 500 dollars of risk?
Divide 500 by the stop distance in pips times 10. A 50-pip stop gives 1.00 lot, a 40-pip stop gives 1.25 lots, and a 25-pip stop gives 2.00 lots. Always round down, never up, so the risk is 500 dollars or a few dollars under it, never over.
Why did my NZDUSD trade double my AUDUSD risk?
Because both are commodity dollars driven by China demand and risk sentiment, so the same directional trade on both pairs often stops out together. Two 1.00-lot trades at 50-pip stops are not two separate 500-dollar risks on a day like that, they are one 1,000-dollar risk. My rule is one commodity-dollar risk slot per day, filled by whichever pair has the cleaner setup.
Can I trade AUDUSD and EURAUD at the same time?
You can, but on a funded account you should count them as one Australian-dollar exposure, not two independent trades. EURAUD moves on the Aussie against the euro, so an AUDUSD long and a EURAUD short can be the same Aussie view twice over. My rule is one Aussie exposure at a time, whichever pair expresses it cleanest.
When should I avoid trading AUDUSD?
Avoid it into RBA decisions, Chinese PMI releases and high-impact US releases, when you cannot watch the Asian-morning reaction, when you are already exposed to the Aussie or the commodity-dollar story, and after two losses have hit your personal daily stop. On those days the correct AUDUSD trade is no trade.
Trading involves substantial risk of loss and is not suitable for every investor. The numbers in this guide describe my own funded-account rules and a worked example, not a promise of results. Always check your firm’s current rulebook before trading, because daily loss limits, news rules and consistency requirements change, and the firm’s rules override anything written here.




3 comments
[…] that with the pairs around it. AUDUSD is the direct Aussie pair, with a fixed 10-dollar pip value and a single central-bank story plus […]
[…] When I cannot point to one of those four drivers for a planned AUDNZD trade, I skip it and trade AUDUSD instead, where at least the dollar leg gives the trade a second […]
[…] on a day the Aussie has already moved 50 pips — a 50-pip move is a 7% move in my point value. The AUDUSD guide on this site explains why the Aussie moves on iron ore and rate differentials, and the same forces […]