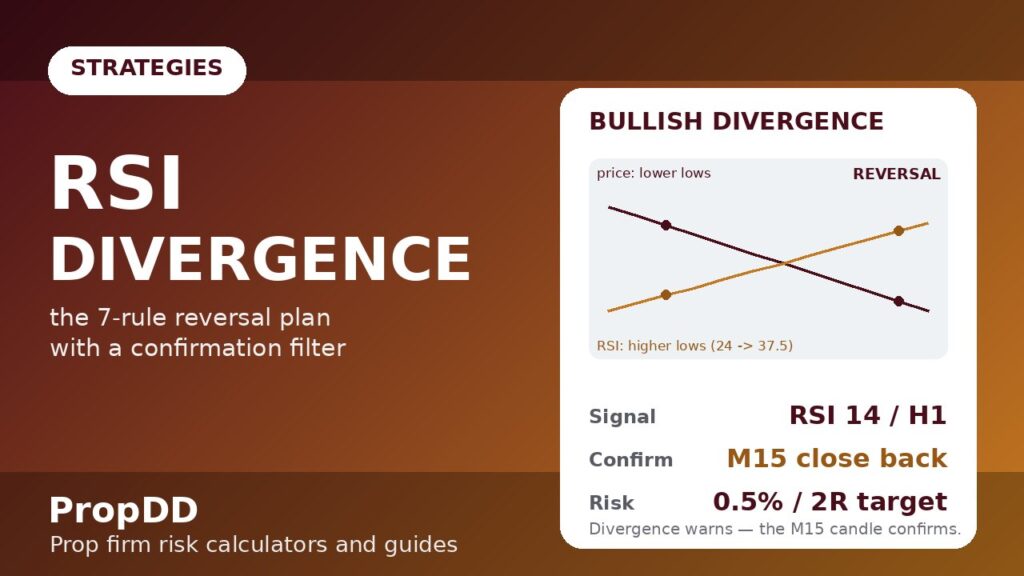
I blew $620 in one March week buying every RSI divergence I saw on M15, and the worst part is that most of the divergences were real. Price printed lower lows, RSI printed higher lows, the textbook bullish divergence was right there on my screen — and then price dropped another 40 pips anyway, because a divergence is a warning, not an entry. I was treating a yellow traffic light like a green one. On a challenge account with a 5% daily loss limit, four “real” divergences in a row is how you learn that indicators describe momentum, they do not promise reversals. The plan below is what survived that week: a 7-rule RSI divergence strategy for prop firm traders built around RSI 14, a confirmation filter that keeps me out of the early-catch game, and position sizing that assumes one in three signals still fails. If you want the pure mechanics of the indicator first, read my RSI guide for prop firm traders — this article is the strategy that turns its signals into funded-account trades.
In this article
- What RSI divergence actually measures: momentum running out of fuel
- The RSI formula, worked by hand so you trust the number
- My 7-rule RSI divergence plan, all in one table
- Best settings for prop firm trading: RSI 14 on H1 with an H4 filter
- The confirmation filter that cut my false signals in half
- Position sizing under a 5% daily loss limit
- When divergence lies: trends, news, and flat RSI
- How divergence fits prop firm rules: drawdown, consistency, patience
- Frequently Asked Questions
What RSI divergence actually measures: momentum running out of fuel
RSI compares the size of recent up-moves against recent down-moves over 14 periods. It does not ask “did price go up or down” — it asks “how enthusiastically did it move”. When price makes a new low but gets there with smaller candles and less participation than the previous low, RSI registers a higher low. That mismatch — price pushing to a new extreme while the engine behind the move weakens — is divergence. It is the market gasping for air at the end of a marathon. There are four types, and confusing them is the first mistake:
| Type | Price makes | RSI makes | What it signals |
|---|---|---|---|
| Regular bullish | Lower low | Higher low | Selling is exhausting — possible bottom |
| Regular bearish | Higher high | Lower high | Buying is exhausting — possible top |
| Hidden bullish | Higher low | Lower low | Uptrend is healthy — buy the dip |
| Hidden bearish | Lower high | Higher high | Downtrend is healthy — sell the rally |
Regular divergence hunts reversals; hidden divergence hunts trend continuation. I trade regular divergence only, because hidden divergence is really a pullback entry in disguise — and my trend pullback strategy already covers that ground with cleaner rules. The Babypips regular divergence lesson explains the four types with the same marathon analogy I use, if you want a second pass at the concept.
The RSI formula, worked by hand so you trust the number
I compute one RSI value by hand a year, usually after a week like that March one, to remind myself the number is arithmetic, not magic:
RS = Average gain over 14 periods ÷ Average loss over 14 periods
RSI = 100 − (100 ÷ (1 + RS))
Divergence = price extreme and RSI extreme point in opposite directions
Worked: EURUSD H1 drops from 1.0960 to 1.0900, then to 1.0880. First leg: average gain 12 pips, average loss 38 pips → RS = 0.316 → RSI = 24. Second leg to 1.0880: average gain 18 pips, average loss 30 pips → RS = 0.6 → RSI = 37.5. Price made a lower low (1.0880 < 1.0900) but RSI made a higher low (37.5 > 24) — regular bullish divergence, confirmed by arithmetic.
The useful insight from the maths: RSI rises on a lower low only when the down-moves shrink relative to the up-moves inside the window. Small-bodied candles near the extreme are the visual tell — when the candles get small at a new low, the divergence is already forming before any line-drawing confirms it.
My 7-rule RSI divergence plan, all in one table
Every rule below exists because I paid for its absence. Keep them on a card next to your monitor — I do not take a divergence trade unless all seven check out:
| Rule | The rule | Why it exists |
|---|---|---|
| 1 — Location | Divergence must form at a pre-marked level: prior swing high/low, round number, or H4 supply/demand zone | A perfect divergence in the middle of nowhere reversed on me three times in that March week |
| 2 — RSI extreme | Bullish: RSI < 35 at the pivot; bearish: RSI > 65 at the pivot | Divergence forming at RSI 55 is chop, not exhaustion — the fuel was never low |
| 3 — Two pivots | Two clear price/RSI pivots, 10–40 bars apart on H1 | Adjacent-candle “divergence” is indicator noise; real exhaustion takes time to develop |
| 4 — Timeframe | Signals on H1, context on H4 — never below H1 | M15 divergence gave me four false signals a day; H1 gives me two or three a week |
| 5 — Confirmation | A 15-minute candle closes back in the reversal direction, breaking the last micro-swing | The filter that cut my false signals roughly in half (next section) |
| 6 — Risk | Stop beyond the divergence extreme; 0.5% risk per trade | The extreme is the invalidation — if price takes it out, the divergence was wrong, full stop |
| 7 — Session | London or New York session only | Asian-session divergences drift and die; the reversal needs volume to confirm |
Best settings for prop firm trading: RSI 14 on H1 with an H4 filter
The indicator settings are deliberately boring. RSI 14 is the default for a reason — every guide, every backtest, every platform agrees on it, which means the levels other traders watch are the levels price respects. What changes for a funded account is the timeframe discipline and the filter:
| Setting | My value | Why |
|---|---|---|
| RSI period | 14 | Standard — divergences at 14 match what the rest of the market sees |
| Signal timeframe | H1 | Divergences develop over real sessions; M15 is mostly noise |
| Context timeframe | H4 | H1 divergence against an H4 trend gets half size; with the H4 trend, full size |
| Pairs | EURUSD, GBPUSD, XAUUSD | Deep enough that an RSI extreme means real exhaustion, not a thin-market spike |
| News blackout | 30 minutes either side of red-folder news | News reverses momentum without divergence and reverses divergence without momentum |
| Risk | 0.5% per trade, max 2 divergence trades per day | Two full-risk losers cost 1% — one-fifth of a 5% daily limit, survivable by design |
One setting I deliberately do not touch: the 30/70 oversold/overbought lines. My Rule 2 uses 35/65 instead, slightly inside the classic lines, because a divergence that needs RSI to reach 30 on H1 often never quite gets there — the reversal starts at 33 and I would rather take the trade than admire the rule.
The confirmation filter that cut my false signals in half
This is the whole strategy, honestly. A divergence tells you momentum is fading; the confirmation tells you someone is actually stepping in. After the divergence completes on H1, I drop to M15 and wait for one candle to close back in the reversal direction, breaking the last micro-swing. For a bullish divergence: price made lower lows at 1.0900 and 1.0880 with RSI rising from 24 to 37.5 — then I need an M15 candle to close above the last micro-swing high (say 1.0895) with its close in the top half of its range. Entry at that close, stop below 1.0880 minus a 5-pip buffer. No confirmation candle, no trade — the divergence stays a warning on my chart, marked and ignored.
Why this works on a funded account: the divergence alone gives you an entry somewhere in a falling market with the stop below a low that keeps getting taken out. The confirmation candle moves your entry to a point where buyers have already shown up once. My stop distance shrank from an average of 55 pips to 38 pips after adding the filter, which at 0.5% risk means larger position sizes for the same dollars — run the max daily drawdown calculator with both stop sizes and you will see the difference in lots immediately. Here is what eight confirmed trades looked like in my journal:
| Trade | Pair / TF | Divergence | Confirm | Stop (pips) | Result |
|---|---|---|---|---|---|
| 1 | EURUSD H1 | Bullish, RSI 24→37.5 | M15 close above 1.0895 | 35 | +2R (+$500) |
| 2 | GBPUSD H1 | Bearish, RSI 76→64 | M15 close below micro low | 42 | +2R (+$500) |
| 3 | XAUUSD H1 | Bullish, RSI 28→41 | M15 close above micro high | $6.50 | −1R (−$250) |
| 4 | EURUSD H1 | Bearish, RSI 72→61 | M15 close below micro low | 38 | +2R (+$500) |
| 5 | GBPUSD H1 | Bullish, RSI 31→44 | No confirmation — skipped | — | Skipped (would have lost) |
| 6 | EURUSD H1 | Bullish, RSI 26→39 | M15 close above micro high | 40 | −1R (−$250) |
| 7 | XAUUSD H1 | Bearish, RSI 74→63 | M15 close below micro low | $7.00 | +2R (+$500) |
| 8 | EURUSD H1 | Bullish, RSI 29→42 | M15 close above micro high | 36 | +2R (+$500) |
Five winners at +2R, two losers at −1R, one skipped: +8R gross on $250 risk units, roughly +$2,000 on a $100K account across three weeks. Trade 5 is the one I am proudest of — the divergence was textbook, the confirmation never came, and the level broke the next day. The filter does not just improve entries; it manufactures the discipline to walk away.
Position sizing under a 5% daily loss limit
Divergence stops sit beyond an extreme, which makes them wider than pullback stops and occasionally awkward. The sizing has to be mechanical because the temptation is to shrink the stop to fit a “nice” lot size. Never shrink the stop — shrink the position:
Stop distance (pips) = |Entry − Divergence extreme| ÷ Pip size
Risk ($) = Account × 0.005
Lots = Risk ($) ÷ (Stop distance × Pip value per lot)
Target = Entry ± (2 × Stop distance × Pip size)
Worked: $100K account, bullish divergence, entry 1.0898 after the M15 confirmation close, extreme 1.0880, 5-pip buffer → stop 1.0875. Stop distance = 23 pips. Risk = $500. Lots = 500 ÷ (23 × $10) = 2.17 lots. Target = 1.0898 + 46 pips = 1.0944. One full stop-out costs 0.5% — ten percent of a $5,000 daily budget — so even two consecutive failures leave the day’s plan intact.
The daily-loss maths is the reason Rule 6 caps divergence trades at two per day. A divergence strategy that fails three times in a morning is not “due” — it is telling you the market is trending, which is exactly what the next section covers.
When divergence lies: trends, news, and flat RSI
Divergence has three failure modes, and each one cost me money before I named it:
| Failure mode | What happens | The tell | My response |
|---|---|---|---|
| Strong trend | Divergence prints, price pauses, then continues the trend | RSI stays pinned above 60 in an uptrend (or below 40 in a downtrend) for 20+ bars | Skip regular divergence entirely; trade hidden divergence or wait for the pullback plan |
| News shock | Divergence forms on technical exhaustion, then a headline reprices everything | Red-folder event within 30 minutes of the signal | News blackout — flat during the window, reassess after |
| Flat RSI chop | RSI oscillates 45–55 while price makes marginal new extremes | The “divergence” pivots are 5–8 RSI points apart | Rule 3 fails — pivots too close, divergence too weak to trade |
The strong-trend failure deserves emphasis because it is the expensive one. In a real trend, RSI divergence can print two or three times before price finally turns — each one a losing long into a rising market. When I see the second divergence fail in the same direction, I flip the playbook: the market is trending, so I stop hunting reversals and start hunting pullbacks, and the trend pullback calculator does the entry, stop and R-target maths for that plan. Divergence tells me when a trend is tired; the pullback tool tells me how to trade it once it keeps going anyway.
How divergence fits prop firm rules: drawdown, consistency, patience
Divergence trading is naturally prop-firm-shaped, with one sharp edge. The natural fit: entries come with a built-in invalidation (the extreme), stops are structural rather than arbitrary, and the strategy is selective by construction — two or three setups a week on H1 will never trip a consistency rule or an overtrading flag. I pair it with my personal daily stop set below the firm’s limit, so even a worst-case morning of two failed divergences costs me 1% and ends my day by rule, not by emotion.
The sharp edge: divergence is counter-trend trading, and counter-trend entries have lower win rates than with-trend ones — my log above runs 71% but that includes the skip; raw divergence without confirmation ran closer to 45% in March. That is why the 2R minimum target is non-negotiable and why every divergence trade goes in my trading journal with the RSI readings at both pivots. After fifty logged divergences you will know your own numbers, and your numbers are the only edge that counts on a funded account.
Frequently Asked Questions
Does RSI divergence work on a prop firm challenge?
It can, but only with the confirmation filter and strict location rules. Raw divergence on low timeframes fails often enough to threaten a daily loss limit — my March week proved that at −$620. The 7-rule version above, with the M15 confirmation candle and the 0.5% risk cap, turned the same indicator into a +8R three weeks in my journal. The indicator did not change; the trade selection did.
What is the difference between regular and hidden divergence?
Regular divergence (price lower low + RSI higher low) signals a possible reversal — momentum is exhausting. Hidden divergence (price higher low + RSI lower low) signals trend continuation — the pullback is healthy. I trade regular divergence for reversals and use my trend pullback plan for the hidden-divergence situations, since they are really the same trade with different names.
Which timeframe is best for RSI divergence on a funded account?
H1 for signals with H4 context. M15 divergences form constantly and fail constantly — four false signals a day will eat a challenge account. H1 gives two or three quality setups a week, each with a structural stop and a 2R target. Never trade divergence below H1 on a prop firm account; the noise-to-signal ratio is not survivable.
How do I avoid false RSI divergence signals?
Three filters do most of the work: require the divergence at a pre-marked level (Rule 1), require RSI in a genuine extreme below 35 or above 65 (Rule 2), and require the M15 confirmation candle closing back in the reversal direction (Rule 5). In my log, the confirmation filter alone turned a losing approach into a winning one — and the one skipped trade would have been a loser.
Can I combine RSI divergence with other strategies?
Yes — divergence is a timing tool, not a standalone system. My most reliable combination is divergence at a supply/demand zone, confirmed by the M15 candle, sized by the same 0.5% rule. When divergence fails twice in the same direction, I treat it as trend evidence and switch to the pullback plan rather than forcing a third reversal attempt.
What stop loss should I use for a divergence trade?
Beyond the divergence extreme, plus a small buffer — 5 pips on forex majors, $5–$8 on gold. The extreme is the invalidation: if price takes it out, the divergence thesis is dead and you want to be out, not hoping. Size the position from the stop distance, never the other way around.
Risk disclaimer: Trading on a funded or challenge account involves real risk of loss, including the loss of your evaluation fee. Divergence signals fail regularly — backtest any plan on demo for at least 30 trades before risking a challenge, and never risk money you cannot afford to lose.


