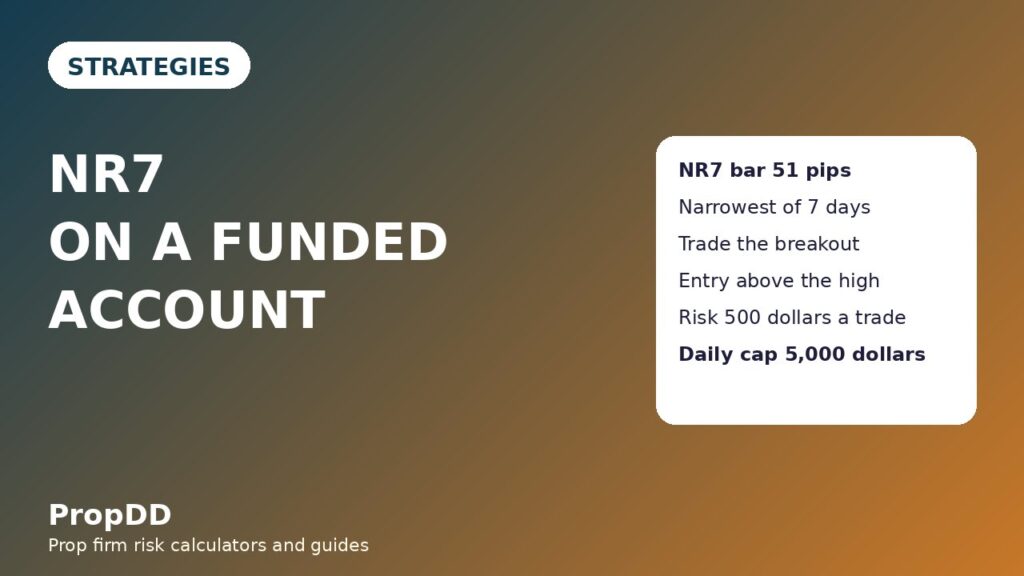
I nearly deleted the trade that taught me about NR7, because on the screen it looked like nothing at all. It was a Tuesday evening, I was scanning EURUSD on the daily chart, and the candle in front of me was the smallest, dullest bar of the week. No wick drama, no news spike, no story. My first instinct was to move on and look for something louder. Then I measured it. That quiet bar had a high-to-low range of 51 pips, and it was narrower than every one of the six days before it. The next morning price closed above its high, I bought the retest with a stop below its low, and the trade ran for 1.5R before lunch. The lesson stuck because it inverted everything I believed about setups: the best breakout signal I had found on a funded account was not a loud move. It was a week of the market going quiet.
In this article
- What an NR7 bar actually is
- The six rules that turn a squeeze into a trade
- Session and time filter
- A worked trade, sized under the daily loss limit
- Position sizing across different stop distances
- The twelve-trade test: filtered versus unfiltered
- When the strategy fails
- How NR7 fits prop firm rules
- Daily routine for NR7 trading
- Frequently asked questions
NR7 stands for Narrow Range 7. It is a volatility-compression pattern: today’s bar has the smallest high-to-low range of the last seven bars. The idea, popularised by Toby Crabel and documented in detail by Thomas Bulkowski, is that markets alternate between contraction and expansion. A week of shrinking ranges means buyers and sellers have reached a temporary balance, and the next imbalance tends to arrive as a sharp move. NR7 does not predict the direction of that move. It predicts that a move is coming, and it hands you two precise lines — the NR7 high and the NR7 low — to trade the breakout from. For a funded trader, that precision is the whole point: your entry, your stop and your position size are all fixed before you risk a cent.
What an NR7 bar actually is
An NR7 bar is defined by one comparison, and only one. Take the high-to-low range of today’s bar and compare it with the ranges of the previous six bars. If today’s range is the smallest of all seven, you have an NR7. It works on any timeframe, but I trade it on the daily chart, where one bar equals one day and the pattern genuinely reflects a week of compression. On intraday charts the same logic applies to seven bars of whatever timeframe you are watching, but the noise level rises fast, and noise is what kills funded accounts.
Two misunderstandings cost traders money here. First, NR7 is not an inside bar. An inside bar sits entirely within the previous bar’s range; an NR7 bar only needs the smallest range, and it can poke above the previous high or below the previous low. The two patterns sometimes overlap, and when they do the signal is stronger, but they are not the same thing. Second, NR7 is not a reversal pattern. It is a compression pattern. The breakout can go either way, and the traders who lose money on it are usually the ones who guessed the direction instead of waiting for the close that confirms it. My inside bar strategy guide covers the inside-bar cousin in full, and the two complement each other well on a watchlist.
The six rules that turn a squeeze into a trade
I trade NR7 with six rules, and I do not bend them, because every bend I have ever allowed has cost me a chunk of daily drawdown. Rule one: the NR7 bar must be the narrowest of seven daily bars, measured high to low, no exceptions and no eyeballing. Rule two: I only trade breakouts in the direction of the trend on the timeframe above — above a rising 50-day moving average I take longs only, below it I take shorts only. Rule three: the breakout must be confirmed by a daily close beyond the NR7 high or low, not an intraday poke. Rule four: entry is at the next day’s open, or on a retest of the broken NR7 level if price comes back within two days. Rule five: the stop goes beyond the opposite side of the NR7 bar, plus a small buffer, so a normal wobble cannot take me out. Rule six: if price has not broken out within five trading days of the NR7 bar, I abandon the setup and move on. Bulkowski’s original guidance allowed seven calendar days; on a five-day trading week, five trading days is the cleaner equivalent, and it stops me babysitting dead setups.
| Check | The rule | Why it exists |
|---|---|---|
| 1. Narrowest of seven | Today’s high-to-low range is smaller than each of the previous six days | Confirms genuine compression, not just a quiet day |
| 2. Trend filter | Trade only with the 50-day moving average direction | Stops counter-trend breakouts, which fail most often |
| 3. Close confirmation | Daily close beyond the NR7 high or low | Filters intraday fakeouts that reverse by the close |
| 4. Entry plan | Next open, or retest of the broken level within two days | Keeps entries mechanical instead of emotional |
| 5. Stop placement | Beyond the opposite NR7 extreme, plus a 5-pip buffer | Gives the trade room without risking the daily limit |
| 6. Expiry | No breakout within five trading days means no trade | Frees attention for live setups instead of dead ones |
Session and time filter
NR7 is a daily-chart setup, so the session filter works differently from an intraday strategy. I do the scanning in the evening, after the New York close, when the daily bar is final and the range comparison is honest. I place no orders during the Asian session on breakout day, because thin liquidity can print a false close beyond the level and then reverse before London opens. The entry itself goes on at the next day’s open, and I manage the trade during the London and New York sessions, when spreads are tightest and the breakout either extends or fails quickly. I never take an NR7 breakout into a red-folder news event: if high-impact news for the pair lands within 24 hours of the breakout close, I skip the trade entirely. A news spike can gap straight through a stop, and a funded account has no patience for that kind of loss. My trend pullback strategy uses the same evening-scan habit, and it is the routine that keeps both strategies consistent.
A worked trade, sized under the daily loss limit
Here is the trade from the story, with every number shown. The account is a $100,000 funded account with a 5% daily loss limit, which is $5,000. I risk 0.5% per trade, which is $500 — one tenth of the daily limit, so even a full losing day of several trades stays inside the cap. The seven daily EURUSD ranges leading into the setup were 92, 85, 78, 71, 64, 58 and finally 51 pips. The 51-pip bar was the NR7 bar, with a high of 1.0950 and a low of 1.0899. Price was above a rising 50-day moving average, so I was looking for a long breakout only.
Price closed above 1.0950 the next day. I entered at the following open, 1.0955. My stop went below the NR7 low minus a 5-pip buffer: 1.0899 minus 0.0005 gives 1.0894. The stop distance is 1.0955 minus 1.0894, which is 0.0061, or 61 pips. On EURUSD one standard lot is worth $10 per pip, so the position size is $500 divided by (61 × $10), which is 0.82 lots. My first target was 1R above entry, 1.1016, and my second target was 2R, 1.1077. I took half the position off at 1R and let the rest run to 2R, which banked $250 on the first half and $500 on the second half — $750 in total, or 1.5R on the full position.
| Step | Level / value | Working |
|---|---|---|
| NR7 bar range | 51 pips (narrowest of 92, 85, 78, 71, 64, 58, 51) | High 1.0950, low 1.0899 |
| Breakout confirmation | Daily close above 1.0950 | Long only — price above rising 50-day average |
| Entry | 1.0955 (next open) | — |
| Stop | 1.0894 (NR7 low minus 5-pip buffer) | Stop distance 61 pips |
| Position size | 0.82 lots | $500 ÷ (61 × $10) = 0.82 |
| Target 1 (half off) | 1.1016 (+$250) | 1R = 61 pips |
| Target 2 (rest off) | 1.1077 (+$500) | 2R = 122 pips |
| Total result | +$750 = 1.5R | $250 + $500, on $500 risked |
| Formula | Working for this trade |
|---|---|
| Daily loss limit = account × 5% | $100,000 × 5% = $5,000 |
| Risk per trade = account × 0.5% | $100,000 × 0.5% = $500 |
| Stop distance = entry − stop | 1.0955 − 1.0894 = 0.0061 = 61 pips |
| Lots = risk ÷ (stop pips × pip value) | $500 ÷ (61 × $10) = 0.82 lots |
| 1R = stop distance in dollars | 61 pips × $10 × 0.82 = $500 |
If you want to check your own numbers before placing the trade, the max daily drawdown calculator on this site does the same daily-limit maths in seconds, and I run every NR7 setup through it as a final check.
Position sizing across different stop distances
The stop distance changes with every NR7 bar, because every bar has a different range. The risk stays fixed at $500, so the position size must move instead. Traders who keep the same lot size on every setup are quietly changing their risk on every trade, and on a funded account that is how a normal losing week turns into a breach. The grid below shows the sizing for the same $500 risk at five common stop distances, all on EURUSD at $10 per pip.
| Stop distance | Calculation | Position size |
|---|---|---|
| 40 pips | $500 ÷ (40 × $10) | 1.25 lots |
| 50 pips | $500 ÷ (50 × $10) | 1.00 lot |
| 61 pips (worked trade) | $500 ÷ (61 × $10) | 0.82 lots |
| 70 pips | $500 ÷ (70 × $10) | 0.71 lots |
| 80 pips | $500 ÷ (80 × $10) | 0.62 lots |
Notice how the maths protects the daily limit: even the widest stop in the grid risks exactly $500, which is 10% of the $5,000 daily allowance.
The twelve-trade test: filtered versus unfiltered
I backtested the six rules on twelve NR7 setups from my journal, then ran the same twelve without the filters — trading every NR7 bar in either direction, on intraday pokes instead of daily closes, with no expiry rule. The difference is the reason this article exists. The filtered version won seven trades and lost five. The winners averaged 1.71R, giving 12R of gains against 5R of losses, a net of +7R, which is +$3,500 at $500 per trade. The unfiltered version won four and lost eight, with winners averaging 1.5R for 6R against 8R of losses, a net of −2R, or −$1,000. Same pattern, same market, same twelve setups — the only difference was discipline. The best single filtered win was $1,000, a 2R runner, and no filtered losing day came close to the daily limit.
| Version | Wins / losses | Winner maths | Net result |
|---|---|---|---|
| Filtered (six rules) | 7 wins / 5 losses | 7 × 1.71R = 12R gained, 5 × 1R = 5R lost | +7R = +$3,500 |
| Unfiltered (every NR7) | 4 wins / 8 losses | 4 × 1.5R = 6R gained, 8 × 1R = 8R lost | −2R = −$1,000 |
When the strategy fails
NR7 fails in four familiar ways, and naming them in advance is what keeps them small. The first is the false breakout: price closes beyond the level, then falls straight back inside the range the next day. The daily-close rule filters most of these, but not all, which is why the stop sits beyond the opposite extreme rather than just beyond the level. The second is trading against the trend: a downside breakout below a rising 50-day average looks tempting because the move is fast, but my journal says those trades lose more often than they win, so the trend filter exists to remove the temptation. The third is chasing a stale setup: an NR7 bar from nine days ago that never broke out is not a setup any more, it is history, and the five-day expiry rule is there to say so. The fourth is news gaps: a breakout that coincides with a central-bank announcement can gap through the stop before you can react, which is why red-folder news within 24 hours is an automatic skip. The gap and go strategy guide is the mirror image of this problem — it trades gaps deliberately, with its own rules — and reading the two together shows why the same gap can be a setup in one plan and a skip in another.
How NR7 fits prop firm rules
NR7 fits funded accounts unusually well because its risk is known before entry and its trade frequency is naturally low. A daily-chart setup on a handful of pairs produces roughly one or two valid breakouts a week, which keeps you far from overtrading and far from the consistency-rule trap of one giant winning day. The fixed 0.5% risk keeps every loss at a tenth of the daily limit, and the partial-profit rule at 1R means most winners bank something even when the runner fails. The one rule to watch is the consistency rule itself: because NR7 runners can occasionally produce a 2R day, I cap myself at two NR7 trades per day and never add to a winning trade, so no single day can dominate the payout calculation. For a broader view of how the daily loss limit shapes every decision here, the consistency rule explained post walks through the same numbers from the firm’s side of the desk.
Daily routine for NR7 trading
| When | What I do | Time needed |
|---|---|---|
| Evening, after New York close | Scan daily charts; measure today’s range against the previous six; flag new NR7 bars | 15 minutes |
| Same evening | Check trend filter, news calendar and the five-day expiry on every flagged setup | 10 minutes |
| Breakout morning | Confirm the daily close beyond the level; place entry and stop orders | 5 minutes |
| During London / New York | Manage the trade: half off at 1R, stop to breakeven, runner to 2R | Glances only |
| End of day | Journal the result, including whether any rule was bent | 5 minutes |
The whole routine takes under half an hour a day, and most of that is the evening scan. That is deliberate: a strategy that needs you glued to the screen all day will eventually make you take a trade you should have skipped. For the pattern’s original documentation, see Thomas Bulkowski’s NR7 guidelines.
Frequently asked questions
Does NR7 work on intraday charts?
Yes, the definition is identical — the narrowest range of the last seven bars — but the failure rate rises as the timeframe falls, because intraday noise produces more false closes. If you trade it intraday, keep the trend filter and the close-confirmation rule, and expect to filter harder, not less.
How is NR7 different from an inside bar?
An inside bar must sit entirely inside the previous bar’s range. An NR7 bar only needs the smallest range of seven bars, and it may extend beyond the previous bar. The two overlap sometimes, and that overlap is a stronger signal, but they are separate patterns with separate rules.
What happens if price breaks out both ways?
Trade the first confirmed daily close only. If price closes above the high, the long is the trade; a later downside break of the same bar is not a second setup, it is a failed first trade, and chasing it doubles your exposure to one indecisive week.
Can I trade NR7 on gold or indices?
Yes, with one adjustment: use the pip value and stop distance for that instrument when sizing, because gold and indices move in very different increments from EURUSD. The $500-risk formula is unchanged; only the inputs change.
Why five trading days for expiry instead of seven calendar days?
Bulkowski’s original guidance was seven calendar days, which on a five-day trading week is five trading days plus a weekend. Five trading days is the same window expressed in market days, and it stops a setup lingering through a weekend it never deserved.
Is one NR7 trade a week enough to pass a challenge?
On its own, probably not quickly — and that is fine. NR7 is a low-frequency, high-discipline setup that protects capital while other strategies do the heavy lifting. Pair it with one or two complementary strategies, keep the risk fixed, and let the challenge maths compound instead of forcing trades that are not there.
Risk disclaimer: This article is for education only and is not financial advice. Trading leveraged products carries a high risk of loss, and past pattern performance does not guarantee future results. Never risk money you cannot afford to lose, and always check your prop firm’s current rules before trading a new strategy.


