I found Ichimoku the way most traders find religion: in the middle of a meltdown. It was my third challenge attempt, I was running RSI, Stochastic, MACD and Bollinger Bands on the same chart — four indicators, four opinions — and the chart looked like a plate of neon spaghetti. On a EURUSD Tuesday in April, RSI said oversold and begged me to buy, MACD was flat-lining bearish, the Stochastic had been buried under 20 for nine hours, and the Bollinger lower band was “holding”. I bought. Price slid another 40 pips, the daily loss limit went from comfortable to two trades away, and I spent the rest of the week trading scared. That week I learned something that no indicator manual had ever said plainly: the danger on a prop firm account is not the wrong indicator — it is too many indicators disagreeing while your drawdown allowance bleeds out.
In this article
- The Neon-Spaghetti Problem Ichimoku Solved for Me
- What the Ichimoku Cloud Actually Measures
- The Five Formulas, Written Out Properly
- My Prop-Firm Settings: What I Changed From 9/26/52 and Why
- How I Read the Three Signals on a Challenge Account
- I Tested It: A Kumo Breakout Trade With Real Drawdown Maths
- The Mistakes That Cost Me the Most Drawdown
- How Ichimoku Fits Prop Firm Rules
- Frequently Asked Questions
So I did something drastic. I deleted all four indicators and put a single one on the chart: the Ichimoku Cloud. Not because it is magic, but because it is a complete ichimoku cloud for prop firm traders toolkit in one overlay — trend direction, momentum, support and resistance, and even a forward projection of where the market’s support and resistance will be tomorrow. One indicator, one opinion, one decision at a time. Twelve months later it is still the only indicator on my charts, and this guide is everything I wish someone had told me at the start: what the cloud actually measures, the five formulas, the settings I changed for prop-firm trading, exactly how I read its signals under a daily loss limit, a worked Kumo breakout trade with real position-sizing maths, and the mistakes that cost me the most drawdown.
The Neon-Spaghetti Problem Ichimoku Solved for Me
Goichi Hosoda, a Japanese journalist, spent decades building Ichimoku Kinko Hyo — roughly “one-glance equilibrium chart” — and published it in the late 1960s. He designed it for rice and equity markets, but the design logic is what matters for us: instead of layering four indicators that each answer one question, Ichimoku answers five questions at once. Where is the trend? Is it strong or weak? Where is support and resistance right now? Where will it be next week? Is this entry early or late?
For a prop firm trader, the real benefit is behavioural. A challenge account rewards boring, rule-based repetition — the same setup, the same risk, the same session, day after day. I wrote about that discipline problem at length in my guide to minimum trading days rules, and Ichimoku slots straight into it: one indicator means one decision framework, which means fewer trades. My average trades-per-day fell from 4.7 to 1.8 in the first month after the switch, and my overtrading costs — commissions, spreads and impulse entries — dropped with it. The cloud did not make me smarter. It made me quieter.
What the Ichimoku Cloud Actually Measures
The cloud looks intimidating because it plots five lines at once, but each one does a single job. Think of them as a layered answer to “should I be long, short, or flat?” Here is the cast, in the order I actually check them:
| Line | Nickname | What it tells you |
|---|---|---|
| Kijun-sen (blue) | Base line | The medium-term equilibrium price. Price above it leans bullish, below it leans bearish. My default stop-loss anchor. |
| Tenkan-sen (red) | Conversion line | The short-term momentum line. When it crosses the Kijun, momentum has officially shifted. |
| Senkou Span A and B (the shaded zone) | The cloud (Kumo) | Forward-projected support and resistance. Price above the cloud = trend up; below = trend down; inside = chop, no trade. |
| Chikou Span (green) | Lagging line | Today’s close plotted 26 periods back. It confirms whether the trend has clear air behind it or price congestion ahead. |
The part beginners miss is the cloud’s forward projection. Senkou Span A and B are plotted 26 periods into the future, so you can literally see where support and resistance will sit tomorrow and next week. No other common indicator gives you that. On a challenge account with a profit target to reach in limited days, knowing that tomorrow’s cloud sits 60 pips below today’s price — a cushion for a long — changes how aggressively you are willing to hold a winner.
The Five Formulas, Written Out Properly
Ichimoku is built entirely from one simple calculation: the midpoint of the highest high and the lowest low over a lookback period. No exponential smoothing, no standard deviations. Here are the five lines in formula form, where HH and LL are the highest high and lowest low over the stated number of periods:
Tenkan-sen (Conversion line) = (9-period HH + 9-period LL) / 2
Kijun-sen (Base line) = (26-period HH + 26-period LL) / 2
Senkou Span A = (Tenkan-sen + Kijun-sen) / 2, plotted 26 periods ahead
Senkou Span B = (52-period HH + 52-period LL) / 2, plotted 26 periods ahead
Chikou Span (Lagging line) = today’s close, plotted 26 periods back
Two consequences fall straight out of the maths. First, because every line is a midpoint of extremes rather than an average of closes, the lines sit flatter and react more deliberately than moving averages — the Kijun often acts as a magnet where price pauses, which is why I use it as my stop anchor. Second, because Senkou Span B uses a 52-period lookback, the cloud reflects roughly two months of structure on a daily chart: it does not redraw nervously every few candles. That stability is the point. On a funded account, an indicator that changes its mind less often is worth more than a faster one, because every reversal costs you spread, commission and discipline. If any of these lines are still new to you, the BabyPips primer on Ichimoku Kinko Hyo is a clean beginner walkthrough of the same five lines before you apply the prop-firm settings below.
My Prop-Firm Settings: What I Changed From 9/26/52 and Why
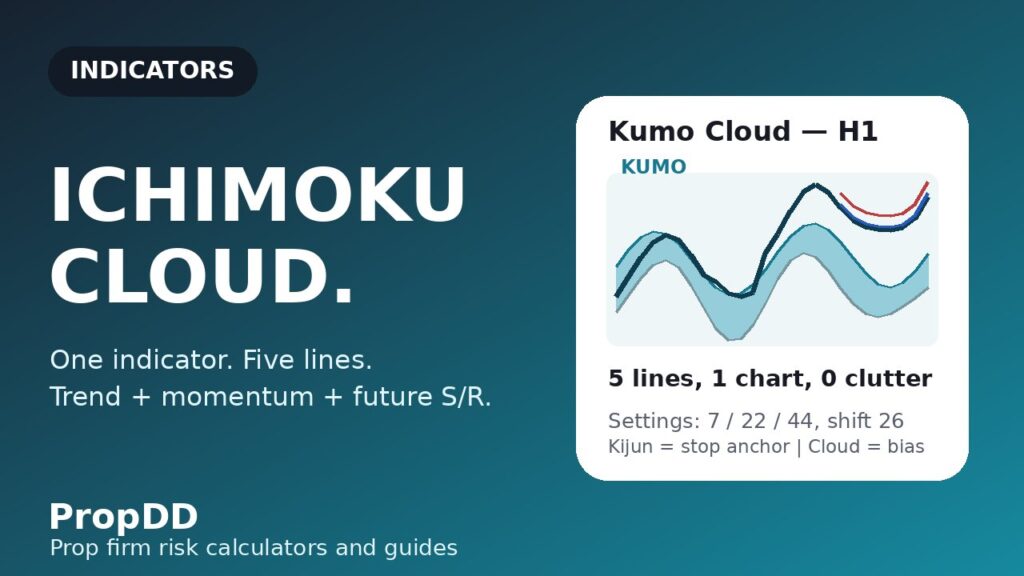
The classic settings — Tenkan 9, Kijun 26, Senkou B 52 — were built for a six-day Japanese trading week in the 1960s. For my intraday challenge trading (mostly H1 and M15 on EURUSD and GBPUSD), I shortened everything, because the original periods made the Kijun and cloud react too slowly for a 5% daily loss limit that punishes oversized stops. Here is my current setup versus the defaults:
| Parameter | Classic (daily swing) | My intraday prop setting | Why I changed it |
|---|---|---|---|
| Tenkan-sen | 9 | 7 | Faster momentum read on M15/H1; catches the turn one or two candles earlier |
| Kijun-sen | 26 | 22 | Tighter stop anchor — a 26-period Kijun on H1 sits too far from entry and wastes drawdown room |
| Senkou Span B | 52 | 44 | Cloud still stable, but reacts within a trading week instead of two months |
| Displacement | 26 | 26 | Kept as-is — the forward projection is the whole point |
| Timeframe | Daily | H1 entries, D1 cloud bias | Daily cloud sets direction, hourly cloud gives entries — never fight the daily cloud |
A warning from experience: do not go faster than 7/22/44. I tested 5/15/30 for a month and the Tenkan started whipsawing on M15, firing cross signals inside the cloud that my rules had to reject anyway. Faster settings did not give me more trades — they gave me more rejected trades, which is the same number of winners with more screen time. The settings above are the fastest I would run on a real evaluation.
How I Read the Three Signals on a Challenge Account
Ichimoku generates dozens of micro-signals, but on a challenge account I only take three, ranked by how strictly I size them. Everything else is noise until proven otherwise:
| Signal | Setup | Confirmation | My risk size |
|---|---|---|---|
| Strong: TK cross outside the cloud | Tenkan crosses Kijun above the cloud (long) or below it (short) | Chikou Span is clear of price — no congestion in the way | Full 0.5% risk |
| Medium: Kumo breakout pullback | Price closes through the cloud, pulls back to its edge, holds | Cloud ahead is thick (strong S/R) and Chikou is in open space | 0.5% risk, but I skip if the cloud ahead is thin |
| Weak: TK cross inside the cloud | Cross happens while price is inside the Kumo | Ignored — price inside the cloud is chop by definition | 0% — I do not trade it |
The Chikou Span confirmation is the step most traders skip and the one that saves the most money. Before every entry I glance 26 periods back: if the Chikou line is tangled in old price candles, the breakout is running into congestion and will likely stall. If it is floating in clear space, the path is open. This one check filtered out roughly a third of my Kumo breakouts last quarter — and the filtered ones, on replay, were the trades that would have stopped out at the Kijun most often. The lagging line is the closest thing Ichimoku has to a drawdown-protection feature. Use it.
I Tested It: A Kumo Breakout Trade With Real Drawdown Maths
Here is a real setup from my journal, EURUSD on the H1 chart, numbers rounded to keep the maths clean. A $50,000 challenge account with a 5% daily loss limit ($2,500) and a 10% overall limit. My personal rule: risk 0.5% per trade ($250), stop at the Kijun, target twice the stop distance.
| Input | Value | Output | Value |
|---|---|---|---|
| Account size | $50,000 | Risk per trade (0.5%) | $250 |
| Entry: H1 close above cloud | 1.0852 | Stop: below Kijun | 1.0812 (40 pips) |
| Cloud thickness ahead | ~35 pips (thick) | Position size = $250 / 40 pips | 0.62 lots |
| Target: 2R | 1.0932 (+80 pips) | Trade outcome | +$496 (closed at 1.0930) |
| Daily loss limit | $2,500 | Drawdown used if stopped | 10% of the daily allowance |
The key insight for prop trading: the Kijun-based stop gave me a 40-pip stop, which at 0.5% risk allowed 0.62 lots — a trade big enough to matter for the profit target, small enough that a full stop costs only one-tenth of the day’s drawdown budget. Compare that with my old RSI system, where I placed “feels right” 25-pip stops and got wicked out constantly: I was risking the same dollars but dying from noise instead of being wrong on direction. If you want to stress-test how far floating losses can run against you before a stop like this threatens your daily limit, run the numbers through our floating loss drawdown calculator — it is the check I run before sizing any Kumo breakout.
The Mistakes That Cost Me the Most Drawdown
I paid tuition to learn every one of these. They are ranked by how much of my drawdown allowance each one burned:
| Line | Nickname | What it tells you |
|---|---|---|
| Trading TK crosses inside the cloud | Three stopped trades in one chop week, -1.5% total | Price inside the Kumo = flat. No exceptions, no “but the cross looked clean”. |
| Ignoring the Chikou Span | Breakouts into congestion, -0.9% across two trades | Chikou must be in clear space 26 periods back, or the signal is demoted to a skip. |
| Entering thin-cloud breakouts | Cloud broke, then price sliced straight back through it: -0.5% | Cloud ahead must be thick enough to act as real S/R; a thin cloud is a warning, not a green light. |
| Sizing up “strong” signals | 2x size on a “perfect” setup that failed: -0.5% in one trade | Signal strength changes my selectivity, never my size. 0.5% is 0.5%. |
| Trading Kumo breakouts into red news | NFP spike through the stop before the trend resumed: -0.5% | Flat 30 minutes either side of high-impact news — the cloud cannot price in a surprise. |
The fourth row is the one I want to underline, because it is the most expensive lesson in this whole article. A “strong” Ichimoku signal is not a licence to risk more — it is a licence to be more selective. I have a full breakdown of why position sizing is the real account-killer in my ATR position-sizing guide; the Kijun anchor gives you the stop, but only the sizing maths keeps you funded.
How Ichimoku Fits Prop Firm Rules
Here is where Ichimoku earns its keep over a four-indicator stack, rule by rule. First, the daily loss limit: because the Kijun gives every trade a built-in, objective stop distance before you enter, you can size every trade to the same 0.5% and know exactly how many consecutive losers the day can absorb — ten full stops before the 5% limit even on a bad day. Second, the consistency rule: one indicator means one signal family, which produces naturally consistent trade profiles instead of the erratic mix you get from stacking oscillators and trend tools. Third, the news rule: Ichimoku is a trend system and trends die in news spikes, so a hard 30-minutes-either-side news blackout fits it perfectly — the cloud is honest about this, because thin pre-news clouds visually tell you conditions are untradeable.
Finally, the trailing-drawdown nuance. On trailing-drawdown firms, every equity peak lifts your loss floor, so deep pullbacks against an open winner can breach you even on a winning trade. Ichimoku’s projected cloud helps here in a way nothing else in my toolbox does: the cloud ahead shows you where price should hold, so you can trail your stop under the Kijun or the cloud edge instead of giving back open profit blindly. It turns “hold your winners” from a platitude into a visible line on the chart.
Frequently Asked Questions
Is the Ichimoku Cloud good for prop firm challenges?
It is one of the better-suited indicators for challenges because it is a complete system in one overlay — trend, momentum, support/resistance and forward-projected levels — which cuts the overtrading that kills most challenges. The Kijun line gives you an objective stop anchor for consistent position sizing, which is what drawdown rules actually test.
What are the best Ichimoku settings for prop firm trading?
For intraday challenge trading I use 7/22/44 instead of the classic 9/26/52, keeping the 26-period displacement. The shorter lookbacks react within a trading week and produce tighter Kijun-based stops that fit a 5% daily loss limit. Do not go faster — below 7/22/44 the Tenkan starts whipsawing and generates rejected signals rather than real trades.
Can I use Ichimoku alone, or do I need other indicators?
You can use it alone — that is its design purpose. I run no other indicators on my challenge charts. The cloud itself contains a trend filter (price vs cloud), a momentum signal (TK cross) and a confirmation tool (Chikou Span), which is the same three-layer structure other traders build with three separate indicators.
Why do most traders fail with the Ichimoku Cloud?
Three reasons: they trade TK crosses while price is inside the cloud (chop by definition), they ignore the Chikou Span and buy breakouts into old congestion, and they size up on “perfect” setups. The indicator is honest — the rules in this guide are the difference between the indicator failing and the trader failing.
Does Ichimoku work on lower timeframes like M15?
Yes, with the 7/22/44 settings, but I use M15 only for entries while the H1 and daily clouds set the bias. Never take an M15 signal against the daily cloud. Lower timeframes also demand a strict news blackout, because a 15-minute cloud cannot absorb an NFP spike.
How is the Ichimoku Cloud different from Bollinger Bands or moving averages?
Bollinger Bands and moving averages describe the past; the Ichimoku cloud projects support and resistance 26 periods into the future. The midpoint-of-extremes construction also makes its lines sit flatter and more deliberate than exponential moving averages, so it changes its mind less often — a genuine advantage when every reversal costs you spread and discipline.
Risk disclaimer: trading on a prop firm challenge involves the risk of losing the evaluation fee and, on funded accounts, breaching drawdown limits. This article shares my personal experience and is not financial advice. Always test any indicator and settings on a demo account before risking a real evaluation.



