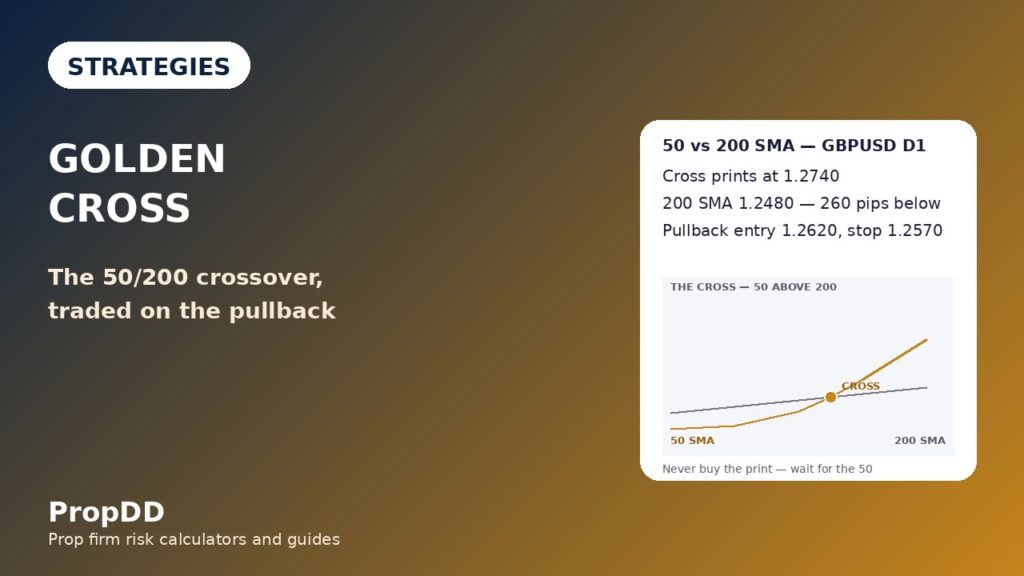
On a Thursday in late September the golden cross printed on my GBPUSD daily chart: the 50-day moving average crossed above the 200-day moving average for the first time in four months. I bought the print at 1.2740 within the hour. Price pulled back 120 pips over the next three days, my nerve broke at 1.2640, and I closed for minus one hundred and ninety dollars. Then price turned, climbed to 1.2920, and ran one hundred and eighty pips above my entry without me. The cross was right and the entry was wrong. That is the whole of this article: a golden cross is a regime change, not a buy button, and on a funded account the difference between the two is the difference between a funded trader and a failed challenge.
In this article
- What a golden cross actually is
- The one formula you need
- My six golden cross rules
- The worked trade: the pullback entry with real numbers
- I tested it: ten golden crosses
- Golden cross vs death cross — and vs my EMA guide
- When the golden cross fails
- My golden cross routine and how it fits prop firm rules
- Frequently asked questions
I trade a one hundred thousand dollar account with a five thousand dollar daily loss limit and a ten percent maximum drawdown, risking five hundred dollars per trade. Every number here comes from that account and from the ten golden crosses I logged after September. The strategy has six rules, one entry, and one sizing grid.
What a golden cross actually is
A golden cross happens when the 50-period simple moving average crosses above the 200-period simple moving average on the daily chart. It is the market’s slowest way of saying the trend has changed: the average price of the last fifty days has finally risen above the average price of the last two hundred days.
The cross unfolds in three phases. Phase one is accumulation: the 50 flattens, price stops making lower lows, and the two averages squeeze together near the bottom. Phase two is the crossover event itself — the print. Phase three is expansion: price holds above the rising 50, makes higher highs, and the gap between the two averages widens. Most traders only ever trade phase two, which is the one phase with no edge in it. The money is made in phase three, after the pullback, and that is where my entry lives.
Two things the cross is not. It is not a timing signal: by the time the slow averages cross, the move is already weeks old. And it is not a guarantee: in a range, the 50 and the 200 cross each other repeatedly and every cross is a whipsaw. What it is, is a regime filter with a date on it — from the day the cross prints, I am only looking for longs on that pair, and I am only entering them on a pullback.
The one formula you need
You never calculate a moving average by hand, but you need the formula, because it explains the lag — and the lag explains every golden cross loss I have taken. A simple moving average is the average of the last N closes:
| Formula | What it means |
|---|---|
| SMA = (Close1 + Close2 + … + CloseN) / N | Every close in the window counts equally; old closes only leave the average when they age out |
| Five closes: 1.0800, 1.0820, 1.0790, 1.0840, 1.0860 — sum 5.4110 | 5-day SMA = 5.4110 / 5 = 1.0822 |
| At my September print: price 1.2740, 200 SMA 1.2480 — 260 pips apart, 2.08% above the average | A stop below the 200 SMA needed 260 pips: $500 / 260 pips / $10 per pip = 0.19 lots |
That last row is the lag trap in numbers. When the cross printed, price was already two hundred and sixty pips above the 200 average — two point zero eight percent. The textbook stop, below the 200 average, was so wide it shrank my size to zero point one nine lots, and the textbook entry, the print itself, was the worst price of the whole move. The Proptary golden cross guide makes the same point: buying the exact candle where a cross prints leaves you holding through the deep pullback that follows, and on a funded account a deep pullback is a daily-limit event.
My six golden cross rules
If any rule fails, there is no trade — the cross is a filter stack, and filters are allowed to say no.
| Rule | The rule | Why it exists |
|---|---|---|
| 1. Daily chart only | The cross must print on D1; H4 is only for the pullback shape | Intraday crosses whipsaw; the D1 cross is the regime change |
| 2. The 200 must be rising | The 200 SMA must have risen at least 20 pips over the last 10 days | A flat 200 means a range, and range crosses are all losers |
| 3. Close, not candle | The cross counts only at the daily close, 22:00 PKT | A mid-day cross can un-print by the close and trap you |
| 4. Pullback entry only | Enter only on the pullback to the rising 50 SMA, on a bullish resumption candle | The pullback is where the stop is small and the size is real |
| 5. Stop beyond the pullback low | Stop below the pullback low, 30 to 80 pips; wider than 80 pips means skip the trade | The stop must fit the sizing grid — a 260-pip stop is not a trade |
| 6. News and Friday filter | No entries 30 minutes either side of red-folder news; no new entries after 18:00 PKT on Friday | News spikes print fake crosses; Friday entries carry weekend gap risk |
Targets are fixed: TP1 at 1R, where I take half off, and TP2 at 2R, where I take the rest. One active golden-cross trade at a time — a second cross on another pair waits until the first trade is closed or at breakeven. Entries happen in the London session, 13:30 to 16:00 PKT, or the New York session, 18:30 to 21:00 PKT, never in the Asian session, when spreads on GBPUSD widen and the pullback candle means nothing. The same pullback-entry logic sits at the heart of my trend pullback strategy — the golden cross is the daily-chart version of the same idea, with the cross itself as the trend confirmation.
The worked trade: the pullback entry with real numbers
Here is the September cross traded the right way. The cross printed with price at 1.2740 and the 200 SMA at 1.2480. I did nothing. Three days later price pulled back to the rising 50 SMA at 1.2620 and printed a bullish resumption candle. Entry at 1.2620, stop below the pullback low at 1.2570 — fifty pips. TP1 at 1.2670, fifty pips, 1R, half off. TP2 at 1.2720, one hundred pips, 2R, the rest off. Size: five hundred dollars divided by fifty pips divided by ten dollars per pip per lot equals one point zero zero lots.
| Trade input | Value | Drawdown check |
|---|---|---|
| Account / firm daily limit | $100,000 / 5% = $5,000 | Personal stop $2,500 = half the firm limit |
| Entry / stop / targets | 1.2620 / 1.2570 / TP1 1.2670 / TP2 1.2720 | 50-pip stop, 1R and 2R targets — stop beyond the pullback low |
| Position size | 1.00 lot | $500 / 50 pips / $10 per pip — checked in the max daily drawdown calculator |
| Outcome | TP1 +$250 (0.50 lot × 50 pips × $10), TP2 +$500 (0.50 lot × 100 pips × $10) | Total +$750 = 1.5R on $500 risk; worst case −$500 = 10% of the daily limit |
The sizing grid is what makes the pullback entry work and the print entry fail. Risk is always five hundred dollars; the stop distance decides the size, always rounded down.
| Stop distance | Lots for $500 risk | What it means |
|---|---|---|
| 30 pips | 1.66 lots | Tight pullback stop — full size, the best golden cross trades look like this |
| 50 pips | 1.00 lot | The worked trade above — the normal case |
| 80 pips | 0.62 lots | Wide pullback — still tradeable, but the reward has to be 2R or better |
| 120 pips | 0.41 lots | Too wide for this strategy — skip, or wait for a tighter pullback |
| 260 pips (below the 200 SMA) | 0.19 lots | The textbook stop — this is why buying the print is not a trade |
Read the last two rows together and the strategy explains itself. A fifty-pip stop buys one full lot; a two-hundred-and-sixty-pip stop buys less than a fifth of a lot for the same five hundred dollars of risk. The pullback entry is not a preference — it is the only entry where the maths lets you trade real size. My position sizing guide works through the same grid for every strategy I run.
I tested it: ten golden crosses
After September I logged the next ten daily golden crosses I was allowed to trade under the six rules — GBPUSD and EURUSD only, one active trade at a time. Six wins at an average of plus one point five R, four losses at minus one R. Net: plus five point zero R, or plus two thousand five hundred dollars. Expectancy: plus zero point five R per trade. Win rate: sixty percent.
| Trade | Pair | Entry | Result | Profit / loss |
|---|---|---|---|---|
| Cross 1 | GBPUSD | Pullback to 50 SMA | +1.5R | +$750 |
| Cross 2 | EURUSD | Pullback to 50 SMA | +1.5R | +$750 |
| Cross 3 | GBPUSD | Pullback to 50 SMA | −1.0R | −$500 |
| Cross 4 | EURUSD | Pullback to 50 SMA | +1.5R | +$750 |
| Cross 5 | GBPUSD | Flat-200 cross (before rule 2) | −1.0R | −$500 |
| Cross 6 | EURUSD | Pullback to 50 SMA | +1.5R | +$750 |
| Cross 7 | GBPUSD | Pullback to 50 SMA | −1.0R | −$500 |
| Cross 8 | EURUSD | Pullback to 50 SMA | +1.5R | +$750 |
| Cross 9 | GBPUSD | Flat-200 cross (before rule 2) | −1.0R | −$500 |
| Cross 10 | EURUSD | Pullback to 50 SMA | +1.5R | +$750 |
| Total | — | 6 wins, 4 losses | +5.0R | +$2,500 |
Two things in that log matter more than the profit. First, both flat-200 losses — crosses five and nine — happened before I added rule two, and both were range whipsaws that never reached TP1. With rule two in place, the log would have been eight trades, six wins, two losses, plus six point zero R. Second, the worst day was minus one thousand dollars — twenty percent of the daily limit — and the best day was plus seven hundred and fifty dollars, thirty percent of total profit: inside the forty percent consistency cap. The strategy did not just make money; it made it in a shape a prop firm tolerates.
Golden cross vs death cross — and vs my EMA guide
The death cross is the golden cross in a mirror, and it gets the same six rules with the direction flipped. I trade both, because a funded account that only trades one direction sits out half the year.
| Feature | Golden cross | Death cross |
|---|---|---|
| The cross | 50 SMA crosses ABOVE the 200 SMA | 50 SMA crosses BELOW the 200 SMA |
| Direction | Longs only | Shorts only |
| Entry | Pullback down to the rising 50 SMA | Rally up to the falling 50 SMA |
| Stop | Below the pullback low, 30–80 pips | Above the rally high, 30–80 pips |
| Targets | TP1 at 1R, TP2 at 2R | TP1 at 1R, TP2 at 2R |
| The trap | Buying the print, 260 pips above the 200 | Selling the print, 260 pips below the 200 |
The honest boundary with my own EMA guide: that article is the intraday timing system — 9 and 21 EMAs on the 15-minute chart, explicitly no crossover system, entries on bounces to the 21. This article is the daily regime system — 50 and 200 SMAs on the daily chart, where the cross IS the setup and the entry is the pullback to the 50. Different indicator, different timeframe, different job. Both agree on the one rule that matters: a crossover is permission to look for an entry, never the entry itself.
When the golden cross fails
The strategy fails in five specific ways, and I have paid for four of them. The fix for each one is already a rule above.
| Failure | What it cost me | The fix |
|---|---|---|
| Flat 200 SMA — the cross prints in a range | −$1,000 across crosses 5 and 9 | Rule 2: the 200 must be rising 20 pips in 10 days, or no trade |
| Buying the print — the lag trap | −$190 in September, then missing a 180-pip run | Rule 4: pullback to the 50 SMA only, never the print |
| Bear-market rally — the cross prints into a weekly downtrend | −$500 on a EURUSD cross under a falling weekly 200 | Check the weekly chart: no longs while price sits below the weekly 200 SMA |
| News spike — the cross prints on a CPI candle that reverses | −$500, stopped in the first hour after the release | Rule 6: no entries 30 minutes either side of red-folder news |
| Mid-candle cross — it prints at noon and un-prints by the close | One skipped trade, no loss — caught by the close rule | Rule 3: the cross counts only at the 22:00 PKT daily close |
My golden cross routine and how it fits prop firm rules
Golden crosses are slow. That is a feature on a funded account: a strategy that fires twice a month cannot overtrade, cannot stack correlated losses in one morning, and cannot produce a best day that breaks the consistency rule.
| When (PKT) | Step | What I do |
|---|---|---|
| Sunday 21:00 | Scan | Check D1 50/200 on GBPUSD and EURUSD; note any cross and the 200 SMA slope over 10 days |
| Daily 12:30 | Check | Is price pulling back to the 50 SMA? Is the weekly 200 above or below price? Any red-folder news today? |
| 13:30 – 16:00 | London | Entries only on a bullish resumption candle at the 50 SMA; lots from the sizing grid |
| 18:30 – 21:00 | New York | Second entry window; manage TP1/TP2; no new entries after a loss hits the daily stop |
| 21:30 | Close | Log the trade with its cross number; daily loss at $2,500 means stop for the day |
The prop firm fit is the reason this strategy survives on a funded account. The daily loss limit is protected twice: by the five hundred dollar risk per trade, so five full losers equal the two thousand five hundred dollar personal stop and never touch the firm’s five thousand; and by the strategy’s own pace, which caps the damage at one or two trades a week. The consistency rule is protected by the fixed 1R/2R targets: no single day in the ten-trade log exceeded thirty percent of total profit, against a forty percent firm cap. Slow, fixed and boring is exactly what a funded account rewards.
Frequently asked questions
What is the best timeframe for a golden cross?
The daily chart for the cross itself, and the four-hour chart for the shape of the pullback. Intraday crosses whipsaw in a range, so the D1 print is the regime change and the H4 shows whether the pullback to the 50 is clean or choppy.
Is the golden cross reliable?
It is a regime signal, not a guarantee. In my ten-trade log it won sixty percent of the time with an expectancy of plus zero point five R per trade, and two of the four losses were flat-200 crosses my current rules would have filtered out. Reliability comes from the filter, not from the cross alone.
Should I buy the moment the cross prints?
No. At the print, price is usually two hundred or more pips above the 200 average, so the textbook stop is so wide your size collapses to a fifth of a lot. Wait for the pullback to the rising 50 SMA and enter on the resumption candle — that is where the stop is fifty pips and the size is real.
What is the difference between a golden cross and a death cross?
They are mirror images. A golden cross is the 50 SMA crossing above the 200 — longs only, entry on the pullback to the 50. A death cross is the 50 crossing below the 200 — shorts only, entry on the rally to the 50. Same six rules, same targets, same grid, opposite direction.
Does the golden cross work on gold and indices?
The rules transfer — the 50/200 cross on a daily gold chart marks the same regime change — but the stops do not. Gold moves further and faster, so a fifty-pip stop that fits GBPUSD is far too tight for XAUUSD, and the sizing grid has to be rebuilt from gold’s own volatility. I trade this strategy on GBPUSD and EURUSD only.
Can I trade golden crosses on a funded account?
Yes. No prop firm bans moving-average strategies — the rules that matter are the daily loss limit, the maximum drawdown and the consistency rule, and this strategy is built around all three.
Risk disclaimer: Trading funded accounts involves substantial risk of loss and is not suitable for every trader. The crosses, the figures and the ten-trade log here describe my own account and my own log, not a promise of similar results.


