I lost $500 on a wave count I was sure about, and the count was not even wrong in the way I thought. EURUSD had printed what looked like a clean five-wave rise, I bought the pullback after what I labelled Wave 4, and price fell straight through my stop. When I relabelled the chart honestly, my “Wave 4” had overlapped Wave 1 — the one overlap the rules forbid in an impulse. I had not traded a strategy; I had traded a drawing that broke its own rules and called it analysis. That loss is why this article exists: Elliott Wave strategy for funded traders only works when the count is treated as a hypothesis with a kill level, a fixed risk budget and a written entry checklist — never as a forecast you defend with bigger size.
In this article
- What Elliott Wave actually claims
- The three rules that cannot break
- Fibonacci ratios that turn a count into levels
- My six-check Wave 3 entry
- The worked trade: EURUSD Wave 3, 1.25 lots, +,500
- Sizing grid: the same 0 risk at every stop distance
- Five Wave 3 trades from my journal
- When the count fails: the failure modes
- Filtered versus unfiltered: what the checklist is worth
- How Elliott Wave fits funded rules
- My daily Wave 3 routine
- Frequently asked questions
Most Elliott Wave content fails funded traders in a specific way. It teaches the pattern — five waves up, three waves down — and stops there, as if recognising the shape were the trade. On a funded account the shape is the least important part. What matters is where the count is proven wrong, how much that wrongness costs, and whether the trade that follows the count can survive the firm’s daily loss limit, trailing drawdown floor and consistency ceiling. A wave count without an invalidation price is a story. A wave count with an invalidation price, a stop inside it and a position sized to $500 is a strategy.
What Elliott Wave actually claims
Elliott Wave theory, from Ralph Nelson Elliott’s work in the 1930s, claims that market prices move in repeating structures driven by crowd psychology: five waves in the direction of the larger trend (the impulse or motive phase), followed by three waves against it (the corrective phase). Waves 1, 3 and 5 push the trend forward; Waves 2 and 4 are pullbacks inside it. Then Waves A, B and C correct the whole five-wave move. The same structure repeats at every scale — a Wave 3 on the daily chart contains its own five smaller waves on H1 — which is why two analysts can label the same chart differently and both sound convincing.
That subjectivity is the theory’s honest weakness, and funded traders must price it in from the start. A wave count is a hypothesis with a kill level, not a prediction you defend. If price breaks the level that invalidates your count, the count is dead whether or not you still believe in it, and the trade must already be closed by a stop placed before entry. Every rule in this article exists to enforce that sentence.
| Wave | Direction | Character |
|---|---|---|
| Wave 1 | With the new trend | Quiet, doubted, often mistaken for a correction of the old trend |
| Wave 2 | Against the trend | Deep pullback, usually retraces 50 to 61.8 percent of Wave 1 |
| Wave 3 | With the trend | The strongest, longest leg — the only wave I enter |
| Wave 4 | Against the trend | Shallow, choppy, must never overlap Wave 1 territory |
| Wave 5 | With the trend | Exhaustion leg, often diverges from momentum — I do not chase it |
| Waves A, B, C | Corrective | The three-wave correction of the whole five-wave move |
The three rules that cannot break
Elliott Wave has exactly three hard rules for an impulse. Everything else — Fibonacci ratios, wave personalities, alternation — is a guideline. If any hard rule breaks, the label is wrong, full stop, and any trade built on it is closed or never opened. I check all three before I even think about entry.
| Hard rule | What it means | How I check it |
|---|---|---|
| Wave 2 never retraces more than 100 percent of Wave 1 | Price must not fall below the start of Wave 1 in an uptrend impulse | The Wave 1 origin is my invalidation line; a break of it kills the count |
| Wave 3 is never the shortest of Waves 1, 3 and 5 | The middle leg must not be the smallest motive leg | I measure all three legs in pips before entry; if Wave 3 projects shortest, no trade |
| Wave 4 never overlaps Wave 1 price territory | The Wave 4 low must stay above the Wave 1 high in an uptrend | This is the rule my $500 loss broke; I draw the Wave 1 high as a hard floor line |
For the Fibonacci side of the same framework, the Elliott Wave Fibonacci guide at Proptary lays out the same discipline I use: anchor the structure to Fibonacci retracements and extensions so the count has objective levels instead of vibes, use the 50 to 61.8 percent pocket for Wave 2 entries, and project Wave 3 toward the 161.8 percent extension. I follow that guide’s levels but not its optimism — its targets are zones to scale into, not prices price is obliged to reach.
Fibonacci ratios that turn a count into levels
A count without levels gives you nowhere to enter and nowhere to be wrong. Fibonacci ratios give you both. Wave 2 typically retraces 50 to 61.8 percent of Wave 1; Wave 4 typically retraces 23.6 to 38.2 percent of Wave 3; Wave 3 typically extends to 161.8 percent of Wave 1, measured from the Wave 2 low. These are tendencies, not laws — the hard rules above outrank them — but they turn “buy the pullback” into “buy near 1.0846, stop below 1.0820, target toward 1.1040”, which is a trade a funded account can actually grade.
| Formula | Worked number |
|---|---|
| Wave 1 length | 1.0920 minus 1.0800 = 120 pips |
| Wave 2 retracement at 61.8 percent | 120 pips times 0.618 = 74 pips; 1.0920 minus 0.0074 = 1.0846 |
| Wave 3 extension at 161.8 percent | 120 pips times 1.618 = 194 pips; 1.0846 plus 0.0194 = 1.1040 |
| Position size = Risk divided by (Stop distance times $10 per pip) | $500 divided by (40 pips times $10) = 1.25 lots |
| TP1 = Wave 1 high, half position | 1.0920 — 0.625 lot times 60 pips times $10 = +$375 |
| TP2 = 161.8 percent extension, remaining half | 1.1040 — 0.625 lot times 180 pips times $10 = +$1,125 |
| Total if both targets hit | $375 + $1,125 = +$1,500 = 3R |
Note the relationship between the stop and the invalidation level, because it is the whole risk design. My stop sits at 1.0820, which is above the Wave 1 origin at 1.0800. If the stop is hit, I lose $500 and the count may technically still be alive — but I am out, flat, and free to recount. If instead I had placed the stop below the invalidation level, a single losing trade could cost far more than $500 before the count was even proven wrong. The stop must always sit inside the invalidation level, never beyond it.
My six-check Wave 3 entry
I only trade Wave 3. Wave 1 is too doubted to enter cleanly, Wave 5 is where exhaustion and divergence live, and corrective Waves A, B and C are where counts get relabelled most. Wave 3 is the leg with the trend, the momentum and the extension target behind it. Here is the checklist, and a trade needs all six checks — five out of six is a no-trade.
| Check | My rule |
|---|---|
| 1. Impulse structure | A completed Wave 1 and Wave 2, with all three hard rules intact on the H1 chart |
| 2. Wave 2 zone | Wave 2 low inside the 50 to 61.8 percent retracement pocket of Wave 1 |
| 3. Confirmation close | A full H1 candle closes back above the Wave 2 pullback structure — I never buy a falling knife mid-candle |
| 4. Higher-timeframe trend | Daily trend agrees with the Wave 3 direction; a Wave 3 against the daily trend is skipped |
| 5. Invalidation distance | Stop distance to below the Wave 2 low keeps the $500 risk at a sensible lot size (no 100-pip stops on a 1.25-lot day) |
| 6. News filter | No red-folder release between entry and TP1; if one lands, the trade waits, as with every strategy I trade |
Before I place any trade under this checklist I run the day’s numbers through the max daily drawdown calculator to confirm the total risk still sits inside the limit. One $500 Wave 3 trade is 10 percent of a $5,000 daily limit; two in a day is 20 percent, and a third needs a very good reason. The calculator keeps that arithmetic honest before entry, not after a breach.
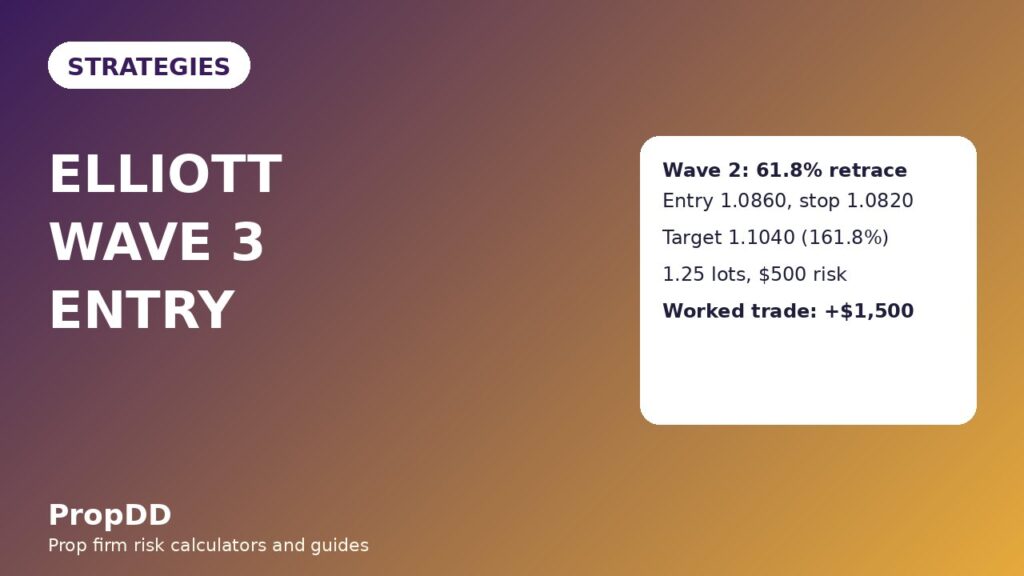
The worked trade: EURUSD Wave 3, 1.25 lots, +$1,500
The trade came from a textbook setup on EURUSD H1: Wave 1 rose from 1.0800 to 1.0920, Wave 2 pulled back to 1.0846 — almost exactly the 61.8 percent retracement — and an H1 candle closed back above the pullback structure at 1.0860. The daily trend was up, no red-folder release sat between entry and the first target, and all three hard rules were intact. Entry 1.0860, stop 1.0820 below the Wave 2 low, 40 pips of risk.
| Step | Level | Maths |
|---|---|---|
| Wave 1 | 1.0800 to 1.0920 | 120 pips of motive rise |
| Wave 2 low | 1.0846 | 61.8 percent retracement of Wave 1 (120 times 0.618 = 74 pips) |
| Entry | 1.0860 | Confirmation close above the pullback structure |
| Stop | 1.0820 | 40 pips; $500 divided by (40 times $10) = 1.25 lots |
| Invalidation | 1.0800 | Wave 1 origin — 20 pips beyond the stop, never reached while flat |
| TP1 (half) | 1.0920 | Wave 1 high, +60 pips, 0.625 lot = +$375 |
| Breakeven move | Stop to 1.0860 after TP1 | Runner can now lose $0 |
| TP2 (rest) | 1.1040 | 161.8 percent extension, +180 pips, 0.625 lot = +$1,125 |
| Total | Both targets hit | $375 + $1,125 = +$1,500 = 3R |
Price reached the Wave 1 high the same day, I banked half for +$375 and moved the stop to breakeven, and the runner reached the 161.8 percent extension two sessions later for the full +$1,500. Compare that with the version where I had entered at the Wave 2 low itself, without a confirmation close: the same trade would have been stopped out on the wick that printed 1.0831 before the reversal, for a full $500 loss on a count that turned out right. The confirmation close cost me 14 pips of entry and saved me the trade. I verified the extension level against my Fibonacci retracement levels for the same leg, and the 161.8 percent extension sat just below a prior daily swing high rather than on a round number — targets belong at levels, not at neat prices.
Sizing grid: the same $500 risk at every stop distance
Wave counts tempt traders into wide stops — “the invalidation is 100 pips away, so the stop must be 100 pips away” — and wide stops at fixed lot size are how funded accounts die. The rule is the reverse: the risk stays $500, and the lot size shrinks as the stop widens. If the stop distance makes the lot size absurd, the trade is skipped, not resized by hope.
| Stop distance | Full position at $500 risk | Half closed at TP1 | TP1 banks at 1R |
|---|---|---|---|
| 30 pips | 1.66 lots | 0.83 lot | $249 |
| 40 pips (the worked trade) | 1.25 lots | 0.625 lot | $250 |
| 50 pips | 1.00 lot | 0.50 lot | $250 |
| 60 pips | 0.83 lots | 0.415 lot | $249 |
| 80 pips | 0.62 lots | 0.31 lot | $248 |
| 100 pips | 0.50 lots | 0.25 lot | $250 |
The worked trade’s TP1 distance (60 pips) differs from its stop distance (40 pips) because TP1 is a level — the Wave 1 high — not a multiple of the stop. That is deliberate: in wave trading, targets come from structure, and the stop comes from invalidation. Forcing them into a neat 1R/2R box would mean moving either the stop or the target off its level, which is exactly how a good count becomes a bad trade. The grid above keeps the risk fixed while the levels do their own work.
Five Wave 3 trades from my journal
Five consecutive Wave 3 setups that passed all six checks, traded at $500 risk each. Two ran to the full extension, one banked TP1 then returned to breakeven, and two stopped out — one on a Wave 2 low break, one on a relabelled count where Wave 4 overlapped Wave 1 and I exited on the rule, not on hope.
| Trade | Outcome | Result |
|---|---|---|
| 1. EURUSD Wave 3 (the worked trade) | TP1 + TP2 both hit | +$1,500 |
| 2. GBPUSD Wave 3 | Stopped below the Wave 2 low | −$500 |
| 3. EURUSD Wave 3, second leg | TP1 + TP2 both hit | +$1,500 |
| 4. USDJPY Wave 3 | TP1 banked, runner to breakeven | +$375 |
| 5. EURGBP Wave 3 | TP1 + TP2 both hit | +$1,500 |
| Total | 3 full wins, 1 partial, 1 loss | +$4,375 = +8.75R |
When the count fails: the failure modes
Wave counts fail in predictable ways, and each failure mode has a funded-account cost attached. The table below is the one I re-read before trading any count, because every row in it has cost me money at least once.
| Failure mode | What happens | Funded-account cost |
|---|---|---|
| Relabelling under pressure | Price breaks invalidation, trader renames the waves instead of exiting | A $500 planned loss becomes a daily-limit breach |
| Wave 4 overlap ignored | Wave 4 dips into Wave 1 territory, trader trades it anyway | The “impulse” was a correction; the reversal runs through the stop |
| Chasing Wave 5 | Entering the exhaustion leg after Wave 3 already extended | Wave 5 truncates or reverses into a full ABC correction |
| Counting against the daily trend | A neat H1 count fights a daily impulse the other way | The larger degree wins; the small count is just noise inside it |
| News spike relabel | A red-folder spike prints a fake wave, count rebuilt around it | Entries on spike structure reverse the moment spreads normalise |
| Forcing a count in a range | Labelling sideways chop as waves 1 through 5 | Five small losses in a week, each “justified” by a new label |
The defence against all six is the same: the checklist, the stop inside invalidation, and the rule that a broken count is never repaired mid-trade. A repaired count is a new trade, and a new trade needs a new checklist pass, a new confirmation close and a new $500 budget — not a bigger position on the old one. That discipline is also what keeps the strategy inside consistency rules: after a winning run I check the consistency rule calculator, because a single $1,500 Wave 3 winner is 22.6 percent of the filtered test’s net below — inside a typical 30 percent ceiling, but only if the rest of the week is not one giant day and nine scratches.
Filtered versus unfiltered: what the checklist is worth
I tested the six-check filter on 27 Wave 3 candidates from my journal: 12 passed all six checks, 15 failed at least one (usually the confirmation close or the daily-trend agreement). The filtered set and the unfiltered set tell the story plainly.
| Measure | Filtered (12 trades, all six checks) | Unfiltered (15 trades, any count traded) |
|---|---|---|
| Wins | 8 (5 full +$1,500, 3 partial +$375) | 6 (4 full +$1,500, 2 partial +$375) |
| Losses | 4 at −$500 = −$2,000 | 9 at −$500 = −$4,500 |
| Gross winners | $7,500 + $1,125 = $8,625 | $6,000 + $750 = $6,750 |
| Net result | $8,625 − $2,000 = +$6,625 = +13.25R | $6,750 − $4,500 = +$2,250 = +4.5R |
| Best single trade | $1,500 — 22.6 percent of net (inside 30 percent) | $1,500 — 66.7 percent of net (above 30 percent) |
| Filter worth | $6,625 − $2,250 = $4,375 across 27 trades | |
The unfiltered set still made money, and I am not going to hide that — raw wave counting has an edge even traded loosely. But its best day was two-thirds of its entire net, which is exactly the shape that gets a payout flagged under a consistency rule, and its losing run was nine trades long, which is exactly the shape that breaks a funded trader’s nerve before it breaks the account. The filter did not invent the edge; it kept the edge payable.
How Elliott Wave fits funded rules
Wave trading fits funded rules well in one respect and badly in another, and both matter. It fits well because every trade has a natural invalidation level, which makes the stop a rule rather than a guess — the single best property a funded strategy can have. It fits badly because wave traders love to be right about the big picture, and being right about the big picture is what produces oversized Wave 5 chases, relabelled losers and revenge trades after a “correct” count fails. The funded version of this strategy is therefore narrower than the textbook version: Wave 3 only, confirmation close only, stop inside invalidation always, one Wave 3 trade per pair per day, and no trade at all when the count is ambiguous. Ambiguity is not a setup; it is the market telling you to wait, and waiting is free while breaching is not.
It also sits cleanly alongside the strategies I already trade. My trend pullback plan takes any clean pullback in a trend; the Wave 3 plan takes only pullbacks that complete a valid Wave 2 inside a counted impulse, which is a stricter subset with a structural target attached. My Dow Theory plan reads trend structure through higher highs and volume; Elliott Wave reads the same structure through wave degrees and Fibonacci ratios. And my Wyckoff work covers accumulation and distribution phases that wave counts often mislabel as impulses. When two of these frameworks agree on a level, I trade it; when they disagree, I trade smaller or not at all.
My daily Wave 3 routine
| Time | Action |
|---|---|
| Before London open | Mark H1 and daily wave counts on EURUSD and GBPUSD only; discard any count with a broken hard rule |
| London session | Watch Wave 2 pockets (50 to 61.8 percent) for a confirmation close; no mid-candle entries |
| On confirmation | Size from the stop distance at $500 risk via the drawdown calculator; place stop inside invalidation |
| At TP1 (Wave 1 high) | Bank half, move the runner’s stop to breakeven immediately, leave the runner alone |
| At TP2 (161.8 percent) | Bank the rest; log the trade with its wave labels, not just its result |
| End of day | Recount with fresh eyes; a count that needs repairing overnight was never a count |
That routine is the whole system. Counts will keep varying — different pairs, different degrees, different Fibonacci pockets — but the entry will not, and on a funded account the entry discipline is the part the firm actually grades. Start with Wave 3 only, keep the $500 risk fixed, and let the 27-trade test be your judge: if your filter does not shrink your best-day share and shorten your losing runs, change the checklist, not the risk. The count is what gets you into the trade; the invalidation is what gets you to the payout.
Frequently asked questions
Is Elliott Wave too subjective for a funded account?
It is subjective if you trade every count you can draw. It becomes tradable when you restrict yourself to Wave 3, require all six checklist checks, and place the stop inside a written invalidation level. The subjectivity then lives in which counts you skip, and skipping is free.
Why only trade Wave 3 and not Waves 1 or 5?
Wave 1 is doubted and often mislabelled as a correction, and Wave 5 is the exhaustion leg where momentum diverges and corrections begin. Wave 3 has the trend, the momentum and the 161.8 percent extension target behind it. On a funded account, one strong leg traded well beats three legs traded hopefully.
What invalidates a Wave 3 count after I enter?
In an uptrend impulse, a break below the Wave 1 origin invalidates the whole impulse, and a Wave 4 overlap of Wave 1 territory invalidates the impulse label. My stop sits above the Wave 1 origin, so I am usually out before formal invalidation — that is intentional, because a stop is cheaper than a proof.
Do Fibonacci ratios really predict wave targets?
They do not predict; they prioritise. The 61.8 percent Wave 2 pocket and the 161.8 percent Wave 3 extension are where reversals and extensions cluster most often, which makes them the best places to put entries, stops and targets. When price ignores them, the checklist — not the ratio — decides the exit.
How does Elliott Wave interact with the consistency rule?
Wave 3 winners are large — $1,500 on a $500 risk in the worked trade — so one winner can dominate a week’s profit. That is why the filtered test matters: its best day was 22.6 percent of net, inside a typical 30 percent ceiling, while the unfiltered set’s best day was 66.7 percent. Big winners need many trades around them, not bigger size on the next one.
Can I trade Elliott Wave on lower timeframes under funded rules?
You can, but the counts multiply and the spreads and noise eat the edge. I trade Wave 3 on H1 with a daily-trend filter. Below H1, a “Wave 3” is often just one candle’s noise with a label on it, and funded rules punish noise-chasing faster than any other habit.
Risk disclaimer: This article describes my own funded-account wave strategy for education only. It is not financial advice, and past results on my account do not predict yours. Prop firm rules change — always read your firm’s current rulebook before trading, and never risk money you cannot afford to lose.



