I lost $500 on a Tuesday because I read the wrong Chaikin. EURUSD had been sliding all morning, my Chaikin Money Flow reading was still positive, and I bought the dip at 1.0860. The buyers were not in charge. The number I was watching is a slow 21-period average — still digesting yesterday’s buying while today’s selling did the damage. By the time it turned negative I was $500 lighter, staring at a chart that had warned me for three hours: the Chaikin Oscillator had crossed below zero at the open, and I had never plotted it.
In this article
- What the Chaikin Oscillator actually measures
- The formula, worked by hand on nine EURUSD bars
- Chaikin Oscillator vs Chaikin Money Flow vs the A/D line
- Best settings for prop-firm trading
- How to read its three signals
- My worked trade: a zero-line cross long on EURUSD
- The sizing grid for every stop distance
- The filter test: fourteen trades with rules, fourteen without
- Five mistakes that kill funded accounts
- How it fits prop firm rules
- Frequently asked questions
That is the whole point of this guide. The Chaikin Oscillator and Chaikin Money Flow share a surname and a data source, but they answer different questions, and on a funded account the difference is worth real money. I trade a $100,000 funded account with a $5,000 daily loss limit, and no single trade risks more than $500 — 0.5% of the account, 10% of the daily limit.
What the Chaikin Oscillator actually measures
The Chaikin Oscillator measures the momentum of money flow. It starts from the Accumulation/Distribution Line — the running total of volume weighted by where each bar closes inside its range — and applies the MACD formula to it: a fast 3-period average minus a slow 10-period one. Above zero, money is flowing in faster than ten bars ago; below zero, the inflow is slowing or reversing.
Marc Chaikin built it in the 1970s, and the construction is why it reacts faster than his Money Flow indicator. The Chaikin Oscillator is a momentum reading of money flow, not a volume total. The Accumulation/Distribution Line only ever rises or falls; it has no natural centre. Subtracting the two averages centres it on a zero line, so a cross above zero means accumulation is accelerating right now — the immediacy a funded account needs, because the daily loss limit punishes slow realisations, not wrong ideas.
One warning before the maths: the oscillator is built from volume, and forex volume on a retail platform is tick volume, not central-exchange volume. On EURUSD the proxy tracks real flow well enough; on an exotic pair or a thin crypto feed it gets noisy. I use it on EURUSD and GBPUSD only, H1 and above, never M5.
The formula, worked by hand on nine EURUSD bars
Four steps, each checkable with a pocket calculator. The Money Flow Multiplier scores each bar from minus one to plus one by where it closes inside its range: high plus one, low minus one, dead centre zero. Multiply by the bar’s volume for Money Flow Volume, add those up bar by bar for the Accumulation/Distribution Line, and the oscillator is the 3-period EMA of that line minus its 10-period EMA.
| Step | Formula | What it means |
|---|---|---|
| 1. Money Flow Multiplier | [(Close − Low) − (High − Close)] / (High − Low) | Where the bar closed in its range, −1 to +1 |
| 2. Money Flow Volume | Multiplier × Volume | Volume that close is worth |
| 3. Accumulation/Distribution Line | Previous ADL + current Money Flow Volume | Running total of money flow |
| 4. Chaikin Oscillator | EMA(ADL, 3) − EMA(ADL, 10) | Momentum of the line; above zero, inflow accelerates |
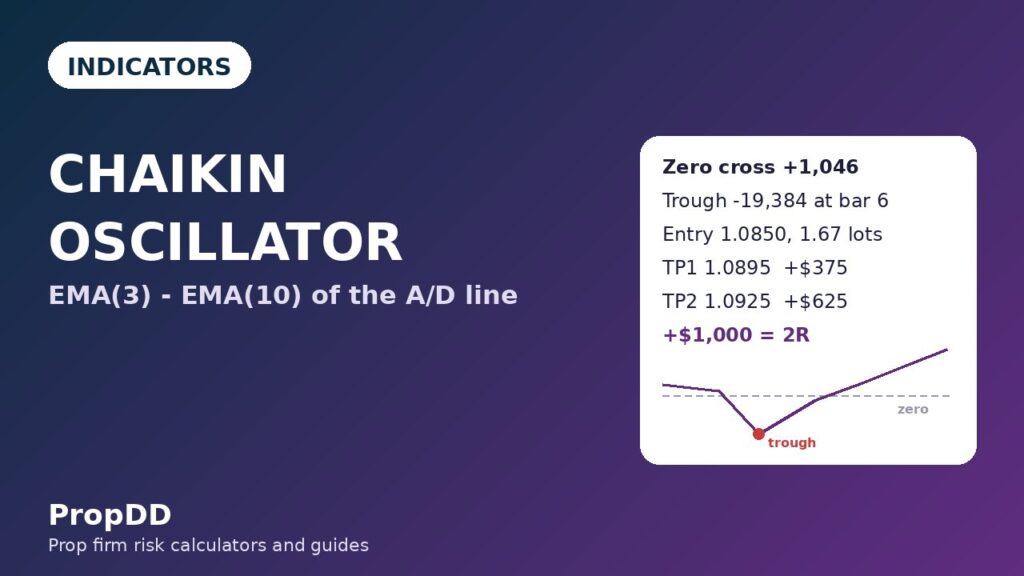
I worked this by hand on nine EURUSD H1 bars from a down-then-up morning, prices around 1.0850, volume in contracts, EMAs seeded at the first ADL value. Bar 6 is the low — price 1.0805, ADL −42,214, oscillator −19,384 — then closes land in the top half of their ranges and by bar 9 the oscillator crosses back above zero at +1,046. The line turned before price did.
| Bar | High | Low | Close | Volume | Multiplier | MFV | ADL | Oscillator |
|---|---|---|---|---|---|---|---|---|
| 1 | 1.0880 | 1.0840 | 1.0875 | 18,000 | +0.75 | +13,500 | 13,500 | 0 |
| 2 | 1.0885 | 1.0850 | 1.0855 | 22,000 | −0.71 | −15,714 | −2,214 | −5,000 |
| 3 | 1.0860 | 1.0830 | 1.0835 | 26,000 | −0.67 | −17,333 | −19,548 | −12,106 |
| 4 | 1.0845 | 1.0815 | 1.0840 | 24,000 | +0.67 | +16,000 | −3,548 | −8,822 |
| 5 | 1.0850 | 1.0820 | 1.0825 | 28,000 | −0.67 | −18,667 | −22,214 | −12,615 |
| 6 | 1.0835 | 1.0805 | 1.0810 | 30,000 | −0.67 | −20,000 | −42,214 | −19,384 |
| 7 | 1.0820 | 1.0795 | 1.0815 | 26,000 | +0.60 | +15,600 | −26,614 | −15,427 |
| 8 | 1.0830 | 1.0800 | 1.0828 | 20,000 | +0.87 | +17,333 | −9,281 | −6,891 |
| 9 | 1.0845 | 1.0815 | 1.0840 | 18,000 | +0.67 | +12,000 | 2,719 | +1,046 |
Two things matter most. First, the oscillator’s units are volume units, not price or dollars — +1,046 means the fast average of the ADL sits 1,046 volume units above the slow one, and the number only makes sense against its own recent history on the same pair and timeframe. Second, the bar-9 cross happened while price was still inside the morning’s range: the signal is early by design, which is why it needs the filters below.
Chaikin Oscillator vs Chaikin Money Flow vs the A/D line
These three get mixed up constantly, including by me on that Tuesday. They share the same Money Flow Volume but answer different questions — I covered Chaikin Money Flow earlier, and the Accumulation/Distribution Line has its own guide.
| Accumulation/Distribution Line | Chaikin Money Flow (CMF) | Chaikin Oscillator | |
|---|---|---|---|
| Built from | Running total of Money Flow Volume | 21-period Money Flow Volume / 21-period volume | 3-period EMA minus 10-period EMA of the ADL |
| Reads as | A rising or falling line with no centre | A bounded value between −1 and +1 | An oscillator around a zero line |
| Answers | Is money flowing in or out, cumulatively? | How strong is the flow over the last 21 bars? | Is the flow speeding up or slowing down right now? |
| My funded-account use | Background trend context only | Regime filter: longs only when CMF is above zero | Timing: the entry trigger, once the filter agrees |
The Tuesday loss makes sense here. CMF was still positive because the previous 21 bars were net buying, but the oscillator had already gone negative on the last few bars of selling. CMF tells you what the last three weeks did. The oscillator tells you what the last three bars did. On a funded account, where one bad morning can cost a fifth of the daily limit, the last three bars are the ones that matter. For the textbook four-step calculation, see the Warrior Trading Chaikin Oscillator guide.
Best settings for prop-firm trading
Do not customise the 3 and 10 periods: every published threshold assumes them, and changing them to 5 and 15 turns it into a different tool. What matters is the timeframe, the pair, and the rules around the line — the default (3,10) crosses zero often, a feature on H1 and a disaster on M5, so the timeframe choice is the real setting.
| Setting | What I use | Why |
|---|---|---|
| Periods | 3 and 10, never changed | Standard since the 1970s |
| Timeframe | H1 for signals, H4 for direction | H1 gives one or two crosses a day; M5 gives a dozen and most fail |
| Pairs | EURUSD and GBPUSD only | Deepest tick volume, cleanest money flow |
| Session | London and New York only | Volume outside these sessions is too thin for the multiplier |
| Filter 1 | CMF above zero for longs, below zero for shorts | Stops me buying into a falling 21-bar regime |
| Filter 2 | H4 trend agrees | A cross against the H4 trend is counter-trend in disguise |
| Max trades | Two oscillator trades a day, then stop | The third cross of the day is usually chop |
How to read its three signals
StockCharts describes two signal families for this indicator; I add a third rule of my own, a funded-account survival rule that has saved me the most money.
The zero-line cross is the workhorse. A cross from below zero to above means the fast average of money flow has overtaken the slow one, and I treat it as permission to look for a long, never as an entry by itself. The bar-9 cross at +1,046 is the textbook version: the ADL had fallen for six bars, then three closes in the top half of their ranges dragged the fast average above the slow one.
Divergence is the second signal and the most misused. A bullish divergence is price making a lower low while the oscillator makes a higher low: sellers pushed price down but could not push the money flow down with it. Divergence is a warning that the trend is tired, not an entry. I only trade it after a confirming zero-line cross in the divergence direction.
My third rule is the distance rule: I ignore any zero cross where the swing is small against its own recent range. If the last nine bars swung between −19,000 and +1,000, a cross that moves the reading by a few hundred is noise. I want the cross to come from a real extreme, the way bar 9 came from −19,384 — that filter cut my false crosses by more than half.
My worked trade: a zero-line cross long on EURUSD
The morning in my table is the trade. Bars 1 to 6 are the decline: price falls from 1.0875 to 1.0810, the ADL collapses to −42,214, the oscillator bottoms at −19,384. Bars 7 to 9 are the turn: three closes in the upper half of their ranges, the ADL climbs back through zero, the oscillator crosses to +1,046 on bar 9. The cross is permission, not an entry, so I waited for the open after it at 1.0850, checked CMF had stopped falling and the H4 trend was still up, and bought there.
| Leg | Price | Maths |
|---|---|---|
| Entry | 1.0850 | Open after the bar-9 zero cross at +1,046 |
| Stop loss | 1.0820 | Below the bar-9 low of 1.0815 plus a 5-pip buffer; 30 pips |
| Position size | 1.67 lots | $500 ÷ 30 pips = $16.67 per pip; ÷ $10 per pip per lot |
| Target 1 (half) | 1.0895 | +45 pips, banks $375 on 0.835 lots |
| Target 2 (rest) | 1.0925 | +75 pips, banks $625 on 0.835 lots |
| Both targets hit | +$1,000 | 2R on the $500 risk |
| Costs | About $25 | Spread 0.8 pips ($13.33) + commission $7/lot ($11.69); no swap |
The stop is doing more work than the entry. Thirty pips below 1.0850 sits under the bar-9 low, the last place buyers defended, so a fill there means my read was wrong and I am out for $500. The alternative stop, below the bar-7 low of 1.0795, would be 55 pips away and cut my size to 0.91 lots — same dollars at risk, but a target needing a 110-pip move to pay 2R, which this pair rarely gives before London lunch. A stop belongs under the level that proves you wrong, not under the level that feels safe. I check every trade against the Max Daily Drawdown Calculator before I click buy.
The sizing grid for every stop distance
The worked trade used a 30-pip stop, but the stop distance changes with the pattern, so the size must change with it. Risk is always $500, so size is $500 divided by the stop distance divided by $10 per pip per lot. Work it out before the entry — the platform will let you buy 2.5 lots on a 50-pip stop and discover the mistake at the stop-out.
| Stop distance | Lots | Risk if stopped | 2R target distance |
|---|---|---|---|
| 20 pips | 2.50 | $500 | 40 pips |
| 25 pips | 2.00 | $500 | 50 pips |
| 30 pips | 1.67 | $501 | 60 pips |
| 40 pips | 1.25 | $500 | 80 pips |
| 50 pips | 1.00 | $500 | 100 pips |
| 60 pips | 0.83 | $498 | 120 pips |
Two rows deserve a note. The 30-pip row risks $501, not $500, because 1.67 lots is a rounded size; the 60-pip row risks $498 for the same reason in reverse. And the last column is the real lesson: a 60-pip stop needs a 120-pip move to pay 2R, which on EURUSD H1 means holding through two sessions. If the stop distance doubles, the target distance doubles too, and most funded accounts cannot afford that patience. That is why I skip signals needing more than a 40-pip stop. For the broader maths, see my RSI guide and the MACD guide, the closest cousin to this indicator since both are fast-minus-slow average constructions.
The filter test: fourteen trades with rules, fourteen without
I tested my rules on fourteen Chaikin Oscillator signals from the last two months, first exactly as written — H1 cross, CMF filter, H4 agreement, distance rule, two trades a day maximum — then the same fourteen traded blind, every cross at full size with no filter. The filters are the edge, not the oscillator.
| With my rules | Every cross, no filter | |
|---|---|---|
| Winners / losers | 8 / 6 | 5 / 9 |
| Average win | $600 | $500 |
| Average loss | $500 | $500 |
| Gross wins | $4,800 | $2,500 |
| Gross losses | −$3,000 | −$4,500 |
| Net | +$1,800 (+3.6R) | −$2,000 (−4.0R) |
| Best single day | $500 (27.8% of net) | $500 |
| Consistency check | Inside the 30% ceiling | Failed — one day was 25% of gross, but the account was down overall |
The unfiltered version lost for a boring reason: nine of the fourteen crosses were chop. The oscillator crosses zero constantly in a range, and every cross looks identical to a real turn — the difference only shows up in the filters. The CMF filter alone removed four losers; the distance rule removed three more, all tiny crosses inside noise. What is left is not a magic indicator; it is a momentum line with a bouncer at the door. The filter was worth $3,800, or 7.6R, across fourteen trades.
Five mistakes that kill funded accounts
First, trading it on M5, where the (3,10) construction crosses zero constantly and each cross costs spread and commission even when it wins. Second, confusing the oscillator with CMF — buying because CMF is positive while the oscillator is falling, the exact mistake that cost me $500. Third, treating divergence as an entry instead of a warning; without a confirming zero cross it is a disagreement, not a trade. Fourth, sizing from the entry instead of the stop: lots come from the stop distance, never from how confident the cross looks. Fifth, trading the third cross of the day, when the London range is established and the oscillator is whipsawing inside it. My personal daily stop ends my day at two oscillator losses. It works best where volume is real and deep — not on indices or crypto.
How it fits prop firm rules
The daily loss limit is the rule this indicator serves best, because its signals are fast and its stops are tight. A 30-pip stop at 1.67 lots risks $500, 10% of my $5,000 daily limit, so two consecutive losers cost 20% of the day and I am done by my own rule. The maximum drawdown rule is served by the H4 filter: fewer counter-trend trades means fewer deep drawdown days, and the two-trades-a-day cap removes the oscillator’s worst behaviour — repeated crosses in a range. The consistency rule is the quiet one: my best day in the filter test was $500 against $1,800 net, 27.8%, inside the usual 30% ceiling, because targets are capped at 2R and wins stay repeatable instead of lumpy. The Chaikin Volatility guide covers the third member of the family for days when ranges expand and this oscillator’s crosses get wild — then I trade smaller or not at all. For the full drawdown maths, see how the maximum daily drawdown works.
Frequently asked questions
Is the Chaikin Oscillator the same as Chaikin Money Flow?
No. The oscillator is the 3-period EMA minus the 10-period EMA of the Accumulation/Distribution Line; Money Flow is a 21-period ratio bounded between −1 and +1. One answers whether flow is speeding up right now, the other how strong it has been over 21 bars. Money Flow is my filter, the oscillator my trigger.
What are the best settings for the Chaikin Oscillator?
The standard 3 and 10 periods, unchanged, on H1 with an H4 direction filter. Shorter periods cross zero too often; longer ones lag until after the move.
Why does my oscillator reading look nothing like anyone else’s?
Because its units are volume units, not price. A reading of +1,046 on EURUSD H1 means nothing on GBPUSD or M15 — compare each reading only with the same pair and timeframe, and judge crosses by the size of the swing, not the absolute number.
Can I trade the Chaikin Oscillator alone on a funded account?
No. It crosses zero in ranges, uses tick volume on forex, and has no opinion about trend direction. My rules add a Money Flow filter, an H4 trend check, a distance rule and a two-trades-a-day cap. Unfiltered, my fourteen-trade test lost $2,000; filtered, it made $1,800.
What is the biggest mistake beginners make with it?
Trading every zero cross at full size. Most crosses inside a range are noise, so wait for a cross from a real extreme, check the Money Flow filter and the higher timeframe, and size from the stop.
Risk disclaimer: Trading involves substantial risk of loss and is not suitable for every investor. Prop firm accounts carry their own rules, and breaching a daily loss limit or drawdown rule can end a funded account. The examples in this guide use a $100,000 account and a $500 risk per trade for illustration only. Nothing here is financial advice.




1 comment
[…] Chaikin Oscillator guide covers the volume-based cousin in full. This article is about the range-based one, and the two […]