I lost 500 dollars on a blow-off top I was sure I understood, and the loss itself taught me less than the trade I refused afterwards. It was a Tuesday morning on GBPUSD, and price had climbed in a straight, almost vertical line for two days. I shorted the top because it looked exhausted, price paused for one candle, then ripped another 80 pips higher and stopped me out. The next week the same shape appeared again, only this time I waited. Price rolled over, fell back through the trendline it had been climbing along for a week, retested that line from below, and then fell 100 pips. The difference between the two trades was not courage or conviction. It was a line I had drawn before the bump ever started, and a rule that said the pattern does not exist until price breaks that line. That rule is the whole strategy in this guide: a bump and run reversal is a three-phase pattern, and on a funded account I only trade the third phase, with a stop I can afford and a size the daily loss limit allows.
In this article
- What the bump and run reversal actually is
- The three phases, measured rather than guessed
- The six rules I trade, in order
- Where the stop and targets sit, and why
- The worked trade, pip by pip
- Five trades, win or lose, with the running total
- When the pattern fails, and what I do instead
- How it fits the funded-account rules
- The daily routine for this pattern
- Frequently asked questions
Every number in this guide uses the same account as the rest of this series: a 100,000-dollar funded account, a 5,000-dollar firm daily loss limit, and a personal daily stop of 1,000 dollars. I risk 500 dollars per trade, 0.5 percent of the account. If two trades stop out, my day is over at minus 1,000 dollars, with 4,000 dollars of firm headroom untouched. That buffer is the point: the sizing has to survive the losing days, not just celebrate the winning ones.
What the bump and run reversal actually is
The bump and run reversal, documented by Thomas Bulkowski, describes an advance that accelerates until it cannot sustain itself, then reverses through the trendline that supported the original advance. It has three phases, and the order matters. The lead-in phase is an orderly advance along a moderately sloping trendline, with several touches and no wild speculation. The bump phase is a sharp acceleration away from that trendline, steeper and faster than the lead-in, driven by traders piling in late. The run phase begins when price rolls over, falls back to the lead-in trendline, and breaks through it. The trade is the run, not the bump. Anyone who shorts the bump itself is guessing at a top; anyone who waits for the break is trading a confirmed change of structure.
The pattern works in both directions. The version I describe in detail here is the topping version: an uptrend, a blow-off bump, then a break down through the lead-in trendline. The bottom version is the mirror image: a downtrend, a capitulation bump downward, then a break up through the falling lead-in trendline. The rules are identical with the directions reversed, and the five-trade log at the end of this guide includes one bullish inverse trade so you can see the mirror image in real numbers.
The three phases, measured rather than guessed
Most traders draw the trendline after the bump has already happened, which makes every steep rise look like a pattern in hindsight. The discipline is to draw the lead-in trendline while the advance is still orderly, and to measure the bump against it. Bulkowski’s validity test is the filter I use: the bump’s height, measured vertically from its peak down to the lead-in trendline, must be at least twice the lead-in height, measured from the highest lead-in high down to the same trendline. If the bump is not at least twice as tall, it is just a strong leg of the same trend, not a speculative blow-off, and I do not trade it.
| Phase | What price does | What I measure | Pass mark |
|---|---|---|---|
| Lead-in | Orderly advance with several trendline touches | Trendline slope and lead-in height | At least three touches, slope moderate, not vertical |
| Bump | Sharp acceleration away from the trendline | Bump height vs lead-in height, and bump slope vs lead-in slope | Bump at least 50 percent steeper, and at least twice as tall as the lead-in height |
| Run | Rollover, return to the trendline, break through it | Break close and retest behaviour | Close through the trendline, then a retest that holds below it |
In my worked example below, the lead-in height is 40 pips and the bump height is 160 pips, four times the lead-in height, so the pattern passes the test with room to spare. Angles on a chart depend on how you scale the axes, so I treat the height ratio as the working test and the slope as a visual check. If I cannot measure both heights from a trendline I drew before the bump, I have no pattern, only a story.
The six rules I trade, in order
A reversal pattern without entry rules is just a picture. These six rules are the complete setup, and I take no bump and run trade that breaks any of them. Rule one is the trendline itself: it must be drawn from the lead-in phase, with at least three touches, before the bump begins. Rule two is the validity test: bump height at least twice the lead-in height. Rule three is the rollover: price must stall and set a lower high after the bump peak, not just pause for one candle. Rule four is the break: a candle must close through the lead-in trendline. A wick through the line is not a break. Rule five is the retest: price must come back up to the broken trendline and fail there, closing below it. Rule six is the session filter: I only take the trade in the London or New York session, never in the thin Asian hours, and never within 30 minutes of a high-impact news release on the pair.
| Rule | The test | If it fails |
|---|---|---|
| 1. Lead-in trendline | Drawn before the bump, at least three touches | No pattern, no trade |
| 2. Bump validity | Bump height at least twice the lead-in height | Strong trend leg, not a blow-off, no trade |
| 3. Rollover | Lower high after the bump peak | Still rising, wait |
| 4. Trendline break | Candle closes through the lead-in trendline | Wick only, wait |
| 5. Retest holds | Price retests the broken line and closes below it | Price closes back above the line, pattern invalid |
| 6. Session and news filter | London or New York session, no high-impact news within 30 minutes | Skip the setup, however clean it looks |
Rule five is the one most traders skip, and it is the one that saves the most money. Entering on the break itself feels decisive, but the break candle is often the most extended candle of the move, and the stop has to sit far away to survive the retest. Entering on the failed retest gives a tighter stop, a better entry price, and a clear invalidation point: a close back above the broken trendline. If price closes back above the line after I enter, I am wrong, and the stop takes me out for the planned 500 dollars. That is a cheap lesson. Entering on the break and watching price retest through my entry is the expensive version of the same lesson.
Where the stop and targets sit, and why
For the retest entry, the stop sits above the highest retest candle, plus a small buffer. It does not sit above the bump peak. That choice is deliberate and it is the funded-account adaptation of the classic pattern. The classic stop above the bump peak would be roughly 100 pips away in my worked example, which would halve my size to 0.50 lots for the same 500-dollar risk and would keep me in a trade whose invalidation I had already passed. The retest entry is invalidated when price closes back above the broken trendline, so the stop belongs just above the retest high, where that invalidation becomes undeniable. If the retest high is so far from the entry that the stop exceeds 80 pips, the trade is too wide for my 500-dollar risk at a sensible size, and I skip it rather than shrinking the size to nothing.
Targets follow the same half-and-half exit I use across this series. The first target sits at one times the risk distance, where I take half the position off and move the stop to breakeven. The second target sits at twice the risk distance, where the rest comes off. A full winner therefore pays 1.5 times the risk: half at 1R plus half at 2R. I do not chase a measured-move target down to the start of the bump, because the run phase often stalls at the first old support level, and a funded account is paid on banked profit, not on how far price eventually travels after I am out.
The worked trade, pip by pip
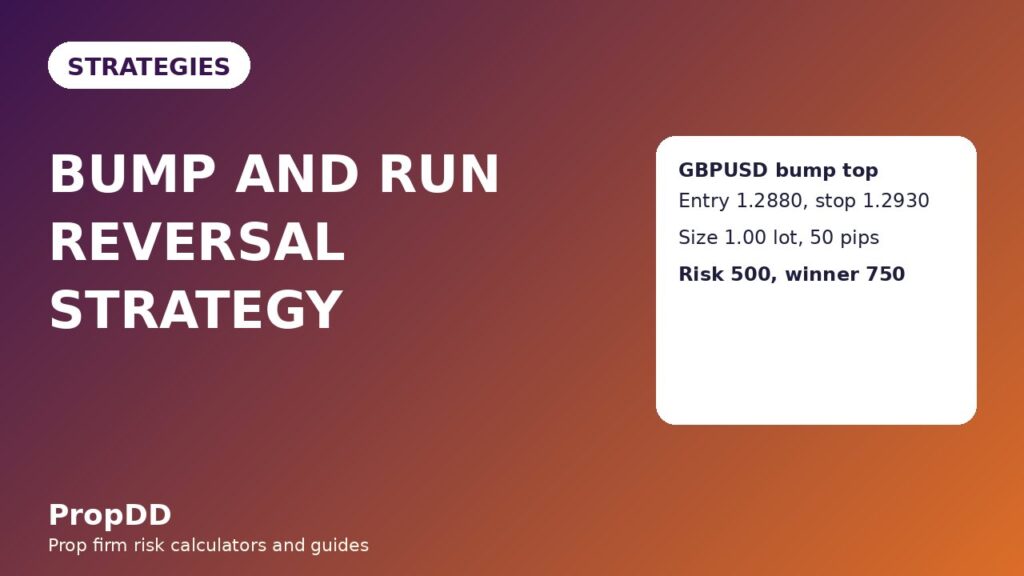
The worked trade is a bearish bump and run top on GBPUSD. The lead-in advance runs from 1.2600 up to 1.2720 along a rising trendline, with the highest lead-in high sitting 40 pips above the trendline. The bump then accelerates to a peak of 1.2980, where the trendline extended forward sits at 1.2820, giving a bump height of 160 pips, four times the lead-in height. Price rolls over, sets a lower high, and closes through the lead-in trendline. It then retests the broken line from below, reaching 1.2915 and closing back below the line. I enter short at 1.2880 on that failed retest, with the stop at 1.2930, above the retest high plus a buffer, a distance of 50 pips.
| Step | Level | Maths |
|---|---|---|
| Lead-in height | 40 pips above the trendline | Highest lead-in high minus trendline value |
| Bump height | 160 pips above the trendline | Bump peak 1.2980 minus trendline value 1.2820 |
| Validity test | 160 / 40 = 4 times | Pass: at least twice the lead-in height |
| Entry (short, failed retest) | 1.2880 | Below the broken trendline after the retest fails |
| Stop | 1.2930 (50 pips) | Above the retest high of 1.2915 plus buffer |
| Size | 1.00 lot | 500 / (50 x 10) = 1.00 lot |
| First target (half off) | 1.2830 (50 pips, 1R) | Half position banks 250 dollars |
| Second target (rest off) | 1.2780 (100 pips, 2R) | Remaining half banks 500 dollars |
| Total winner | 750 dollars (1.5R) | 250 + 500 = 750 dollars |
The sizing formula is the one I use for every trade in this series: size in lots equals the dollars risked divided by the stop distance in pips multiplied by the pip value per lot. For GBPUSD a standard lot carries a pip value of 10 dollars, so 500 divided by 50 times 10 gives exactly 1.00 lot, risking 500 dollars. If the stop had been 40 pips, the size would have been 1.25 lots; if it had been 80 pips, 0.62 lots. The grid below covers every stop distance I actually use, and every row risks within a few dollars of 500, because I round the size down, never up.
| Stop distance | Size (lots) | Dollars risked |
|---|---|---|
| 30 pips | 1.67 | 501 dollars |
| 40 pips | 1.25 | 500 dollars |
| 50 pips | 1.00 | 500 dollars |
| 60 pips | 0.83 | 498 dollars |
| 80 pips | 0.62 | 496 dollars |
| 100 pips | 0.50 | 500 dollars |
I checked this sizing against the firm’s daily limit before I ever traded the pattern live, using the max daily drawdown calculator on this site. The table below shows the inputs and outputs that matter for this strategy: with a 500-dollar risk per trade and a 1,000-dollar personal daily stop, two losing trades end my day, while the firm limit alone would allow ten. That gap is intentional. The personal stop is what keeps a bad morning from becoming a breached account.
| Input | Value | Output | Value |
|---|---|---|---|
| Account size | 100,000 dollars | Risk per trade | 500 dollars (0.5 percent) |
| Firm daily loss limit | 5,000 dollars | Losing trades to hit the firm limit | 10 trades |
| Personal daily stop | 1,000 dollars | Losing trades to hit my personal stop | 2 trades, then I stop for the day |
| Winner (half at 1R, half at 2R) | 750 dollars | One winner covers | 1.5 losing trades |
Five trades, win or lose, with the running total
A single worked winner proves nothing, so here is a five-trade log using the same rules and the same 500-dollar risk. Day one is the worked GBPUSD trade above. Day two is a failed setup on EURUSD where the retest closed back above the broken trendline and stopped me out for the full 500 dollars. Day three is the bullish mirror image on GBPUSD: a falling lead-in trendline, a capitulation bump downward, a break up through the line, and a failed retest from above that paid the same 750 dollars. Day four is a USDJPY setup that broke the trendline but never retested, so the entry never triggered and no trade was taken; I include it because a setup that never triggers is a win for the daily limit, not a missed opportunity. Day five is a second GBPUSD bump top that paid 750 dollars. Three winners and one loser across four taken trades, plus one skipped setup, net 1,250 dollars, or 2.5 times the risk.
| Day | Pair and direction | Result | Running total |
|---|---|---|---|
| 1 | GBPUSD short, bump top | +750 dollars (1.5R) | +750 dollars |
| 2 | EURUSD short, retest failed upward | -500 dollars (-1R) | +250 dollars |
| 3 | GBPUSD long, bullish inverse bump | +750 dollars (1.5R) | +1,000 dollars |
| 4 | USDJPY short, break with no retest | No trade taken | +1,000 dollars |
| 5 | GBPUSD short, bump top | +750 dollars (1.5R) | +1,250 dollars |
Notice what the log does not contain: no second trade on the losing day to win it back, no doubled size after a winner, and no trade taken just because the shape appeared. On day two, after the 500-dollar loss, I had one losing trade left before my personal daily stop, and I did not spend it chasing the same pair. That restraint is part of the strategy: reversals cluster, and a strategy that lets you trade five times a day will eventually hand the firm your daily limit in one session.
When the pattern fails, and what I do instead
The pattern fails in four familiar ways. First, the bump keeps going: price never rolls over, the trendline break never comes, and anyone who shorted the top early is carried higher. The six rules prevent this entirely, because there is no entry until the break and the failed retest. Second, the break is a fake: price closes through the trendline, retests, and then closes back above it. That is day two in the log, a planned 500-dollar loss, and the correct response is to accept it and stop, not to re-enter on the next candle. Third, the run stalls immediately: price breaks the line, retests, falls a few pips, and then grinds sideways. The first target at 1R is designed for this case, banking half the position before the stall can turn into a reversal of the reversal. Fourth, the pattern appears in a strong trend that is not exhausted at all: the bump height passes the test, but the wider trend is driven by a genuine fundamental shift, and the run reverses back into the trend within a day. The session filter and the 30-minute news rule reduce this case, but they do not eliminate it, which is why the stop is always 500 dollars and never a hope.
The most common mistake with this pattern is drawing the trendline to fit the bump. If you anchor the line to the bump’s own lows, every acceleration looks valid. The line must come from the lead-in phase, drawn before the bump, with at least three touches. The second mistake is trading the pattern on a five-minute chart overnight, where a 20-pip bump passes the height test but means nothing. I trade it on the one-hour chart and above. The third mistake is sizing from the bump peak: a stop above the peak doubles the stop distance, halves the size, and turns a clean retest trade into a lottery ticket.
How it fits the funded-account rules
The bump and run reversal fits funded-account rules better than most reversal strategies, for one reason: it has a built-in waiting period. The pattern cannot be traded until the lead-in, the bump, the rollover, the break, and the failed retest have all happened in order, which means it produces a small number of high-quality setups rather than a stream of marginal ones. That scarcity protects the consistency rule, because a strategy that trades twice a week cannot produce one outsized winning day that dwarfs the rest of the week. It protects the daily loss limit, because the 500-dollar risk and the two-loss personal stop cap any single day at minus 1,000 dollars. And it protects the minimum trading days rule, because the waiting period forces patience across sessions rather than cramming trades into one afternoon.
Where it differs from the other reversal strategies on this site is worth stating plainly. A trend pullback trades with the trend after a dip; the bump and run trades against an exhausted trend after a blow-off. A head and shoulders reversal needs a three-peak structure and a neckline; the bump and run needs a trendline and a height ratio. A break and retest trade can trigger on any level break; the bump and run only triggers when the break resolves a measured speculative excess. Keep their triggers separate and each one earns its place.
The daily routine for this pattern
My routine for this pattern is deliberately short, because the pattern itself does most of the filtering. In the morning I scan the one-hour charts for lead-in trendlines with at least three touches, and I mark any pair where a bump is forming. I do not trade the bump. I wait for the rollover, the close through the trendline, and the failed retest, and I only take the trade if it arrives in the London or New York session and outside the 30-minute news window. I calculate the size from the retest stop using the position sizing formula, and I set both targets before entry. After two losing trades, I stop for the day, and I log whether the bump passed the height test, whether the retest truly failed, and whether the session filter was respected, so the next setup is judged against the rules, not my mood.
For the full pattern reference, including Bulkowski’s original phase definitions, see the LuxAlgo bump and run reversal guide. My rules are stricter than a generic pattern description in exactly two places: I require the failed retest before entry, and I cap the stop at 80 pips. Both restrictions exist because of the funded account, not the chart: on a funded account, the daily limit is the strategy.
One last note from the losing trade that opened this guide. The trader who shorted the blow-off top early was not wrong about the direction; price did eventually reverse. He was wrong about the timing, and on a funded account timing is the whole game, because a stop-out at the wrong moment costs the same 500 dollars whether the idea was right or not. The bump and run reversal does not promise to catch every top. It promises a small number of trades where the timing is confirmed by a broken trendline and a failed retest, sized so that being wrong costs 500 dollars and being right pays 750. Trade it that way, with the personal daily stop from my personal daily stop guide, and the pattern becomes a rule you can repeat.
Frequently asked questions
What is a bump and run reversal?
It is a three-phase reversal pattern: an orderly lead-in advance along a trendline, a sharp speculative bump away from that trendline, and a run phase that begins when price breaks back through the lead-in trendline. The trade is taken on the failed retest after the break, not during the bump itself.
How do I know the bump is valid?
Measure the bump height vertically from its peak down to the lead-in trendline, and compare it with the lead-in height, measured from the highest lead-in high down to the same trendline. The bump must be at least twice as tall as the lead-in height, and visibly steeper. If either test fails, it is a strong trend leg, not a blow-off.
Why do you enter on the retest instead of the break?
The retest entry gives a tighter stop, a better price, and a clear invalidation point: a close back above the broken trendline. Entering on the break often means entering at the most extended candle of the move, with a stop wide enough to survive the retest that usually follows.
Where should the stop go?
Above the highest retest candle, plus a small buffer. It should not go above the bump peak, because that doubles the stop distance, halves the size, and keeps you in a trade whose retest invalidation you have already passed. If the retest stop exceeds 80 pips, skip the trade.
What size do I trade on a 100,000-dollar funded account?
Risk 500 dollars per trade and divide by the stop distance in pips multiplied by the pip value per lot. For GBPUSD at a 50-pip stop, that is 500 divided by 50 times 10, which is 1.00 lot. The sizing grid in this guide covers stop distances from 30 to 100 pips.
When does the pattern fail most often?
When the break is a fake and price closes back above the broken trendline, when the pattern is traded in thin overnight hours, and when the trendline is drawn after the bump to fit the move. All three failures are prevented by the six rules: a close through the line, a failed retest, a session filter, and a trendline drawn from the lead-in phase before the bump.
Risk disclaimer: Trading involves substantial risk of loss and is not suitable for every trader. The examples in this guide use a simulated funded-account structure for education only and are not financial advice. Never risk money you cannot afford to lose, and always follow your firm’s written rules.



