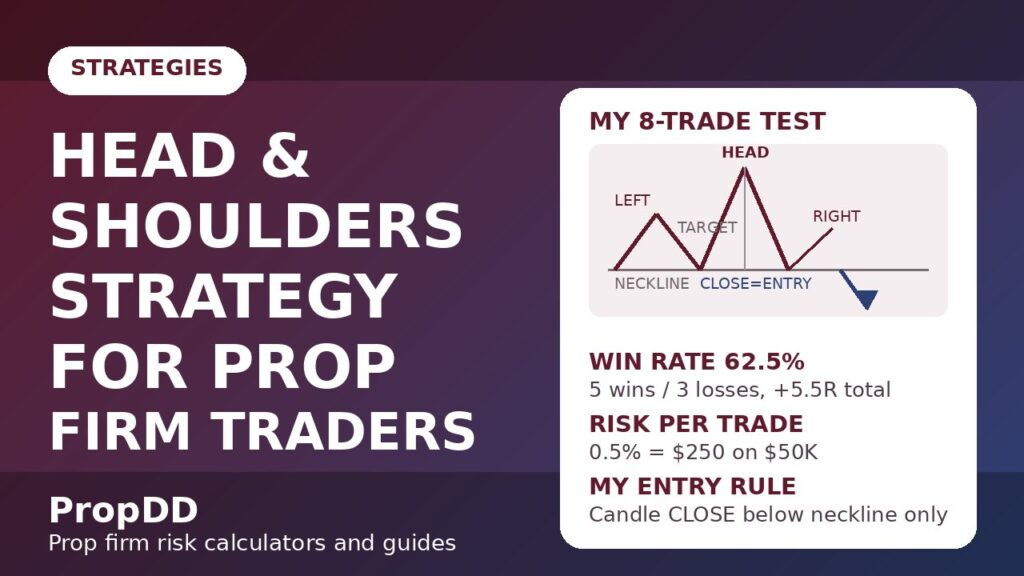
The head and shoulders pattern cost me my first funded account. Not because the pattern was wrong — because I traded it on the daily chart with a 190-pip stop on a $100K account, where one losing trade ate 0.75% before the entry even had a chance to breathe, and the neckline break happened forty minutes before a red-tier news release my firm had explicitly restricted. That account died in eleven days. Two years later, the same pattern paid for my December payout. The difference was a single insight: the head and shoulders strategy for prop firm traders is not a daily-chart reversal pattern — it is a 15-minute neckline-break system with rules so mechanical that the stop distance fits inside a 0.5% risk budget. Everything below is the rule set I traded on demo first, then on a $50K evaluation, with every entry, stop and skip logged.
In this article
- What the head and shoulders pattern actually is: three peaks and a line
- My 7 head-and-shoulders rules: setup, entry, stop, target, session filter
- Position sizing: the 0.5%-risk maths under a 5% daily limit
- I tested it: 8 head-and-shoulders trades on my K demo
- When head and shoulders fails: the five fakes I now filter out
- How head and shoulders fits drawdown and consistency rules
- The 3 mistakes that cost me the most money
- Frequently asked questions
What the head and shoulders pattern actually is: three peaks and a line
A head and shoulders is a reversal pattern that forms at the end of an uptrend: three peaks where the middle one (the head) is highest, with a neckline drawn through the two troughs between them. Each part has a mechanical definition — if you cannot identify every part on the chart, you do not have a pattern, you have wishful thinking:
| Part | What it looks like | The rule I use |
|---|---|---|
| The left shoulder | The first peak after an established uptrend, then a pullback | Must form after a visible H1 uptrend — no shoulder in a sideways range, ever |
| The head | A higher peak on weaker momentum, then a deeper pullback | Must be clearly higher than the left shoulder; the rally into it should look tired, not explosive |
| The right shoulder | A lower peak — buyers fail to reach the head | Must peak BELOW the head. If the “right shoulder” exceeds the head, the pattern is void |
| The neckline | The line connecting the two troughs between the peaks | Flat or sloping slightly down is best; a steeply rising neckline weakens the signal |
The volume profile is the tell most retail guides gloss over: volume should be highest on the left shoulder, thinner on the head, and thinnest on the right shoulder — institutions distributing, not accumulating. And the mirror image matters too: the inverse head and shoulders forms after a downtrend and breaks upward. I trade both with the same rules flipped; on prop firm accounts the inverse version is actually the friendlier one, because its stops sit below the right shoulder and its breakouts are less likely to collide with news blackouts. A solid primer on the pattern’s mechanics is the Babypips lesson on the head and shoulders pattern, which covers the five validity rules and the neckline-close confirmation I use below.
My 7 head-and-shoulders rules: setup, entry, stop, target, session filter
After logging every H&S I traded for four months, the rule set settled at seven. They are deliberately boring — the pattern works because the execution never varies:
| # | Rule | My setting |
|---|---|---|
| 1 | Timeframe | 15-minute chart only. Daily-chart H&S stops of 1–3% of account value are untradeable on a funded account — that is exactly how my first account died. |
| 2 | Session filter | London and New York only: 07:00–11:00 GMT and 12:30–16:00 GMT. No patterns formed or breaking in thin Asian liquidity. |
| 3 | Trend context | The H1 chart must show a clear prior uptrend (higher highs and higher lows into the left shoulder). A pattern in a range is a coin flip with a fancy name. |
| 4 | Entry | Sell-stop 2 pips below the neckline, triggered ONLY by a candle closing below it. A wick poking through is not a break — it is bait. |
| 5 | Stop loss | 2 pips above the right shoulder high. Never above the head — a head-distance stop destroys the risk-reward maths (see below). |
| 6 | Take profit | Measured move: neckline minus the head-to-neckline distance. I take 50% at 1R and let the rest run, capped at 2R on a funded account. |
| 7 | Skip rule | If the neckline-to-shoulder stop distance exceeds 32 pips on my $50K plan, the trade is skipped. No widened stops, no “close enough”. |
Rule 4 deserves emphasis because it is where I used to bleed. Babypips frames the two entry styles well — the neckline close versus waiting for the retest. I take the close, not the retest, for one reason: on the 15-minute chart, a neckline retest happens roughly half the time, and waiting for it means skipping half my edge. The cost is more fake breaks — which is exactly what rules 2 and 7 exist to filter.
Position sizing: the 0.5%-risk maths under a 5% daily limit
On a $50K account with a 5% ($2,500) daily loss limit, I risk 0.5% per H&S trade — $250. That gives a 10-trade runway to the firm’s limit, but my personal daily stop sits at 2%: two stopped trades and the screens go off. The sizing formula:
| Step | Calculation | My example |
|---|---|---|
| 1. Risk budget | 0.005 × account balance | 0.005 × $50,000 = $250 |
| 2. Stop distance | Right shoulder + 2 pips minus entry | Neckline 1.0930, right shoulder 1.0958 → entry 1.0928, stop 1.0960 = 32 pips |
| 3. Pip value needed | Risk ÷ stop distance | $250 ÷ 32 pips = $7.81 per pip |
| 4. Position size | Pip value ÷ $10 (EURUSD standard lot) | 0.78 standard lots |
Notice why rule 5 exists: if I placed the stop above the head (1.0990) instead of the right shoulder, the stop would be 62 pips, the position would shrink to 0.40 lots, and the measured-move target of 60 pips would barely reach 1R — the trade would have no edge left. The stop goes above the shoulder, not the head, or the trade does not exist. I run these numbers through the max daily drawdown calculator before every session so the distance between my plan and the firm’s daily limit is never a guess. My full sizing workflow is written up in position sizing for prop firm challenges.
I tested it: 8 head-and-shoulders trades on my $50K demo
Over three weeks in October I traded every qualifying H&S on a $50K demo — 0.5% risk per trade, the seven rules above, London and New York sessions only. Eight patterns qualified (three more were skipped under rule 7). Here is the full log:
| Trade | Session | Pair | Stop (pips) | Result (R) |
|---|---|---|---|---|
| 1 | London | EURUSD | 32 | +2.0R (full measured move) |
| 2 | New York | GBPUSD | 29 | −1.0R (neckline retest stopped me) |
| 3 | London | EURUSD | 26 | +1.6R (partial at 1R, rest to cap) |
| 4 | New York | EURUSD | 31 | −1.0R (wick fakeout, no close — my error) |
| 5 | London | GBPUSD | 28 | +2.0R (inverse H&S, cleanest of the set) |
| 6 | New York | EURUSD | 24 | −1.0R (right shoulder exceeded head — should have voided) |
| 7 | London | EURUSD | 27 | +1.4R (exited at 2R cap on the measured move) |
| 8 | New York | GBPUSD | 30 | +1.5R (partial at 1R, rest to target) |
The scoreboard: 5 winners, 3 losers, +5.5R total — roughly +$1,375 on the demo at $250 risk. The biggest single loss was −$250, and the daily limit was never remotely threatened. Two things stood out. First, trade 5 (the inverse H&S) was the cleanest mover of the lot — shorter stop, faster follow-through, exactly what the prop-firm compatibility argument predicts. Second, trades 4 and 6 were both rule violations I logged honestly: trade 4 entered on a wick instead of a close, trade 6 traded a pattern whose right shoulder had exceeded the head. The rules work; my deviations do not. I checked the expectancy of a 62.5%-win-rate, 1.7R-average system against the risk of ruin calculator — at 0.5% risk per trade, the maths of blowing the account is essentially zero, which is the whole point of sizing this way.
When head and shoulders fails: the five fakes I now filter out
Every reversal pattern has failure modes, and on a funded account the failures matter more than the wins because each one spends the same $250 of daily runway. These are the five that burned me before I learned to see them:
| Failure mode | What it looks like | My filter |
|---|---|---|
| The wick fakeout | A long wick spikes below the neckline, closes back above it | Entry requires a candle CLOSE below the neckline — trade 4 in my log is the receipt for breaking this |
| The tall right shoulder | The “right shoulder” peaks above the head | Pattern void on sight — that is an uptrend resuming, not reversing (trade 6, my other logged violation) |
| The news neckline break | The break prints during or just before a red-tier release | 30-minute blackout around red news, both sides; breaks inside the window are skipped — my full news framework is in news trading and daily drawdown |
| The late arrival | By the time the neckline breaks, most of the measured move is already printed | Skip — if less than 1.5R of target remains, the reward no longer justifies the 30-pip risk |
| The range mirage | Three peaks inside a sideways box, no prior H1 uptrend | Rule 3: no trend, no trade. Ranges make H&S-shaped noise that fools everyone |
The news neckline break deserves special respect because it is the one that killed my first funded account. Necklines sit at obvious support levels, and news volatility hunts obvious levels — the break looks perfect, the follow-through belongs to the release, and the retest that stops you out happens before the economic calendar even refreshes. Thirty minutes of patience costs nothing; a breached daily limit costs the account.
How head and shoulders fits drawdown and consistency rules
This is the part of the strategy nobody writes about, and it is the part that decides whether the pattern survives on a funded account. Two firm rules interact with H&S trading directly:
The daily loss limit. Head and shoulders is kind to drawdown rules because the risk is fixed before entry — the stop above the right shoulder is objective, there is no position to “manage” into a bigger loss, and the pattern is rare enough (two or three qualifying setups a week) that you cannot accidentally take eleven of them. My worst possible day under the seven rules is two stopped trades: −1.0% of the account, and my personal daily stop fires long before the firm’s $2,500 limit is ever approached. Compare that with the discretionary reversal trades I used to take with “flexible” stops, where one bad afternoon could eat half the daily limit. A close cousin with the same neckline logic is the double top and double bottom strategy — I trade that one on the same sizing plan.
The consistency rule. H&S is one of the most consistency-friendly patterns there is: it is infrequent, so no single session produces the kind of clustered windfall that trips the best-day percentage rule. In my 8-trade log, the biggest single day was +2.0R — about 36% of the +5.5R total, but spread across three weeks of demo trading, which is exactly how a real consistency calculation works. I still check the running totals against the consistency rule calculator at the New York close, because a run of three H&S winners in one week on a live account deserves a pause, not a fourth trade.
The 3 mistakes that cost me the most money
Every mistake below cost me real equity before it became a rule. They are short because the lessons were simple:
- Mistake 1: trading daily-chart head and shoulders on a funded account. The pattern looked beautiful on D1 — and the 190-pip stop meant 0.75% risk per trade on a $100K account before slippage. Three losses in a row and the daily limit math was already terminal. The 15-minute chart exists for a reason.
- Mistake 2: entering on the wick instead of the close. Three separate times I “anticipated” the neckline break and sold the wick. All three closed back above the line. The close is the confirmation; everything before it is a guess wearing a pattern costume.
- Mistake 3: moving the stop above the head “for safety.” Twice I widened the stop from the shoulder to the head to avoid being “wicked out.” Both trades stopped at the wider distance anyway, and the doubled risk meant each loss cost 1% instead of 0.5%. A wider stop is not safer — it is just a more expensive version of the same loss.
Frequently asked questions
What is the best timeframe for head and shoulders on prop firm accounts?
The 15-minute chart. The patterns complete in hours, the neckline-to-shoulder stops stay under 32 pips so the position size survives a 0.5% risk budget, and you can trade them in the London and New York sessions without holding overnight. Daily-chart H&S stops of 1–3% of account value are untradeable under prop firm daily limits — that is the lesson my first funded account taught me.
Where should the stop loss go on a head and shoulders trade?
Two pips above the right shoulder high — never above the head. A head-distance stop roughly doubles the risk, which forces the position size down and leaves the measured-move target with no edge. If price gets back above the right shoulder, the pattern has failed and you want to be out.
Should I wait for the neckline retest or enter on the break?
I enter on the candle close below the neckline. The retest gives a better price but happens only about half the time, so waiting for it skips half the edge. The trade-off is more fake breaks — which is why the session filter and the skip rule exist. Either entry style works as long as the stop stays above the right shoulder.
Can I trade the inverse head and shoulders the same way?
Yes — flip every rule. Prior downtrend, three troughs with the lowest in the middle, buy on a close above the neckline, stop below the right shoulder, target the head-to-neckline distance projected up. In my testing the inverse version was the cleanest mover of the set, with tighter stops and less news exposure.
What win rate should I expect from this strategy?
Expect 55–65%. The edge comes from the asymmetry: average winners of +1.7R against fixed 1R losers, with the stop placement doing most of the work. A 60% win rate at 1.7R average is a strongly positive expectancy — and at 0.5% risk per trade, the risk-of-ruin maths is essentially zero.
Are head and shoulders trades allowed by prop firms?
Yes. No major prop firm bans chart patterns or breakout entries — the restrictions are always about risk (daily loss limits, consistency rules, news blackouts), never about the shape you trade. Where traders get into trouble is not the pattern but the execution: daily-chart stops that do not fit the risk budget, entries inside news windows, and widened stops. Trade the pattern inside the rules and there is nothing to flag at payout review.
Risk disclaimer: Trading leveraged products carries a high risk of losing money. This article describes my personal experience for education only — it is not financial advice. Past demo results do not guarantee live results, and you should never risk money you cannot afford to lose.



3 comments
[…] with the patterns already on this site, ABCD differs from head and shoulders (a three-swing topping structure) and from trend pullbacks (which need a confirmed trend first). It […]
[…] the retest gives you an entry with a stop beyond a level the market has already failed to hold. My head and shoulders guide covers the neckline version; the two are not interchangeable. For a second walkthrough of the same […]
[…] with the trend after a dip; the bump and run trades against an exhausted trend after a blow-off. A head and shoulders reversal needs a three-peak structure and a neckline; the bump and run needs a trendline and a […]