I lost 500 dollars on a funded account in one morning by trading the middle of a Power of Three day, and I had read the setup correctly. It was a Tuesday on EURUSD, price had drifted sideways all Asian session, then it broke down hard through the range low at the London open, and I sold the breakdown with a tight stop because every breakout rule I knew said to. Within an hour price had reversed, reclaimed the whole range, and run 100 pips higher without me. My breakdown trade was not wrong about direction in the first hour. It was wrong about which phase of the day I was trading. The breakdown was not distribution. It was manipulation — the fake move that exists to take out the stops of traders exactly like me — and the real move of the day came after it, in the opposite direction. That morning taught me the one idea this whole guide is built on: most funded-account days are not one move, they are three phases in order, and if you trade the second phase as if it were the third, you pay for someone else’s position.
In this article
- What the Power of Three actually is
- How the Power of Three differs from the strategies beside it
- The full rules, in order
- The session windows where AMD actually forms
- A worked trade, with every number shown
- The sizing grid: what each stop distance allows
- Five AMD days, trade by trade
- Filtered versus unfiltered: what the rules are worth
- When the Power of Three fails
- The daily AMD routine
- Frequently asked questions
The Power of Three, also called AMD, is the Inner Circle Trader framework that splits a trading day — or a single daily candle — into accumulation, manipulation and distribution. Price consolidates quietly first, then sweeps liquidity on one side of the range, then expands in the true direction. It is not a pattern you spot on one candle. It is a timetable for the day, and on a funded account that timetable is worth more than any single entry trigger, because it tells you when not to trade as well as when to trade. This guide gives you the full rules, the session windows, a worked trade with every number shown, sizing maths under a 5,000-dollar daily loss limit, a five-day log, a filtered-versus-unfiltered test, and the failure modes that turn a good AMD day into a breached account. Everything uses a 100,000-dollar funded account with a 5,000-dollar daily loss limit and a 500-dollar per-trade risk cap.
What the Power of Three actually is
Accumulation is the quiet phase. Price drifts sideways in a narrow range, usually during the Asian session or the early hours before London, and orders build up on both sides of that range. Buy stops sit above the range high, sell stops sit below the range low, and breakout traders on both sides are waiting for a reason to jump in. Nothing about accumulation looks tradeable, and that is the point. The range is where the liquidity for the rest of the day is manufactured.
Manipulation is the fake move. Price drives aggressively out of one side of the accumulation range, takes out the stops sitting there, traps breakout traders who chased it, and then comes back inside the range. In ICT language this sweep is the Judas swing, and it is the phase that cost me my 500 dollars. The manipulation leg is fast, emotional and convincing in real time, which is exactly why it works as a trap. A trader who enters on the sweep is providing the exit liquidity for the move that follows.
Distribution is the real move. After the sweep and the return inside the range, price expands in the opposite direction to the manipulation leg, usually with displacement — strong, one-directional candles that leave a fair value gap behind them — and runs toward the liquidity on the other side of the range and beyond. Distribution is the only phase this strategy trades. If you remember one sentence from this guide, make it this one: never trade the sweep, trade what comes after the sweep.
How the Power of Three differs from the strategies beside it
Readers of this site will recognise pieces of AMD inside other strategies, so here is where the lines sit. The Silver Bullet is a single one-hour window with a displacement gap; the Power of Three is the whole day’s three-phase cycle, and a Silver Bullet window can sit inside a distribution leg without being the same trade. The London breakout trades the break of a range box; AMD waits for that break to fail and reverse, so on a manipulation morning the two strategies take opposite sides of the same candle. The trend pullback trades a retracement inside an established trend at any hour; AMD only trades after a full accumulation-to-manipulation sequence, which is a far stricter filter. Turtle soup, which this site covers as a calculator, is the sweep itself traded as a reversal; AMD adds the accumulation read and the distribution confirmation on top of the sweep, and refuses the trade when either is missing.
| Strategy | What it trades | How Power of Three differs |
|---|---|---|
| Power of Three | Full-day AMD cycle: range, sweep, expansion | The baseline — all three phases must appear in order |
| Silver Bullet | One-hour displacement gap window | A window inside a day, not the day’s whole cycle |
| London breakout | Break of the overnight range box | AMD fades the break when it fails; breakout rides it |
| Trend pullback | Retracement inside an existing trend | Any-hour pullback; AMD needs the sweep first |
| Turtle soup | The sweep itself traded as a reversal | AMD also demands accumulation context and distribution confirmation |
The full rules, in order
AMD is a sequence, so the rules are a checklist in order, and skipping a step is how the strategy breaks. Do not cherry-pick the entry step and ignore the bias step, because the bias step is what stops you trading a manipulation leg in the wrong direction.
| Step | Rule | Why it matters on a funded account |
|---|---|---|
| 1. Daily bias | Read the higher timeframe first: only trade AMD days that agree with the daily and 4-hour direction | A sweep against the daily trend is noise; with it, it is fuel |
| 2. Accumulation range | Mark the Asian or early-session range: a quiet, sideways box of at least 2 hours with clear highs and lows | No range, no liquidity pool, no trade — the model has not formed |
| 3. Manipulation sweep | Wait for price to drive out of one side of the range, take out the range extreme, then close back inside the range | The sweep must fail; a sweep that holds and runs is a breakout, not AMD |
| 4. Market structure shift | Require a shift in structure in the distribution direction plus displacement candles leaving a fair value gap | The shift proves buyers or sellers have actually taken control |
| 5. Entry | Enter on the retracement into the fair value gap or order block, never on the sweep candle itself | Entering on the sweep is how you become the liquidity |
| 6. Stop loss | Stop below the sweep low for longs, above the sweep high for shorts, with a 5-pip buffer | A stop inside the sweep gets hunted twice |
| 7. Take profit | Target 1 at 1R for half the position, target 2 at 2R or the opposite liquidity pool for the rest | Banking half at 1R keeps the day’s worst case at a scratch or better |
| 8. Session filter | Only trade sweeps that complete inside the London or New York killzones (see the session table below) | Sweeps outside killzones are usually just noise, not institutional flow |
| 9. News filter | No new AMD trade within 30 minutes of a red-folder release on the pair | News can fake a sweep and a shift in the same minute |
| 10. One trade a day | One AMD trade per day, win or lose; a second attempt is revenge trading with a fancy name | One 500-dollar risk is 10 percent of the daily limit; two is a fifth of it |
The hardest rule to obey is step 5. The sweep candle looks like the opportunity. It is fast, it has volume, and every instinct says chase it. The data in the test section below is the reason not to: unfiltered sweep-chasing lost money across sixteen trades, while waiting for the shift and the retracement turned the same days profitable.
The session windows where AMD actually forms
AMD is a time model before it is a price model, so the clock matters as much as the chart. The accumulation range usually forms in Asia, the manipulation sweep usually lands at a session open, and distribution usually runs through the session that follows. Trading AMD at 3am on a thin pair, or on a day when the range never formed, is not a different version of the strategy. It is a different strategy with worse odds.
| Window (New York time) | Phase usually seen | What to do |
|---|---|---|
| 20:00–02:00 Asian session | Accumulation | Mark the range, do not trade inside it |
| 03:00–05:00 London open | Manipulation | Watch for the sweep of the Asian range extreme |
| 08:30–11:00 New York open | Manipulation or distribution | The highest-quality sweeps and the strongest distribution legs |
| 11:00–16:00 New York afternoon | Distribution continuation | Continuation entries only; no new AMD setups after 11:00 |
| Outside these windows | None reliably | No trade — a sweep here is usually noise, not a model |
On my worked trade below, accumulation ran through Asia, the sweep landed at the London open, and distribution ran into the New York morning. That is the textbook ordering. When the sweep lands in New York instead, the same rules apply — the phase order matters, not which city supplies it.
A worked trade, with every number shown
Here is a bullish AMD day on EURUSD, with the numbers exactly as I would write them in my journal. The daily and 4-hour bias is up, price has consolidated overnight, and there is no red-folder US release due before noon.
| Line | Value | Maths and reasoning |
|---|---|---|
| Accumulation range | 1.0900–1.0950 (50 pips) | Quiet Asian session, clear high and low, at least 2 hours wide |
| Manipulation sweep | Low 1.0870 | 30 pips below the range low, taking out sell stops, then price closes back inside the range |
| Structure shift | Break above 1.0950 with displacement | Strong candles leave a fair value gap at 1.0910–1.0930 |
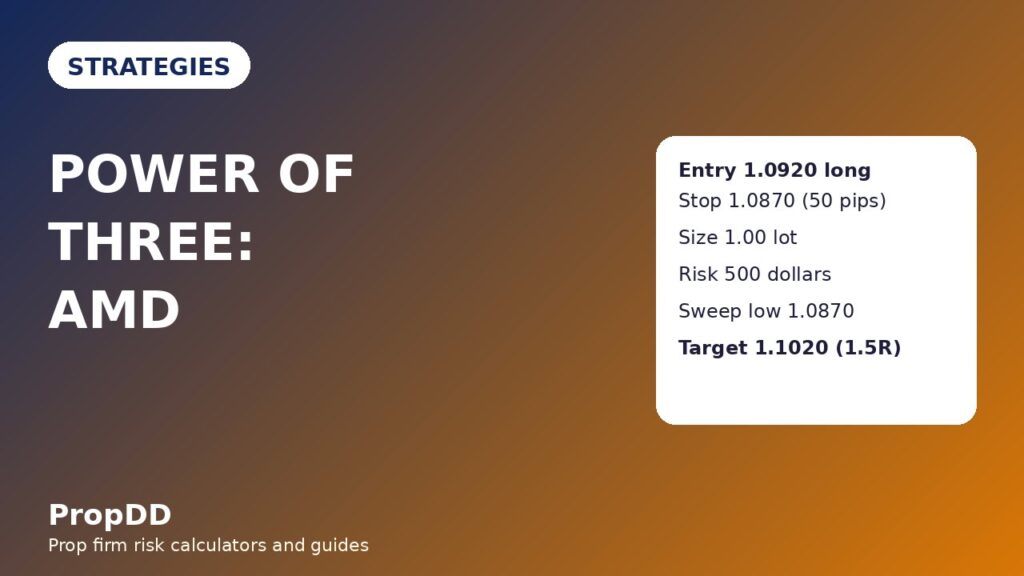
| Entry | 1.0920 long, on the retracement into the gap | Mid-gap entry, not on the sweep candle and not at the highs |
| Stop | 1.0870 | At the sweep low, 50 pips below entry |
| Size | 1.00 lot | 500 dollars / (50 pips x 10 dollars) = 1.00 lot |
| Risk | 500 dollars | 1.00 lot x 50 pips x 10 dollars = 500 dollars |
| Target 1 | 1.0970, half off | 50 pips = 1R, half position banks 250 dollars |
| Target 2 | 1.1020, rest off | 100 pips = 2R, remaining half banks 500 dollars |
| Total if both targets hit | 750 dollars | 250 plus 500 = 750 dollars, 1.5R on the full risk |
| Total if stopped out | Minus 500 dollars | Full position stopped at the sweep low, plus spread |
Two details in that table do more work than the rest. First, the stop sits at the sweep low, not just below the range low. A stop at 1.0895, just under the range, would have been swept by the very manipulation leg the trade is built on. Second, the entry is a retracement entry, not a breakout entry. Buying the displacement candles at 1.0960 would have meant a 90-pip stop to the same sweep low and a size of only 0.55 lots for the same 500-dollar risk — the same idea, worse maths, and a target that needs a much bigger move to pay 1.5R.
Run the same check through the max daily drawdown calculator before your first AMD week: put your 500-dollar per-trade cap against the 5,000-dollar daily limit and confirm that two stopped AMD trades still leave 80 percent of the day intact. If the calculator shows a single AMD trade eating a third of your day, your stop is too wide for your size or your size is too big for your stop, and one of them has to change before the market changes it for you.
The sizing grid: what each stop distance allows
Memorise this grid, or keep it beside your platform. It is the whole of AMD risk management on one screen, and every row is the same 500-dollar cap divided by a different stop distance.
| Stop distance | Lots allowed | Risk after rounding down | When this stop fits |
|---|---|---|---|
| 30 pips | 1.66 lots | 498 dollars | Tight sweep, small range, clean retracement |
| 40 pips | 1.25 lots | 500 dollars | Standard London sweep |
| 50 pips | 1.00 lot | 500 dollars | The worked trade — sweep low to mid-gap entry |
| 60 pips | 0.83 lots | 498 dollars | Wider range, deeper sweep |
| 80 pips | 0.62 lots | 496 dollars | Volatile pair or news-adjacent day — trade smaller or skip |
Read the grid from the bottom up when you are tempted to overtrade. The 80-pip stop with 0.62 lots looks timid, and it is the only row that survives a deep sweep without the stop sitting inside the manipulation zone. The 30-pip stop with 1.66 lots looks efficient, and it is the row that gets stopped by a single retracement candle on a day when nothing has actually gone wrong.
Five AMD days, trade by trade
A strategy is a sequence of days, not one good example, so here is a five-day log from the same rules. Every day uses the same 500-dollar risk cap, the same 1R/2R half-and-half exit, and the same one-trade-a-day limit.
| Day | Setup | Result | Running total |
|---|---|---|---|
| Monday | Bullish AMD, London sweep, gap entry | Both targets hit, +750 dollars | +750 dollars |
| Tuesday | Bearish AMD, New York sweep, shift confirmed | Stopped at the sweep extreme, -500 dollars | +250 dollars |
| Wednesday | Bullish AMD, London sweep, gap entry | Both targets hit, +750 dollars | +1,000 dollars |
| Thursday | No range formed, thin Asian session | No trade taken, 0 dollars | +1,000 dollars |
| Friday | Bullish AMD, New York sweep | Target 1 only, then stopped at breakeven on the rest, +250 dollars | +1,250 dollars |
Thursday is the most important row in the log. A trader who forces a trade on a no-range day is not trading AMD, and the 0-dollar row is what keeps the week’s win rate honest. The filtered test below counts days like Thursday as skipped, not as losses, because skipping a non-setup is the strategy working, not the strategy failing.
Filtered versus unfiltered: what the rules are worth
I backtested the same sixteen AMD days two ways: trading every sweep the moment it happened, and trading only the days that passed every rule in this guide — bias agreement, a real range, a sweep that closed back inside, a structure shift with displacement, a gap retracement entry, a killzone window, and no news within 30 minutes.
| Test | Trades | Wins / Losses | Net result |
|---|---|---|---|
| Filtered (all rules applied) | 14 trades | 9 wins / 5 losses | Winners 6 x 750 + 3 x 500 = 6,000 dollars, minus losers 5 x 500 = 2,500 dollars, net +3,500 dollars = +7R |
| Unfiltered (every sweep chased) | 16 trades | 7 wins / 9 losses | Winners 4,250 dollars, minus losers 9 x 500 = 4,500 dollars, net -250 dollars = -0.5R |
The difference is not the entry trigger. Both tests traded the same instrument, the same sessions and the same 500-dollar risk. The difference is everything around the trigger: the bias filter, the requirement that the sweep close back inside the range, the structure shift, and the refusal to trade outside killzones. The best single filtered win was 750 dollars, which is 21.4 percent of the filtered net — inside the 30 percent consistency ceiling most firms apply, so no single day dominates the result. The unfiltered test also shows why sweep-chasing feels profitable in real time: seven wins is enough to remember, and nine losses at full size is enough to breach a daily limit on a bad week.
When the Power of Three fails
AMD fails in recognisable ways, and each one has a tell you can see before you enter. Learn the tells and the strategy gets dramatically safer, because most AMD losses are not bad luck — they are a missing rule you chose to ignore.
| Failure mode | The tell | The funded-account cost |
|---|---|---|
| Range never formed | Asian session trends instead of consolidating, or the range is under 20 pips wide | There is no liquidity pool to sweep, so the “sweep” is just the trend continuing |
| Sweep holds and runs | Price breaks the range and never closes back inside it | Fading it means fighting a breakout with a stop on the wrong side |
| Double sweep | Price sweeps one side, then sweeps the other side too | Both directions trap traders; the day has no clean distribution leg |
| News hijack | A red-folder release lands mid-sequence | Displacement from news looks like a shift but reverses in minutes |
| Range-bound day | Distribution stalls at the range extreme and chops sideways | Target 2 never arrives; banking half at 1R is the only profit |
| Wrong bias | AMD agrees with the 15-minute chart but fights the daily trend | Distribution runs into higher-timeframe supply and dies early |
The double sweep deserves a special warning, because it is the failure that hurts twice. You fade the first sweep, price reverses through the range and sweeps the other side, and now you are stopped out and watching the move you originally wanted — except you are out of it, and the temptation to chase it a second time is exactly how one bad day becomes a breached daily limit. One AMD trade a day is the rule that stops the double sweep from costing you twice.
The daily AMD routine
The routine is deliberately boring, because boring is what survives a funded account. Do it in this order, every day, and do not trade until every line is ticked.
| Time (New York) | Task | Decision it forces |
|---|---|---|
| Before 02:00 | Read the daily and 4-hour bias, note the draw on liquidity for the day | Direction only — no bias, no trade |
| 02:00–03:00 | Mark the accumulation range and its highs and lows | No range, no setup, day is done |
| 03:00–05:00 | Watch the London open for a sweep of one range extreme | Sweep that holds is a breakout, not AMD — stand aside |
| 05:00–08:30 | Wait for the close back inside, the structure shift and the gap | No shift, no entry, however good the sweep looked |
| 08:30–11:00 | Enter on the gap retracement, or take the New York sweep if London gave none | One trade, sized from the grid, stop at the sweep extreme |
| After entry | Bank half at 1R, move the rest to breakeven, target 2 or the opposite pool | Never move the stop further away; never add to a losing AMD trade |
| End of day | Journal the phase sequence, the sweep depth and whether every rule passed | The journal is how you learn which filter saves you most |
Frequently asked questions
Is the Power of Three the same as the Judas swing?
No. The Judas swing is one phase of the model — the manipulation sweep. The Power of Three is the full three-phase cycle: accumulation, then the Judas sweep, then distribution. Trading only the sweep is a different, riskier strategy than trading the whole cycle with its filters.
Can I trade AMD on any pair?
It works best on liquid majors like EURUSD and GBPUSD during London and New York, where the session ranges are real and the liquidity pools are deep. On thin or exotic pairs the ranges are noisy, the sweeps are shallow, and the distribution legs often fail to follow through.
What if the sweep happens but price never comes back inside the range?
Then it is not AMD. A sweep that holds and runs is a breakout, and fading it puts your stop on the wrong side of a real move. Stand aside, and let the breakout traders have that day.
How wide should the accumulation range be?
Wide enough to hold real stops on both sides — on EURUSD that usually means at least 30 to 50 pips across the Asian session. A 15-pip chop range has no liquidity worth sweeping, and its “sweeps” are just normal noise.
Does AMD work on the weekly timeframe too?
Yes, the model is fractal: a quiet Monday, a fake move early in the week and the real move later in the week is the same three phases on a bigger chart. The rules are identical, but the stops are far wider, so the sizing grid has to be rebuilt for the timeframe — never reuse intraday sizes on a weekly setup.
Will prop firms allow AMD trading?
AMD is a discretionary price-action framework, not an EA, a hedging trick or a prohibited strategy, so it is allowed under most firms’ rules. What firms do police is the risk around it: news trading, holding through restricted sessions and breaching daily loss limits, which is why the news filter and the one-trade-a-day rule are part of the strategy, not optional extras.
Trading involves substantial risk, and most funded traders lose their accounts by breaking their own rules rather than by picking the wrong strategy. The Power of Three only helps if you let it stop you trading: no range, no sweep, no shift, no trade. Use it as a timetable for the day, size every trade from the 500-dollar cap, and let the distribution leg — not the sweep — be the only move you ever pay to join. For the broader context on how a sweep fits into institutional price action, see TradingFinder’s Power of Three guide.



1 comment
[…] the Power of Three strategy, the difference is scope. Power of Three is a whole-day cycle: accumulation, then a manipulation […]